
|
|||||
|
 | |
| |
| |
| |
| |
| |
|
Gene: SRD5A1 |
Gene summary for SRD5A1 |
| Gene information | Species | Human | Gene symbol | SRD5A1 | Gene ID | 6715 |
| Gene name | steroid 5 alpha-reductase 1 | |
| Gene Alias | S5AR 1 | |
| Cytomap | 5p15.31 | |
| Gene Type | protein-coding | GO ID | GO:0000003 | UniProtAcc | P18405 |
Top |
Malignant transformation analysis |
| Identification of the aberrant gene expression in precancerous and cancerous lesions by comparing the gene expression of stem-like cells in diseased tissues with normal stem cells |
| Entrez ID | Symbol | Replicates | Species | Organ | Tissue | Adj P-value | Log2FC | Malignancy |
| 6715 | SRD5A1 | LZE4T | Human | Esophagus | ESCC | 2.23e-06 | 1.56e-01 | 0.0811 |
| 6715 | SRD5A1 | LZE22T | Human | Esophagus | ESCC | 7.00e-06 | 4.33e-01 | 0.068 |
| 6715 | SRD5A1 | LZE24T | Human | Esophagus | ESCC | 7.10e-05 | 2.25e-01 | 0.0596 |
| 6715 | SRD5A1 | P1T-E | Human | Esophagus | ESCC | 4.94e-13 | 9.69e-01 | 0.0875 |
| 6715 | SRD5A1 | P2T-E | Human | Esophagus | ESCC | 7.08e-17 | 5.08e-01 | 0.1177 |
| 6715 | SRD5A1 | P4T-E | Human | Esophagus | ESCC | 1.83e-15 | 4.34e-01 | 0.1323 |
| 6715 | SRD5A1 | P5T-E | Human | Esophagus | ESCC | 3.80e-08 | 3.43e-01 | 0.1327 |
| 6715 | SRD5A1 | P8T-E | Human | Esophagus | ESCC | 2.47e-13 | 2.14e-01 | 0.0889 |
| 6715 | SRD5A1 | P9T-E | Human | Esophagus | ESCC | 1.14e-07 | 9.67e-02 | 0.1131 |
| 6715 | SRD5A1 | P10T-E | Human | Esophagus | ESCC | 6.61e-17 | 3.04e-01 | 0.116 |
| 6715 | SRD5A1 | P11T-E | Human | Esophagus | ESCC | 1.67e-08 | 3.35e-01 | 0.1426 |
| 6715 | SRD5A1 | P12T-E | Human | Esophagus | ESCC | 3.31e-10 | 3.60e-01 | 0.1122 |
| 6715 | SRD5A1 | P15T-E | Human | Esophagus | ESCC | 2.28e-07 | 1.14e-01 | 0.1149 |
| 6715 | SRD5A1 | P16T-E | Human | Esophagus | ESCC | 3.87e-16 | 2.60e-01 | 0.1153 |
| 6715 | SRD5A1 | P17T-E | Human | Esophagus | ESCC | 2.08e-10 | 6.32e-01 | 0.1278 |
| 6715 | SRD5A1 | P19T-E | Human | Esophagus | ESCC | 3.28e-02 | 4.93e-01 | 0.1662 |
| 6715 | SRD5A1 | P20T-E | Human | Esophagus | ESCC | 1.44e-54 | 1.36e+00 | 0.1124 |
| 6715 | SRD5A1 | P21T-E | Human | Esophagus | ESCC | 1.57e-13 | 4.17e-01 | 0.1617 |
| 6715 | SRD5A1 | P22T-E | Human | Esophagus | ESCC | 4.99e-11 | 2.52e-01 | 0.1236 |
| 6715 | SRD5A1 | P23T-E | Human | Esophagus | ESCC | 4.13e-18 | 6.28e-01 | 0.108 |
| Page: 1 2 3 4 5 6 |
| Tissue | Expression Dynamics | Abbreviation |
| Esophagus |  | ESCC: Esophageal squamous cell carcinoma |
| HGIN: High-grade intraepithelial neoplasias | ||
| LGIN: Low-grade intraepithelial neoplasias | ||
| Liver | 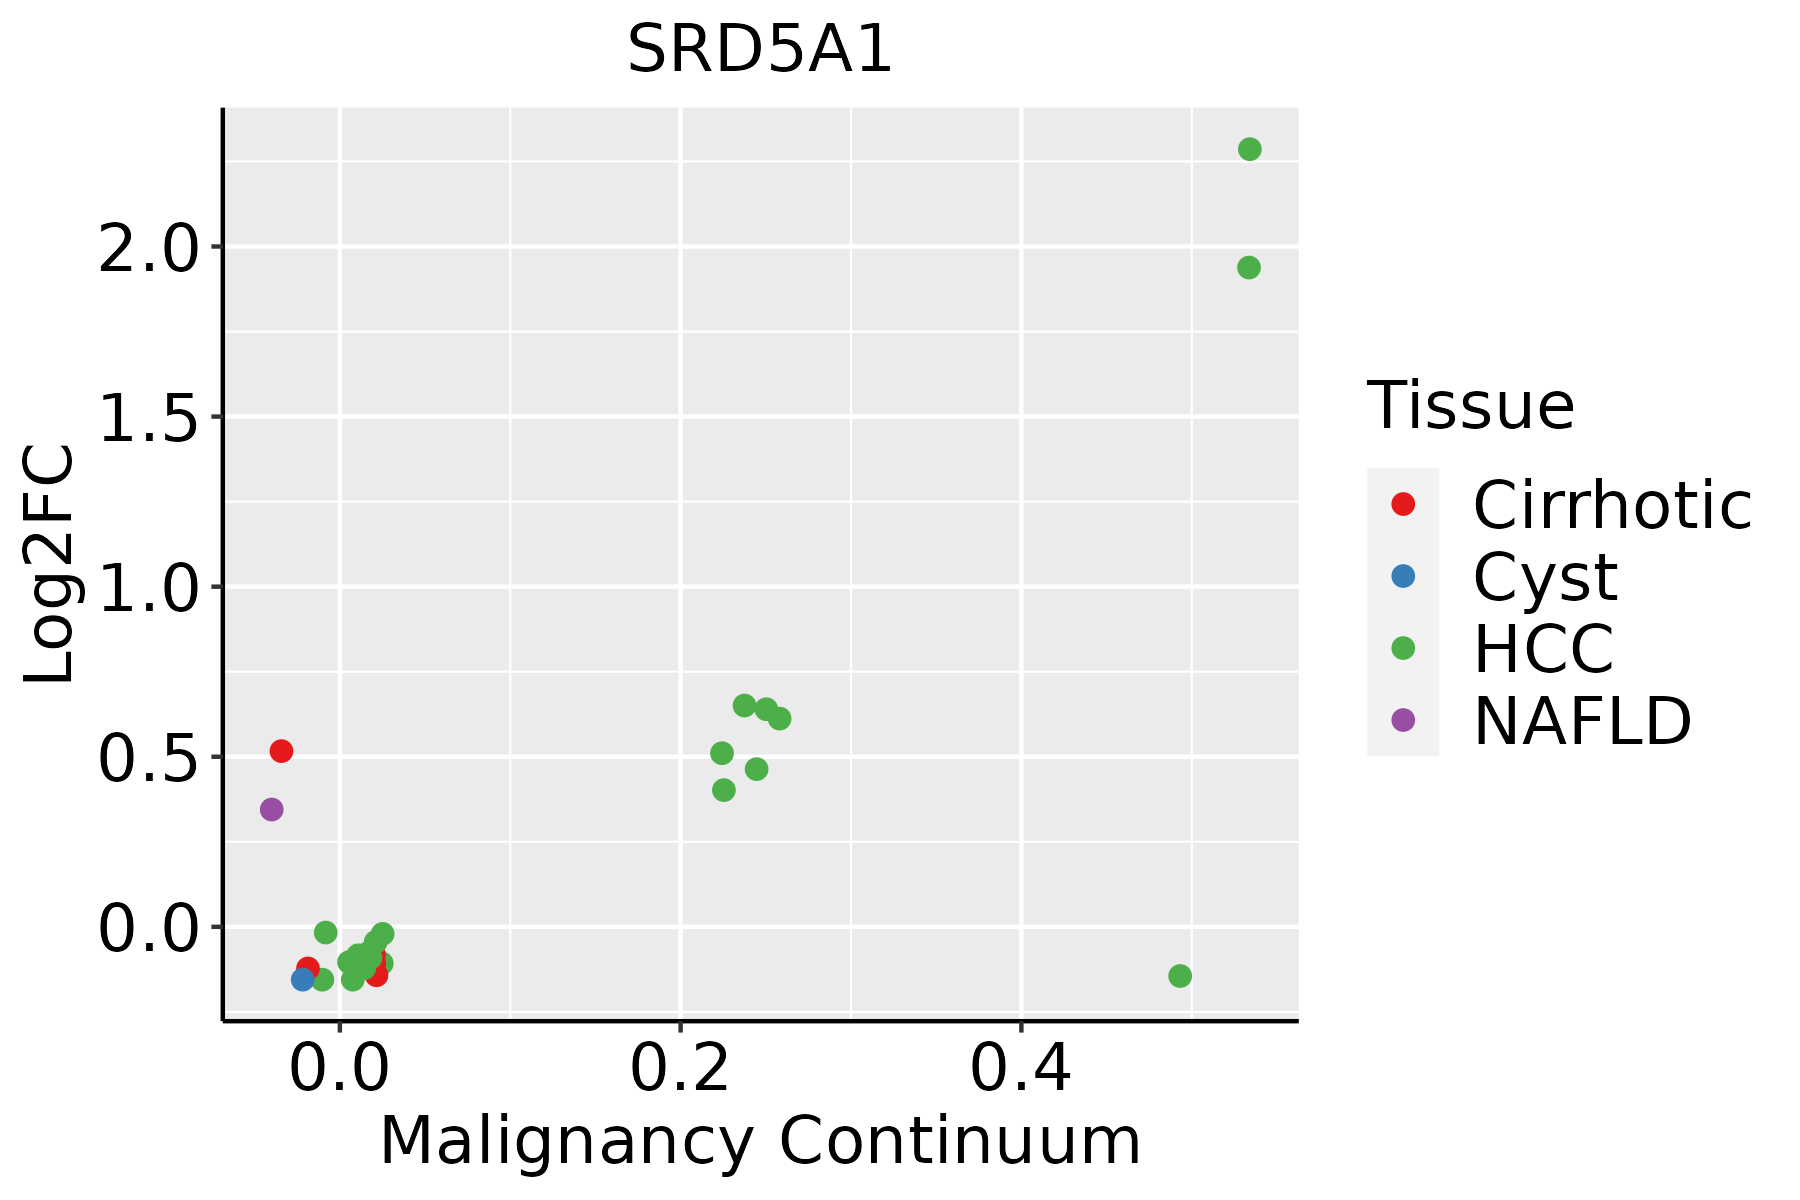 | HCC: Hepatocellular carcinoma |
| NAFLD: Non-alcoholic fatty liver disease | ||
| Oral Cavity | 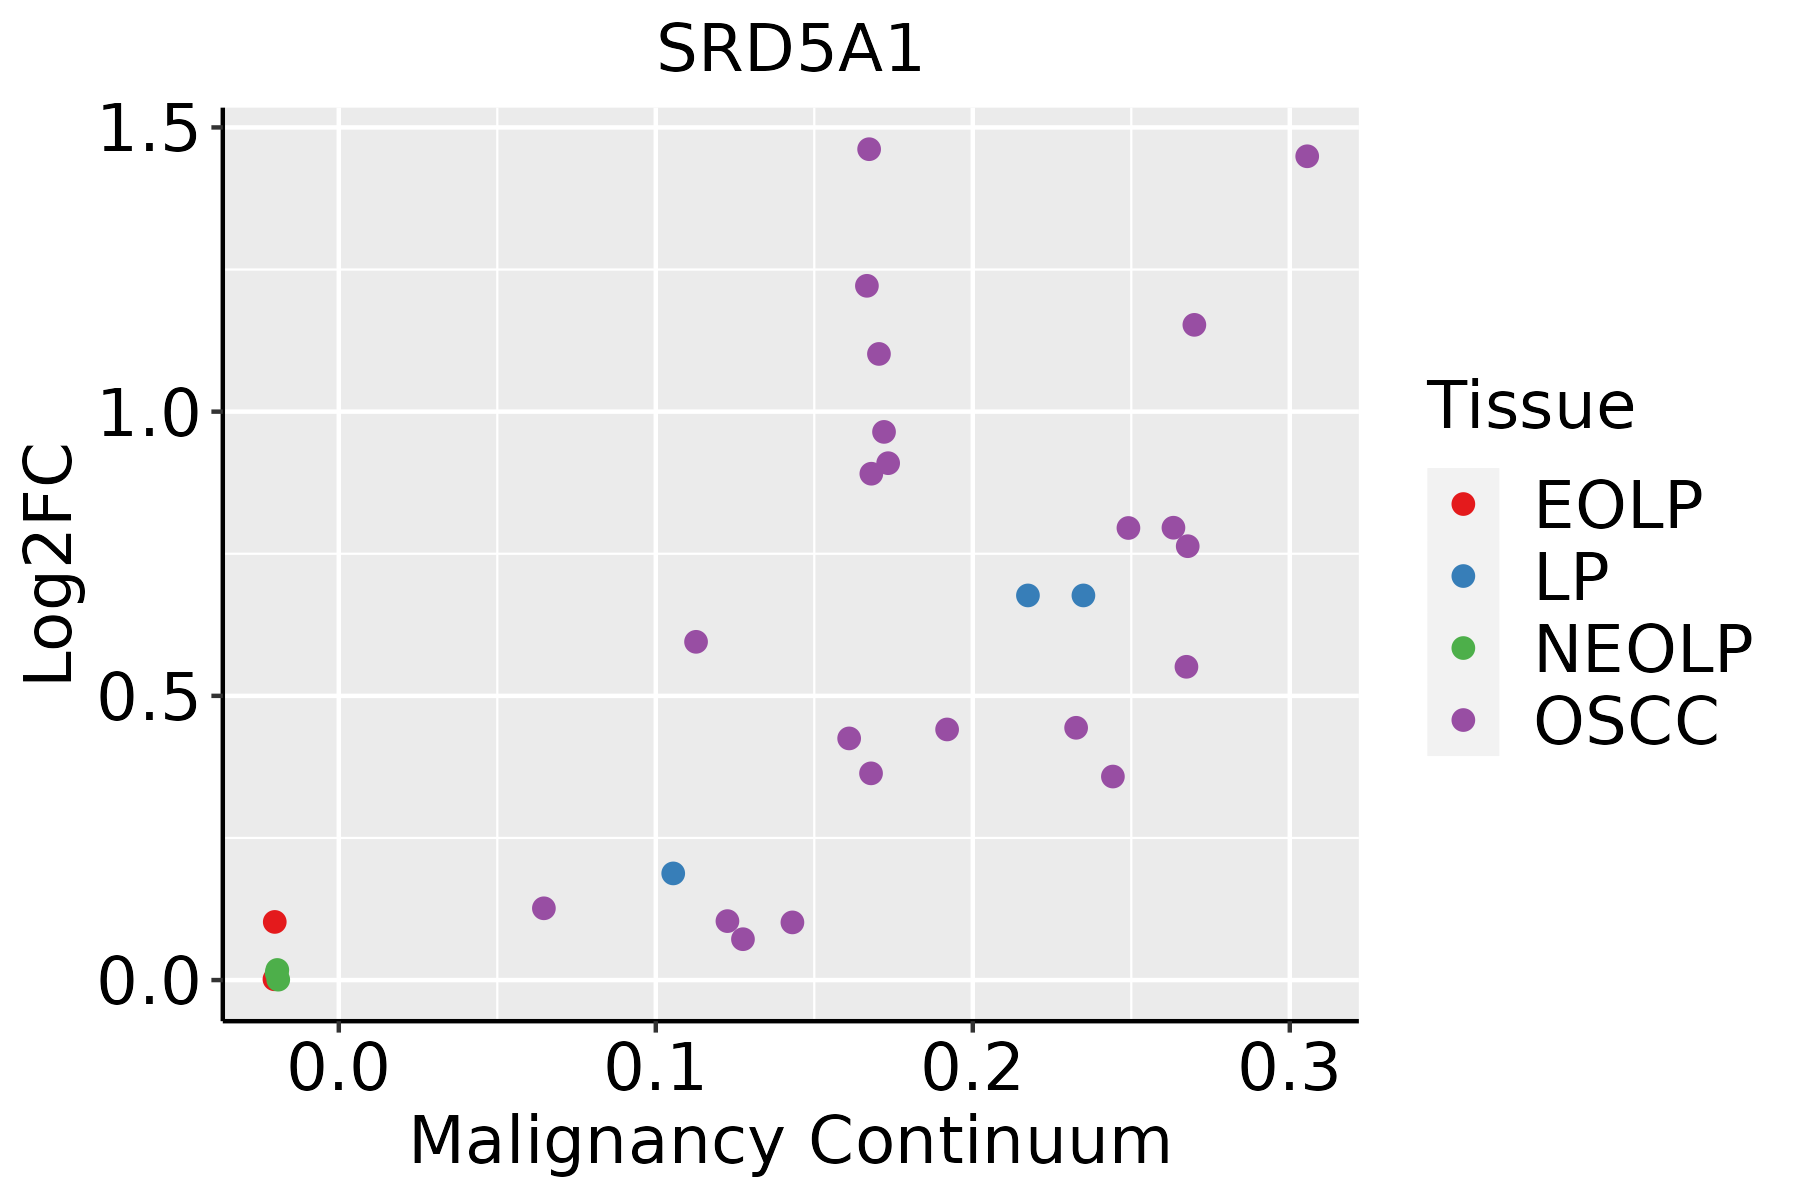 | EOLP: Erosive Oral lichen planus |
| LP: leukoplakia | ||
| NEOLP: Non-erosive oral lichen planus | ||
| OSCC: Oral squamous cell carcinoma | ||
| Skin |  | AK: Actinic keratosis |
| cSCC: Cutaneous squamous cell carcinoma | ||
| SCCIS:squamous cell carcinoma in situ | ||
| Thyroid | 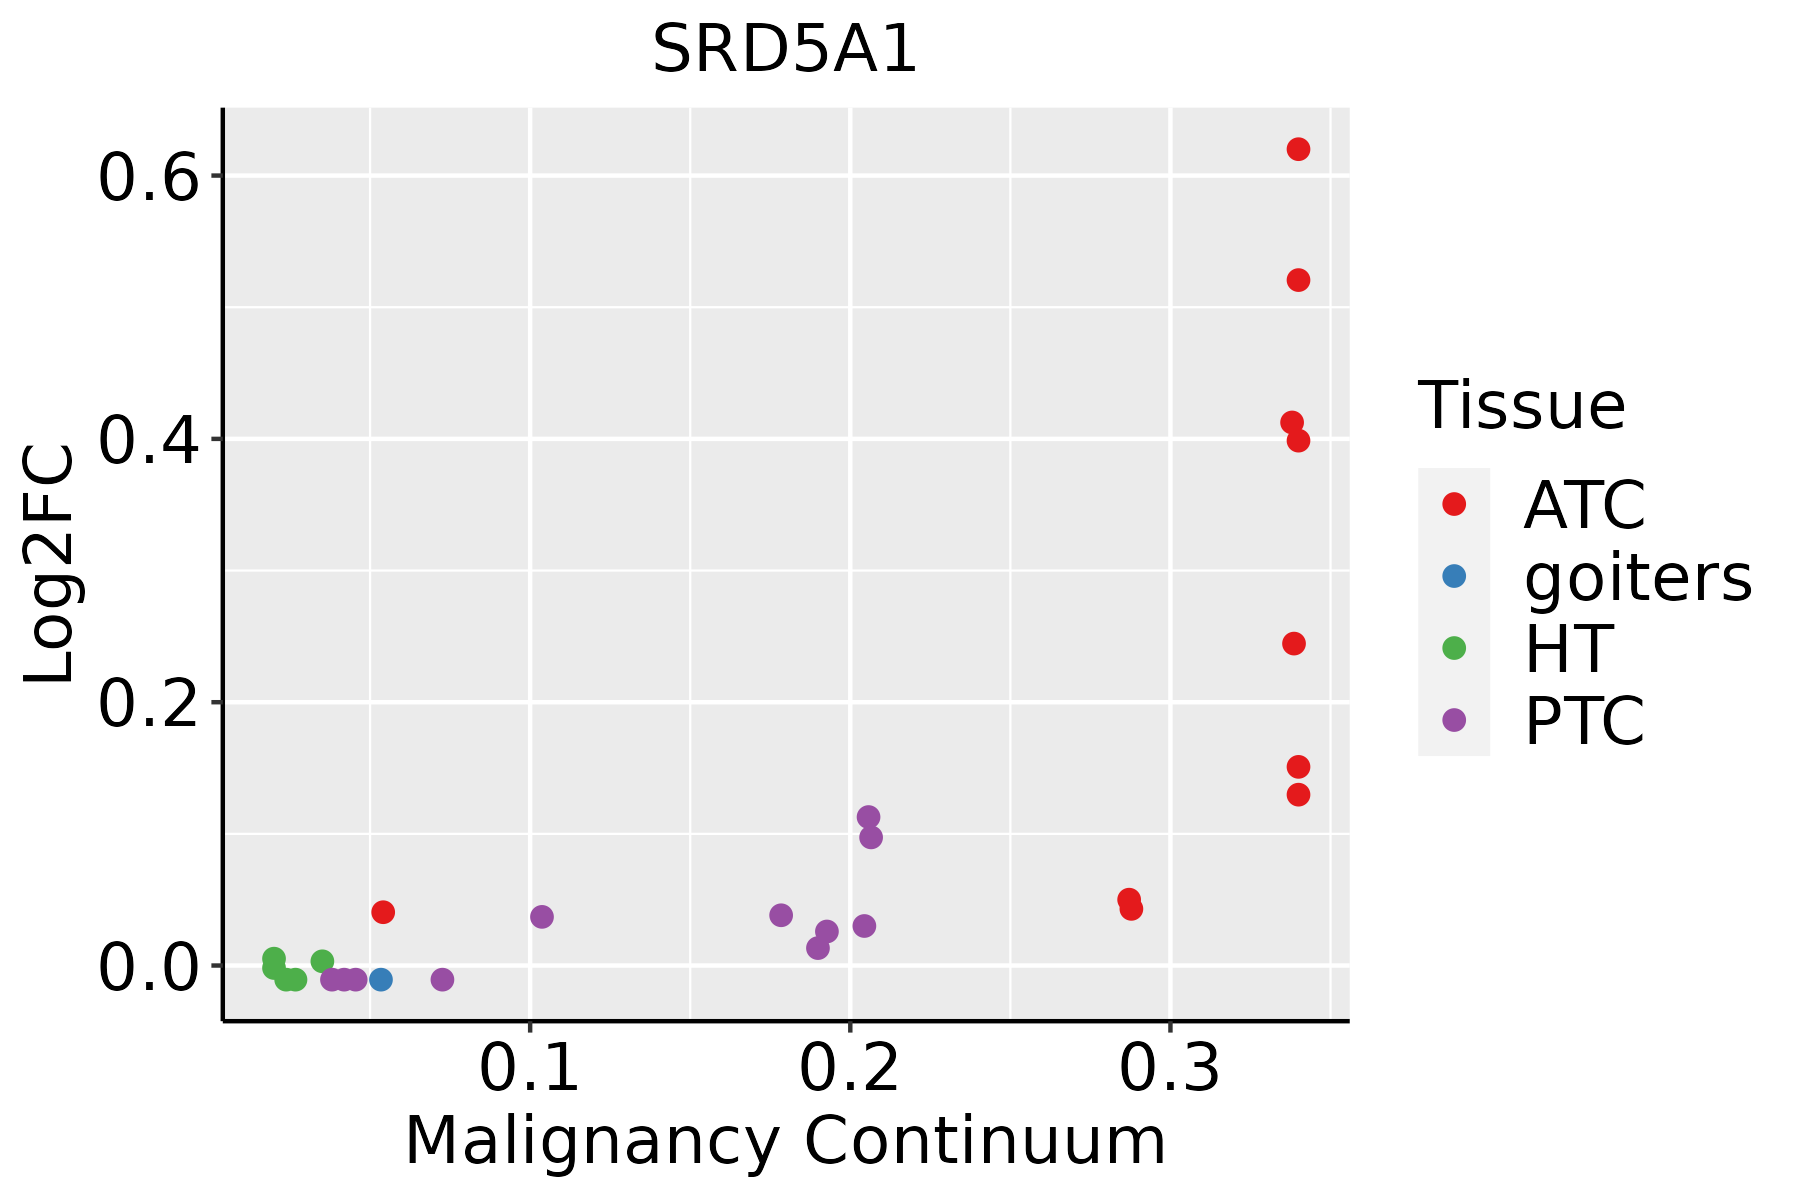 | ATC: Anaplastic thyroid cancer |
| HT: Hashimoto's thyroiditis | ||
| PTC: Papillary thyroid cancer |
| ∗log2FC in expression of this searched gene in stem-like cells from each diseased tissue sample relative to stem-like cells in normal samples in each tissue plotted against the malignancy continuum. Samples are colored based on if they are from different disease stage. |
Top |
Malignant transformation related pathway analysis |
| Find out the enriched GO biological processes and KEGG pathways involved in transition from healthy to precancer to cancer |
| Tissue | Disease Stage | Enriched GO biological Processes |
| Colorectum | AD |  |
| Colorectum | SER |  |
| Colorectum | MSS |  |
| Colorectum | MSI-H |  |
| Colorectum | FAP |  |
| ∗Top 15 enriched GO BP terms are showed in the bar plot of each disease state in each tissue. Each row represents a significant GO biological process which is colored according to the -log10(p.adjust). |
| Page: 1 2 3 4 5 6 7 8 9 |
| GO ID | Tissue | Disease Stage | Description | Gene Ratio | Bg Ratio | pvalue | p.adjust | Count |
| GO:003286923 | Thyroid | ATC | cellular response to insulin stimulus | 101/6293 | 203/18723 | 1.34e-06 | 1.69e-05 | 101 |
| GO:003235519 | Thyroid | ATC | response to estradiol | 72/6293 | 141/18723 | 1.35e-05 | 1.29e-04 | 72 |
| GO:000762325 | Thyroid | ATC | circadian rhythm | 100/6293 | 210/18723 | 1.67e-05 | 1.54e-04 | 100 |
| GO:004654621 | Thyroid | ATC | development of primary male sexual characteristics | 72/6293 | 142/18723 | 1.85e-05 | 1.69e-04 | 72 |
| GO:190165521 | Thyroid | ATC | cellular response to ketone | 52/6293 | 96/18723 | 2.65e-05 | 2.27e-04 | 52 |
| GO:000858421 | Thyroid | ATC | male gonad development | 71/6293 | 141/18723 | 2.83e-05 | 2.38e-04 | 71 |
| GO:000963634 | Thyroid | ATC | response to toxic substance | 119/6293 | 262/18723 | 4.30e-05 | 3.48e-04 | 119 |
| GO:003090015 | Thyroid | ATC | forebrain development | 164/6293 | 379/18723 | 4.85e-05 | 3.87e-04 | 164 |
| GO:002153712 | Thyroid | ATC | telencephalon development | 113/6293 | 248/18723 | 5.61e-05 | 4.32e-04 | 113 |
| GO:004667714 | Thyroid | ATC | response to antibiotic | 29/6293 | 47/18723 | 7.37e-05 | 5.60e-04 | 29 |
| GO:002154312 | Thyroid | ATC | pallium development | 81/6293 | 169/18723 | 7.67e-05 | 5.80e-04 | 81 |
| GO:004666112 | Thyroid | ATC | male sex differentiation | 77/6293 | 165/18723 | 3.27e-04 | 2.04e-03 | 77 |
| GO:002198722 | Thyroid | ATC | cerebral cortex development | 55/6293 | 114/18723 | 8.32e-04 | 4.57e-03 | 55 |
| GO:000840613 | Thyroid | ATC | gonad development | 96/6293 | 221/18723 | 1.40e-03 | 7.25e-03 | 96 |
| GO:003357417 | Thyroid | ATC | response to testosterone | 24/6293 | 42/18723 | 1.45e-03 | 7.47e-03 | 24 |
| GO:00451374 | Thyroid | ATC | development of primary sexual characteristics | 97/6293 | 227/18723 | 2.47e-03 | 1.14e-02 | 97 |
| GO:000941027 | Thyroid | ATC | response to xenobiotic stimulus | 184/6293 | 462/18723 | 2.70e-03 | 1.23e-02 | 184 |
| GO:001482313 | Thyroid | ATC | response to activity | 37/6293 | 76/18723 | 4.57e-03 | 1.89e-02 | 37 |
| GO:005138427 | Thyroid | ATC | response to glucocorticoid | 65/6293 | 148/18723 | 5.62e-03 | 2.28e-02 | 65 |
| GO:003196027 | Thyroid | ATC | response to corticosteroid | 72/6293 | 167/18723 | 6.39e-03 | 2.55e-02 | 72 |
| Page: 1 2 3 4 5 6 7 8 9 10 11 12 13 14 15 16 17 18 19 20 |
| Pathway ID | Tissue | Disease Stage | Description | Gene Ratio | Bg Ratio | pvalue | p.adjust | qvalue | Count |
| Page: 1 |
Top |
Cell-cell communication analysis |
| Identification of potential cell-cell interactions between two cell types and their ligand-receptor pairs for different disease states |
| Ligand | Receptor | LRpair | Pathway | Tissue | Disease Stage |
| Page: 1 |
Top |
Single-cell gene regulatory network inference analysis |
| Find out the significant the regulons (TFs) and the target genes of each regulon across cell types for different disease states |
| TF | Cell Type | Tissue | Disease Stage | Target Gene | RSS | Regulon Activity |
| ∗The dot plots of a searched regulon are shown for all cell subpopulations in each disease state of each tissue based on the regulon specific score inferred using pySCENIC and by calculating the average expression. |
| Page: 1 |
Top |
Somatic mutation of malignant transformation related genes |
| Annotation of somatic variants for genes involved in malignant transformation |
| Hugo Symbol | Variant Class | Variant Classification | dbSNP RS | HGVSc | HGVSp | HGVSp Short | SWISSPROT | BIOTYPE | SIFT | PolyPhen | Tumor Sample Barcode | Tissue | Histology | Sex | Age | Stage | Therapy Types | Drugs | Outcome |
| SRD5A1 | SNV | Missense_Mutation | c.460N>C | p.Gly154Arg | p.G154R | P18405 | protein_coding | deleterious(0) | probably_damaging(1) | TCGA-AC-A23H-01 | Breast | breast invasive carcinoma | Female | >=65 | I/II | Unknown | Unknown | PD | |
| SRD5A1 | SNV | Missense_Mutation | c.688N>C | p.Ser230Pro | p.S230P | P18405 | protein_coding | tolerated(0.2) | benign(0.145) | TCGA-BH-A0DG-01 | Breast | breast invasive carcinoma | Female | <65 | I/II | Chemotherapy | taxotere | CR | |
| SRD5A1 | SNV | Missense_Mutation | novel | c.408N>A | p.Ser136Arg | p.S136R | P18405 | protein_coding | deleterious(0.01) | possibly_damaging(0.463) | TCGA-AA-3869-01 | Colorectum | colon adenocarcinoma | Male | >=65 | III/IV | Chemotherapy | capecitabine | PD |
| SRD5A1 | SNV | Missense_Mutation | c.353C>T | p.Thr118Ile | p.T118I | P18405 | protein_coding | tolerated(0.29) | benign(0) | TCGA-AD-6889-01 | Colorectum | colon adenocarcinoma | Male | >=65 | I/II | Chemotherapy | xeloda | PD | |
| SRD5A1 | SNV | Missense_Mutation | c.613N>A | p.Glu205Lys | p.E205K | P18405 | protein_coding | deleterious(0.02) | possibly_damaging(0.856) | TCGA-AP-A051-01 | Endometrium | uterine corpus endometrioid carcinoma | Female | >=65 | I/II | Unknown | Unknown | SD | |
| SRD5A1 | SNV | Missense_Mutation | novel | c.721N>T | p.Leu241Phe | p.L241F | P18405 | protein_coding | deleterious(0.02) | probably_damaging(0.917) | TCGA-AP-A1DK-01 | Endometrium | uterine corpus endometrioid carcinoma | Female | <65 | I/II | Unknown | Unknown | SD |
| SRD5A1 | SNV | Missense_Mutation | c.758N>G | p.Ile253Ser | p.I253S | P18405 | protein_coding | tolerated(0.22) | benign(0.065) | TCGA-AX-A0J0-01 | Endometrium | uterine corpus endometrioid carcinoma | Female | <65 | I/II | Unknown | Unknown | SD | |
| SRD5A1 | SNV | Missense_Mutation | rs374499334 | c.674N>T | p.Thr225Met | p.T225M | P18405 | protein_coding | deleterious(0) | possibly_damaging(0.883) | TCGA-BS-A0UV-01 | Endometrium | uterine corpus endometrioid carcinoma | Female | <65 | III/IV | Unknown | Unknown | SD |
| SRD5A1 | SNV | Missense_Mutation | novel | c.759N>G | p.Ile253Met | p.I253M | P18405 | protein_coding | tolerated(0.06) | benign(0.222) | TCGA-D1-A16X-01 | Endometrium | uterine corpus endometrioid carcinoma | Female | <65 | I/II | Unknown | Unknown | SD |
| SRD5A1 | SNV | Missense_Mutation | novel | c.286G>T | p.Gly96Trp | p.G96W | P18405 | protein_coding | deleterious(0.03) | benign(0.014) | TCGA-05-4396-01 | Lung | lung adenocarcinoma | Male | >=65 | III/IV | Unknown | Unknown | SD |
| Page: 1 2 |
Top |
Related drugs of malignant transformation related genes |
| Identification of chemicals and drugs interact with genes involved in malignant transfromation |
| (DGIdb 4.0) |
| Entrez ID | Symbol | Category | Interaction Types | Drug Claim Name | Drug Name | PMIDs |
| 6715 | SRD5A1 | DRUGGABLE GENOME | LEVONORGESTREL | LEVONORGESTREL | ||
| 6715 | SRD5A1 | DRUGGABLE GENOME | DUTASTERIDE | DUTASTERIDE | ||
| 6715 | SRD5A1 | DRUGGABLE GENOME | BEXLOSTERIDE | BEXLOSTERIDE | ||
| 6715 | SRD5A1 | DRUGGABLE GENOME | FR-146687 | |||
| 6715 | SRD5A1 | DRUGGABLE GENOME | FINASTERIDE | FINASTERIDE | ||
| 6715 | SRD5A1 | DRUGGABLE GENOME | LY-266111 | CHEMBL29166 | ||
| 6715 | SRD5A1 | DRUGGABLE GENOME | FINASTERIDE | FINASTERIDE | ||
| 6715 | SRD5A1 | DRUGGABLE GENOME | DUTASTERIDE | DUTASTERIDE | ||
| 6715 | SRD5A1 | DRUGGABLE GENOME | inhibitor | CHEMBL1200969 | DUTASTERIDE |
| Page: 1 |

Copyright 2023-Present -The University of Texas Health Science Center at Houston |