
|
|||||
|
 | |
| |
| |
| |
| |
| |
|
Gene: SMAD3 |
Gene summary for SMAD3 |
| Gene information | Species | Human | Gene symbol | SMAD3 | Gene ID | 4088 |
| Gene name | SMAD family member 3 | |
| Gene Alias | HSPC193 | |
| Cytomap | 15q22.33 | |
| Gene Type | protein-coding | GO ID | GO:0000122 | UniProtAcc | P84022 |
Top |
Malignant transformation analysis |
| Identification of the aberrant gene expression in precancerous and cancerous lesions by comparing the gene expression of stem-like cells in diseased tissues with normal stem cells |
| Entrez ID | Symbol | Replicates | Species | Organ | Tissue | Adj P-value | Log2FC | Malignancy |
| 4088 | SMAD3 | CCI_1 | Human | Cervix | CC | 2.90e-17 | 1.82e+00 | 0.528 |
| 4088 | SMAD3 | CCI_2 | Human | Cervix | CC | 1.28e-19 | 1.89e+00 | 0.5249 |
| 4088 | SMAD3 | CCI_3 | Human | Cervix | CC | 4.06e-27 | 1.85e+00 | 0.516 |
| 4088 | SMAD3 | Tumor | Human | Cervix | CC | 1.06e-12 | 3.99e-01 | 0.1241 |
| 4088 | SMAD3 | sample3 | Human | Cervix | CC | 1.83e-22 | 5.39e-01 | 0.1387 |
| 4088 | SMAD3 | T3 | Human | Cervix | CC | 5.09e-25 | 5.80e-01 | 0.1389 |
| 4088 | SMAD3 | HTA11_347_2000001011 | Human | Colorectum | AD | 3.53e-06 | 3.99e-01 | -0.1954 |
| 4088 | SMAD3 | HTA11_411_2000001011 | Human | Colorectum | SER | 3.23e-02 | 1.04e+00 | -0.2602 |
| 4088 | SMAD3 | HTA11_1391_2000001011 | Human | Colorectum | AD | 2.06e-02 | 5.25e-01 | -0.059 |
| 4088 | SMAD3 | A015-C-203 | Human | Colorectum | FAP | 5.24e-15 | -1.60e-01 | -0.1294 |
| 4088 | SMAD3 | A002-C-201 | Human | Colorectum | FAP | 4.13e-04 | -1.05e-01 | 0.0324 |
| 4088 | SMAD3 | A001-C-108 | Human | Colorectum | FAP | 6.05e-09 | -1.35e-01 | -0.0272 |
| 4088 | SMAD3 | A002-C-205 | Human | Colorectum | FAP | 4.11e-09 | -1.17e-01 | -0.1236 |
| 4088 | SMAD3 | A015-C-006 | Human | Colorectum | FAP | 5.40e-06 | -2.48e-01 | -0.0994 |
| 4088 | SMAD3 | A015-C-106 | Human | Colorectum | FAP | 5.40e-08 | -1.36e-01 | -0.0511 |
| 4088 | SMAD3 | A002-C-114 | Human | Colorectum | FAP | 3.14e-06 | -1.79e-01 | -0.1561 |
| 4088 | SMAD3 | A015-C-104 | Human | Colorectum | FAP | 9.75e-17 | -2.49e-01 | -0.1899 |
| 4088 | SMAD3 | A001-C-014 | Human | Colorectum | FAP | 2.24e-05 | -9.96e-02 | 0.0135 |
| 4088 | SMAD3 | A002-C-016 | Human | Colorectum | FAP | 4.45e-09 | -1.52e-01 | 0.0521 |
| 4088 | SMAD3 | A015-C-002 | Human | Colorectum | FAP | 8.60e-04 | -9.05e-02 | -0.0763 |
| Page: 1 2 3 4 5 6 7 8 9 |
| Tissue | Expression Dynamics | Abbreviation |
| Cervix | 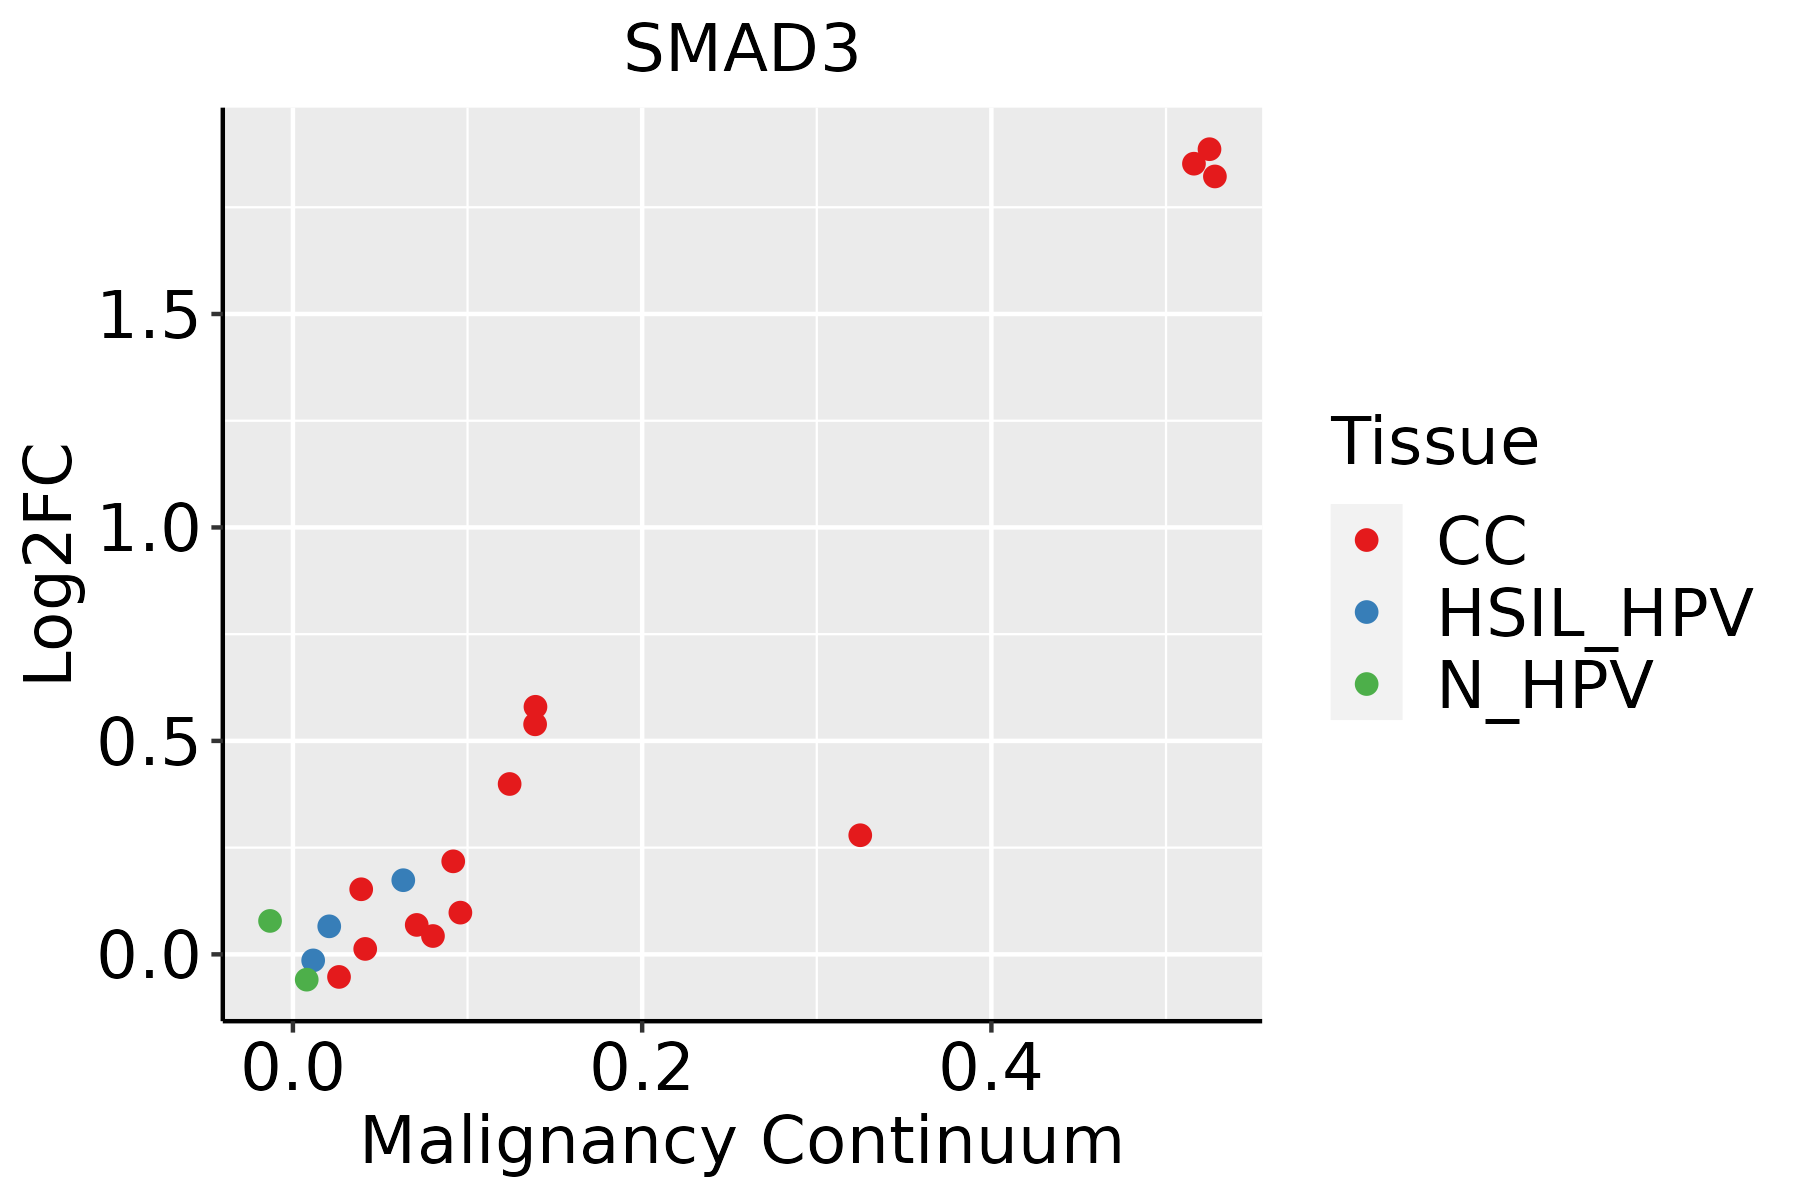 | CC: Cervix cancer |
| HSIL_HPV: HPV-infected high-grade squamous intraepithelial lesions | ||
| N_HPV: HPV-infected normal cervix | ||
| Colorectum (GSE201348) | 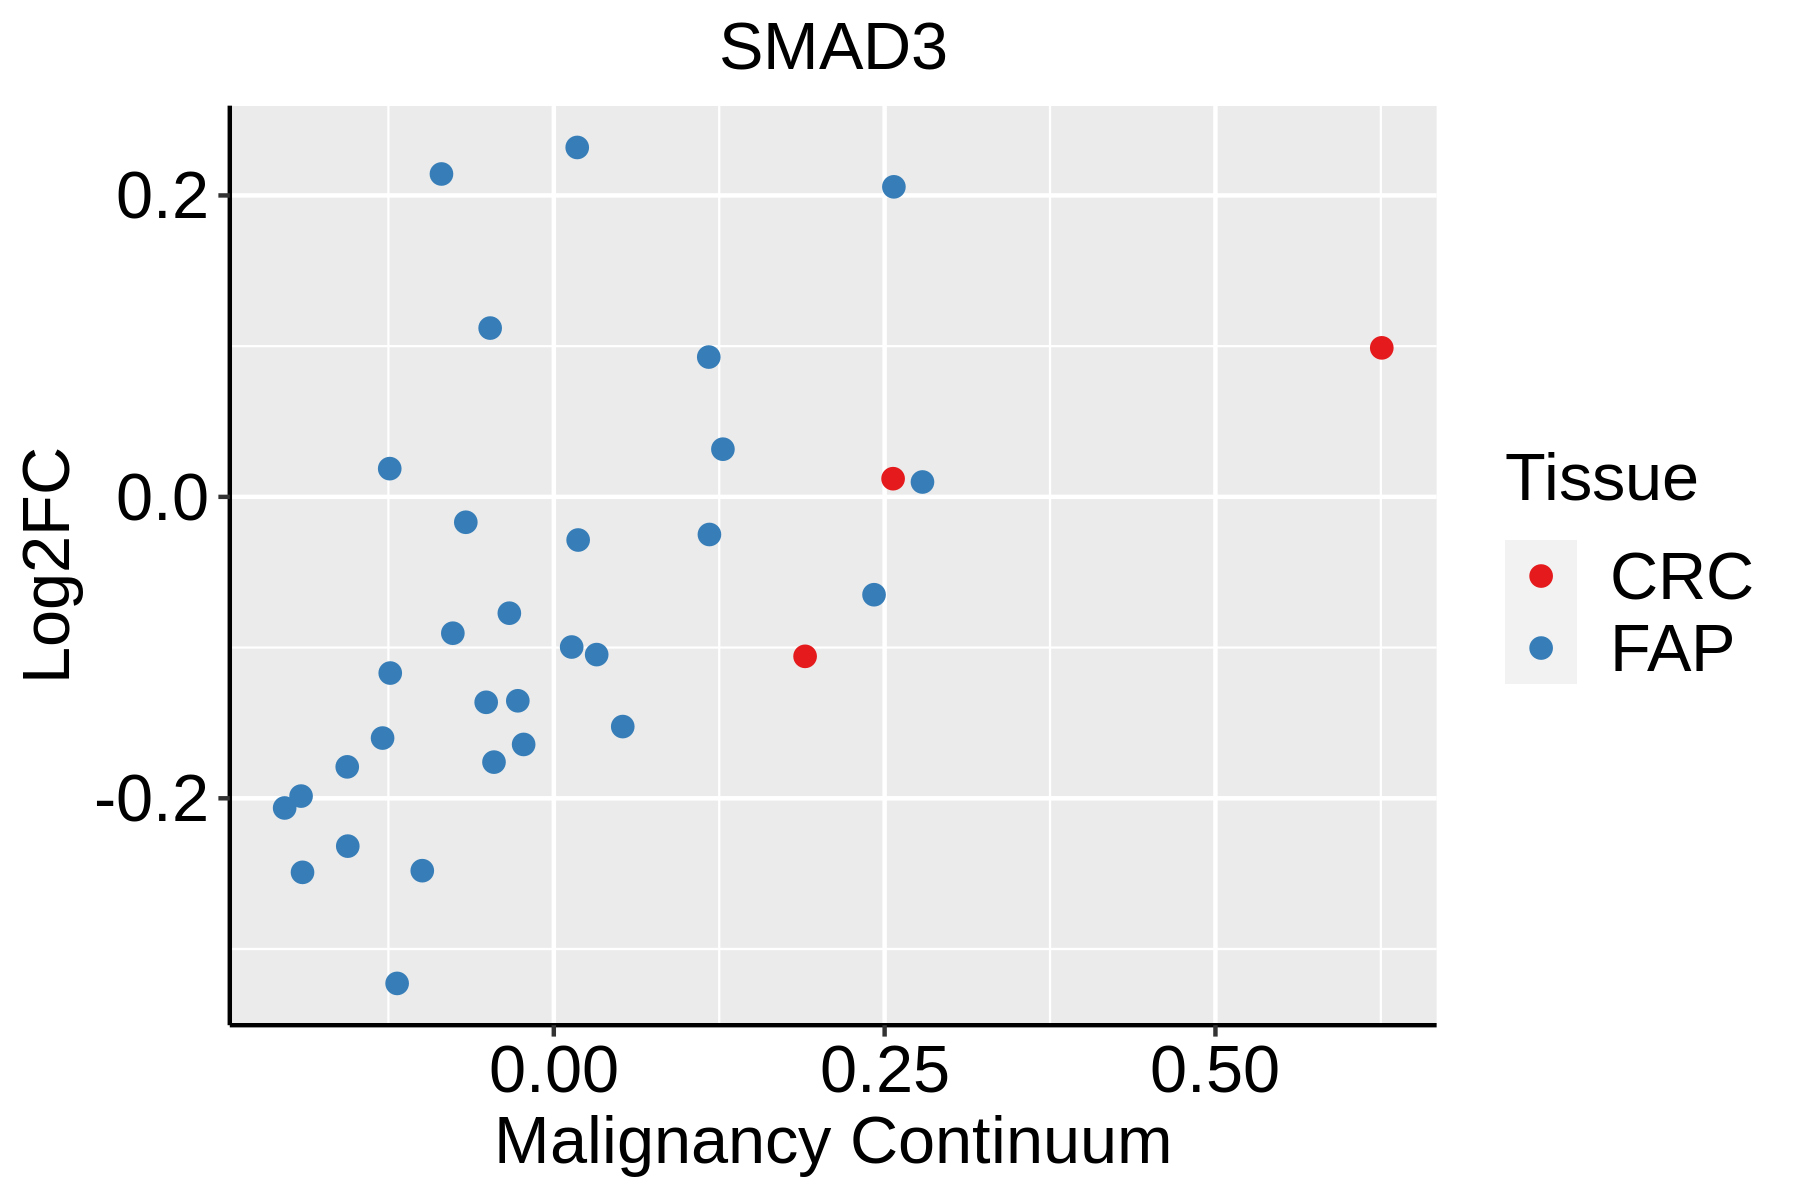 | FAP: Familial adenomatous polyposis |
| CRC: Colorectal cancer | ||
| Colorectum (HTA11) |  | AD: Adenomas |
| SER: Sessile serrated lesions | ||
| MSI-H: Microsatellite-high colorectal cancer | ||
| MSS: Microsatellite stable colorectal cancer | ||
| Esophagus | 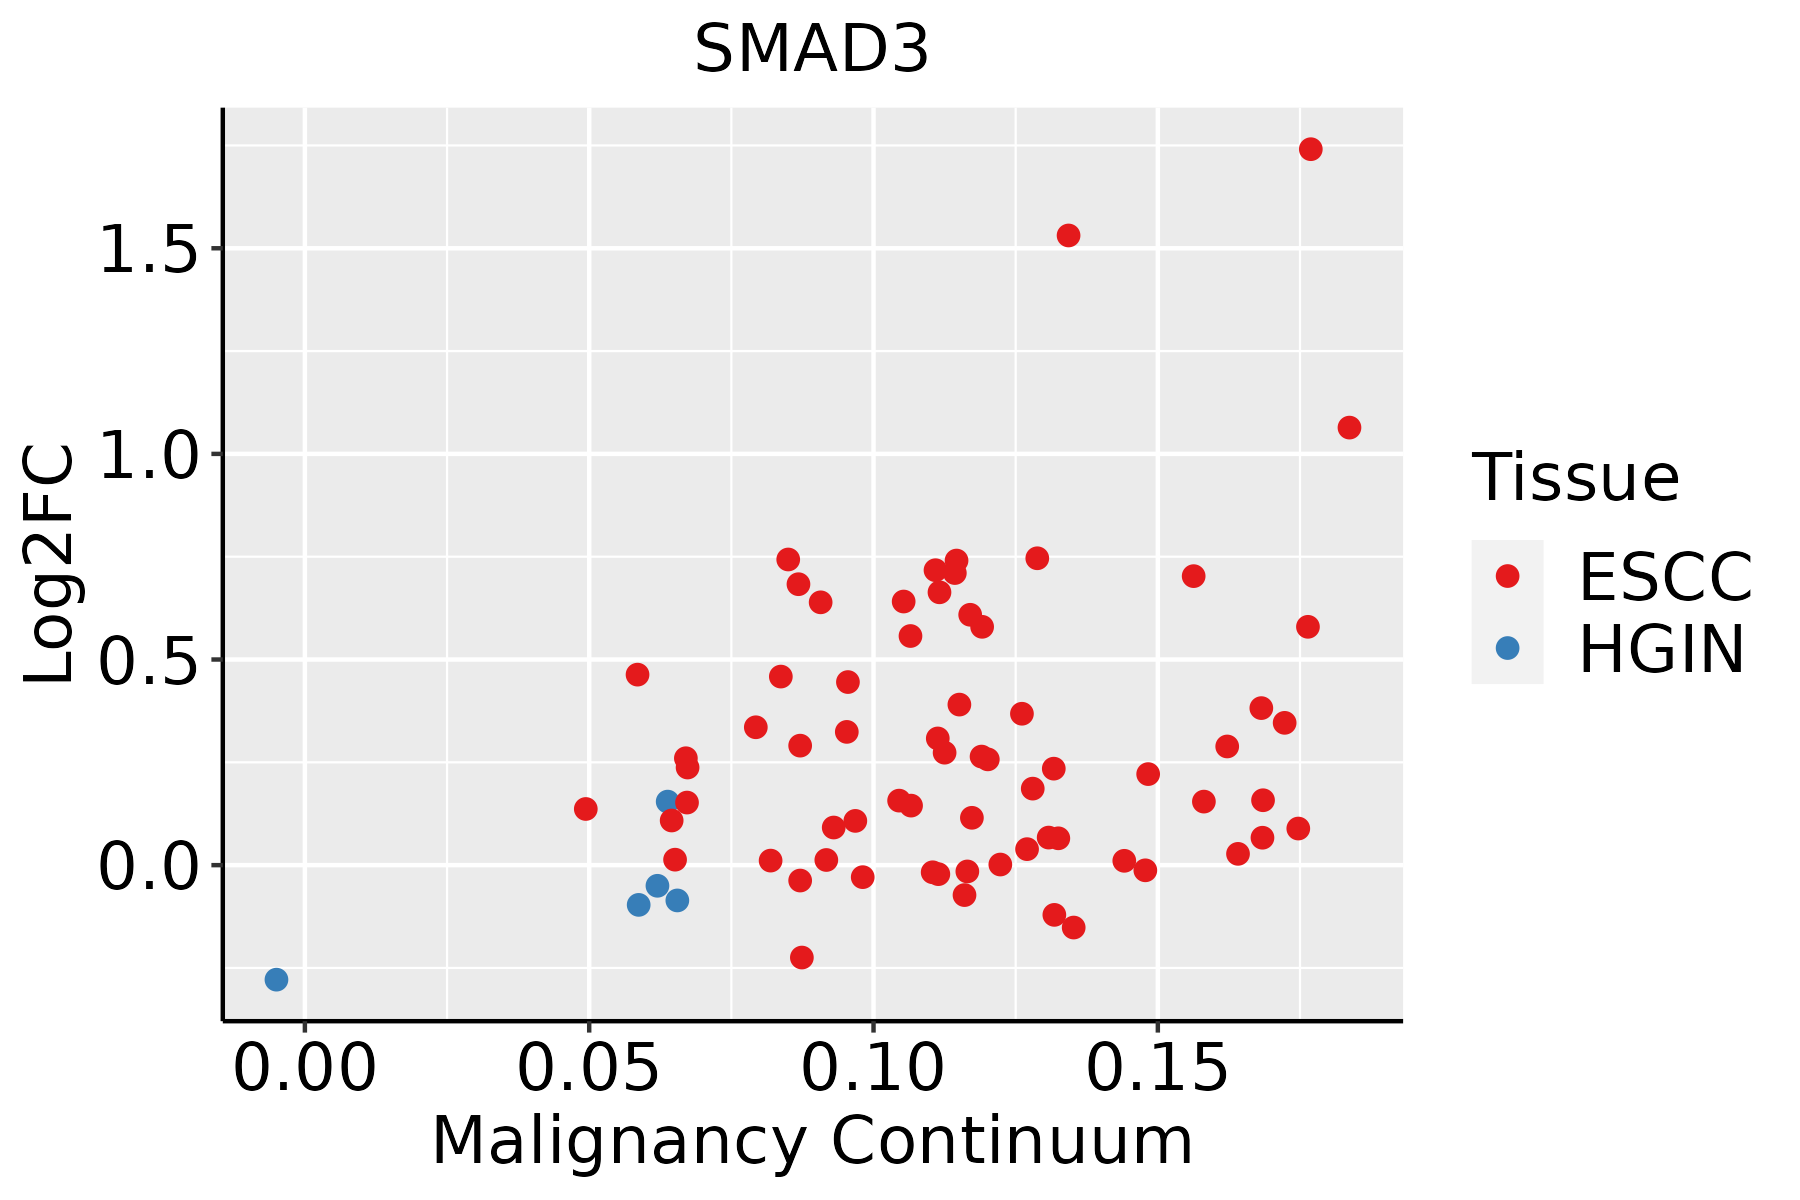 | ESCC: Esophageal squamous cell carcinoma |
| HGIN: High-grade intraepithelial neoplasias | ||
| LGIN: Low-grade intraepithelial neoplasias | ||
| GC |  | CAG: Chronic atrophic gastritis |
| CAG with IM: Chronic atrophic gastritis with intestinal metaplasia | ||
| CSG: Chronic superficial gastritis | ||
| GC: Gastric cancer | ||
| SIM: Severe intestinal metaplasia | ||
| WIM: Wild intestinal metaplasia | ||
| Liver | 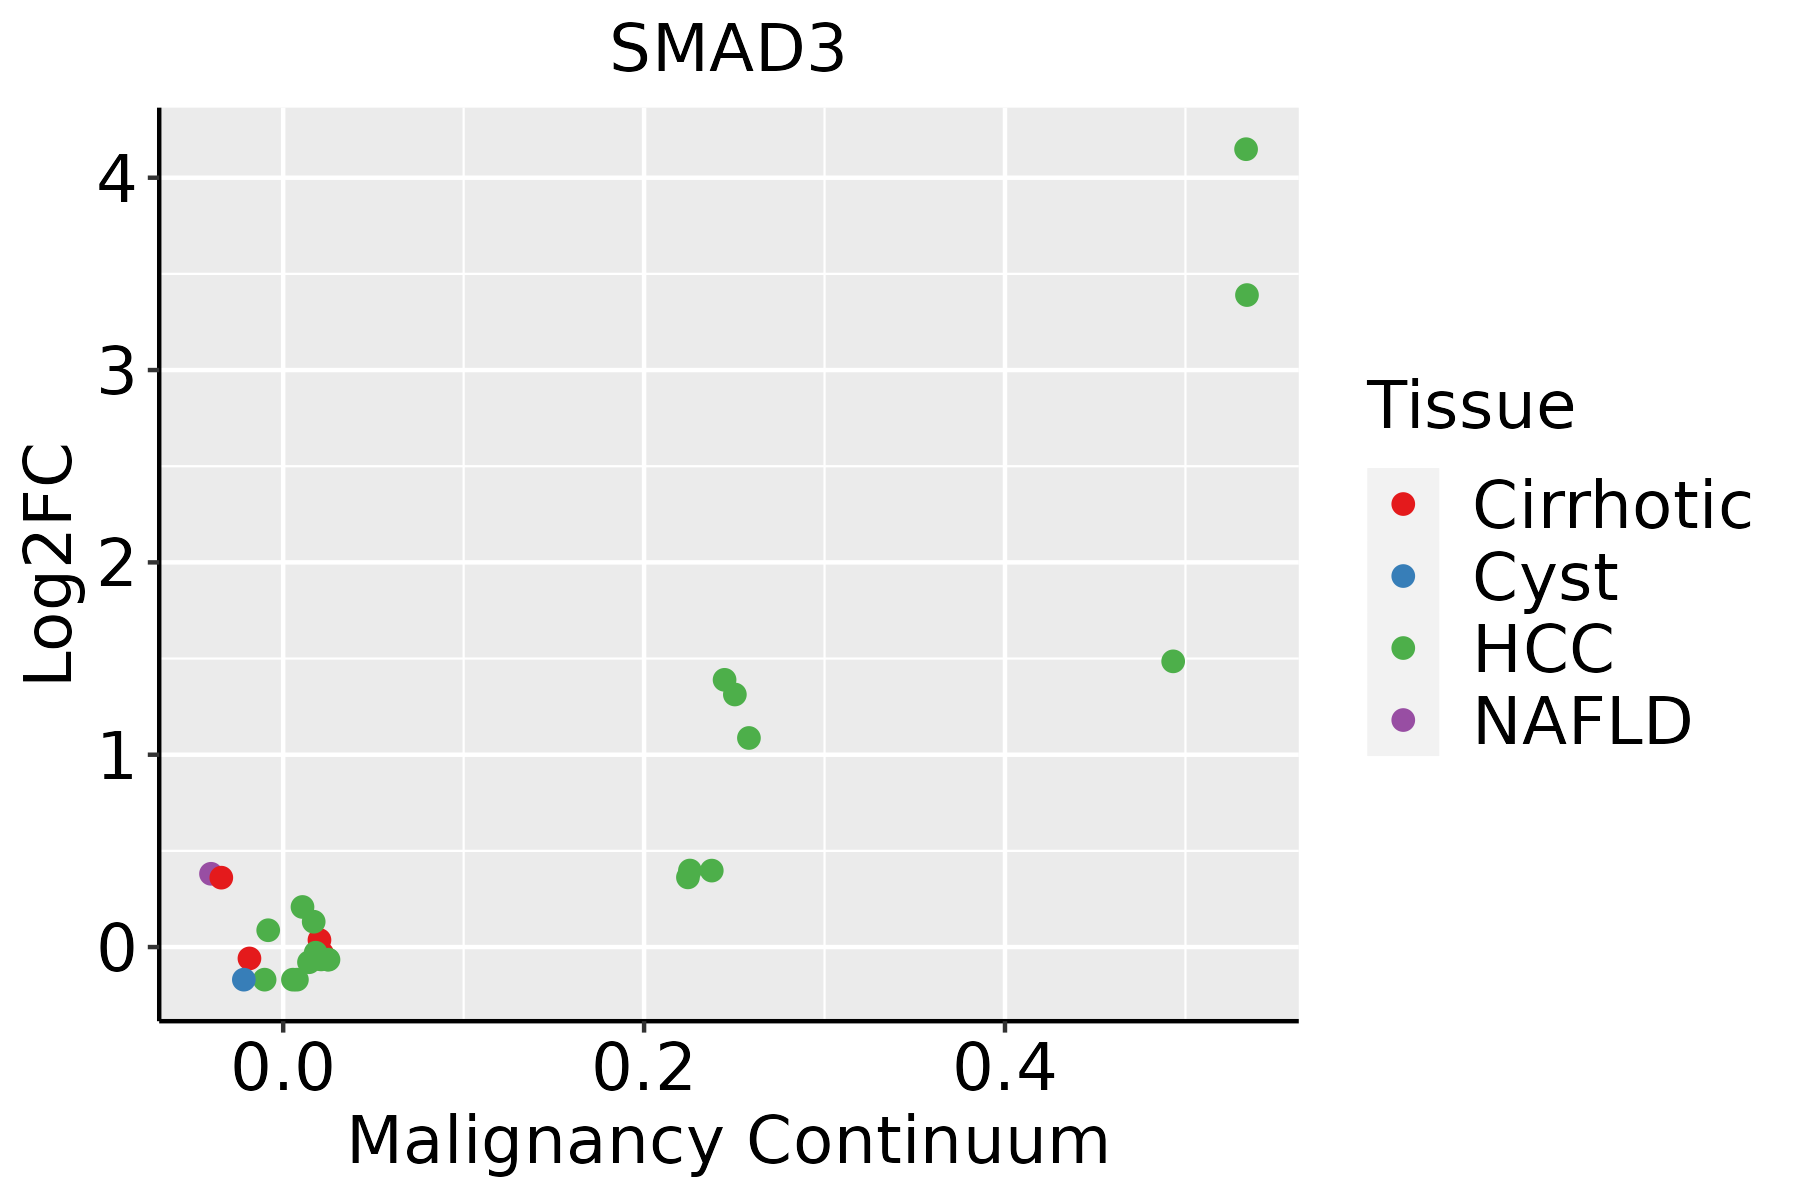 | HCC: Hepatocellular carcinoma |
| NAFLD: Non-alcoholic fatty liver disease | ||
| Oral Cavity | 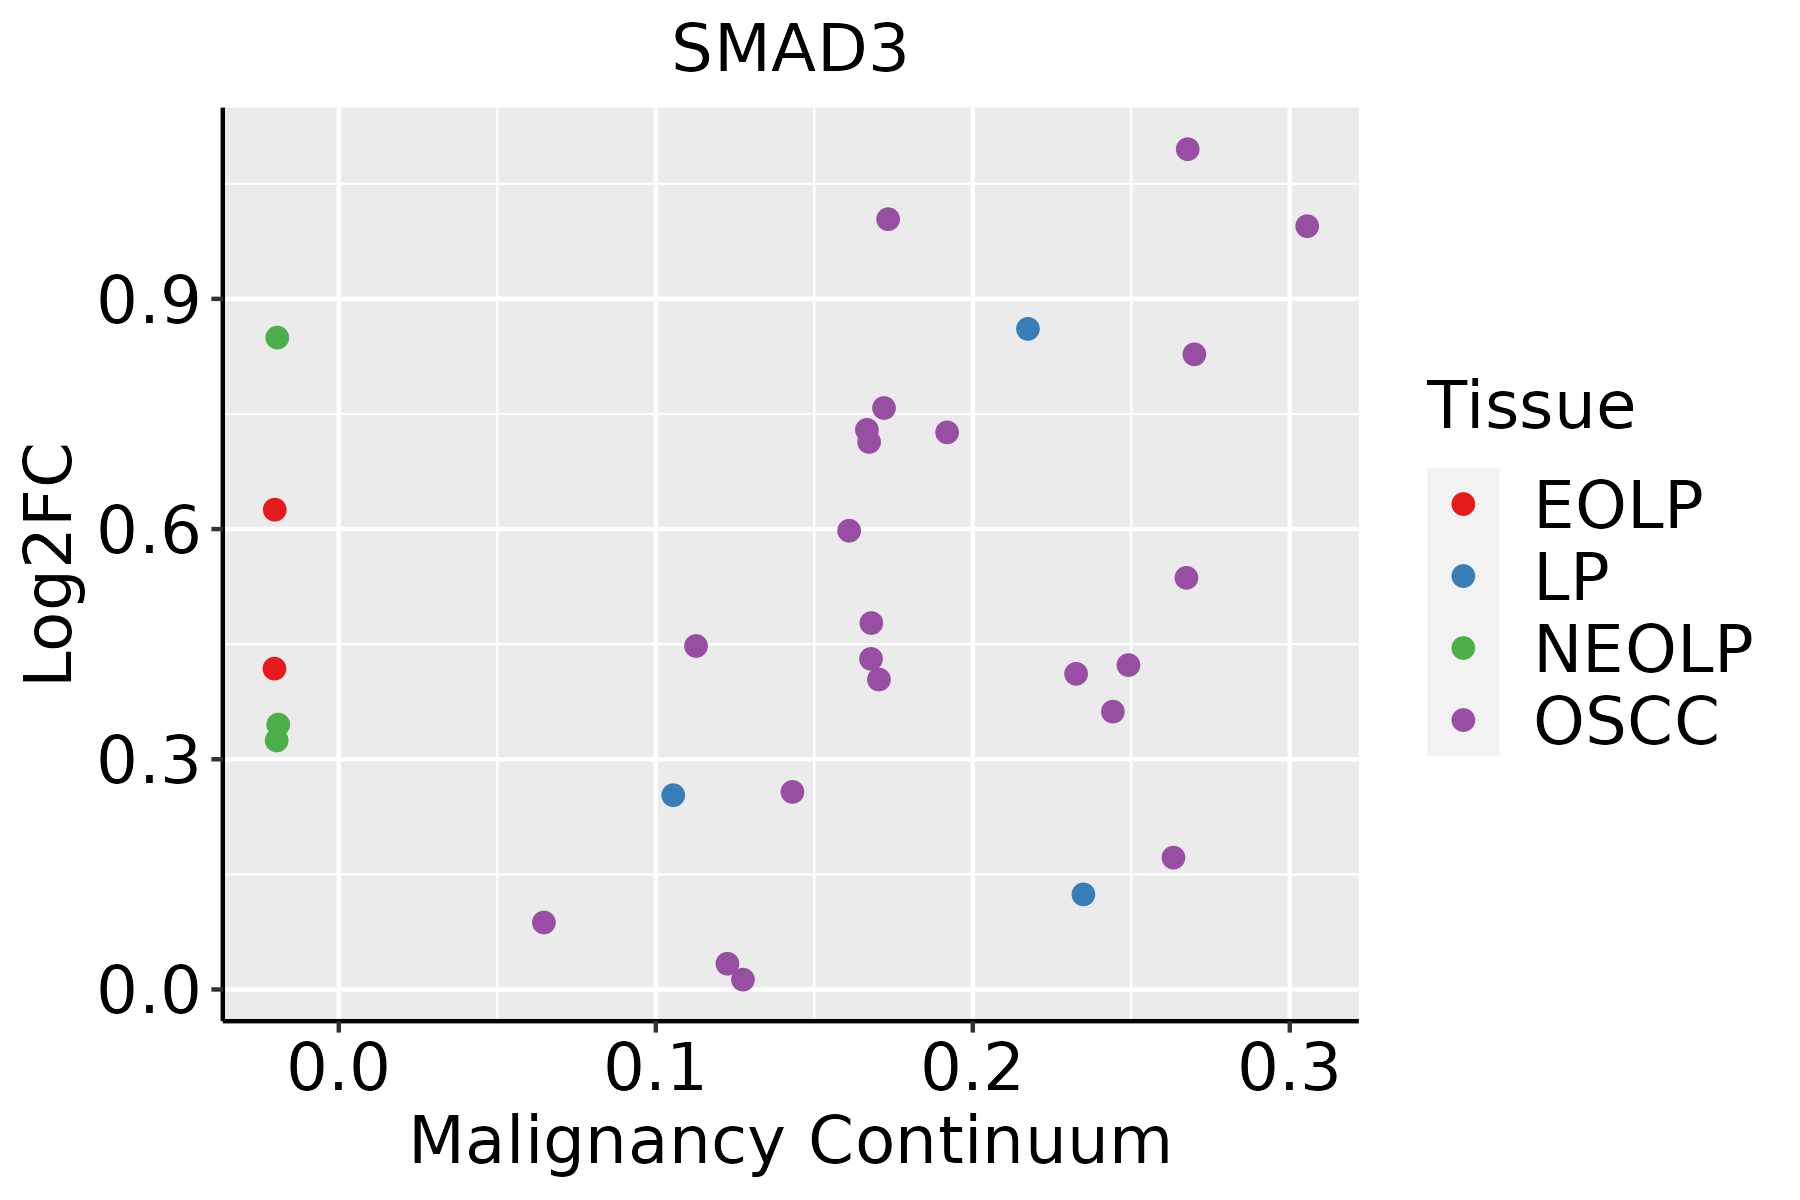 | EOLP: Erosive Oral lichen planus |
| LP: leukoplakia | ||
| NEOLP: Non-erosive oral lichen planus | ||
| OSCC: Oral squamous cell carcinoma | ||
| Prostate | 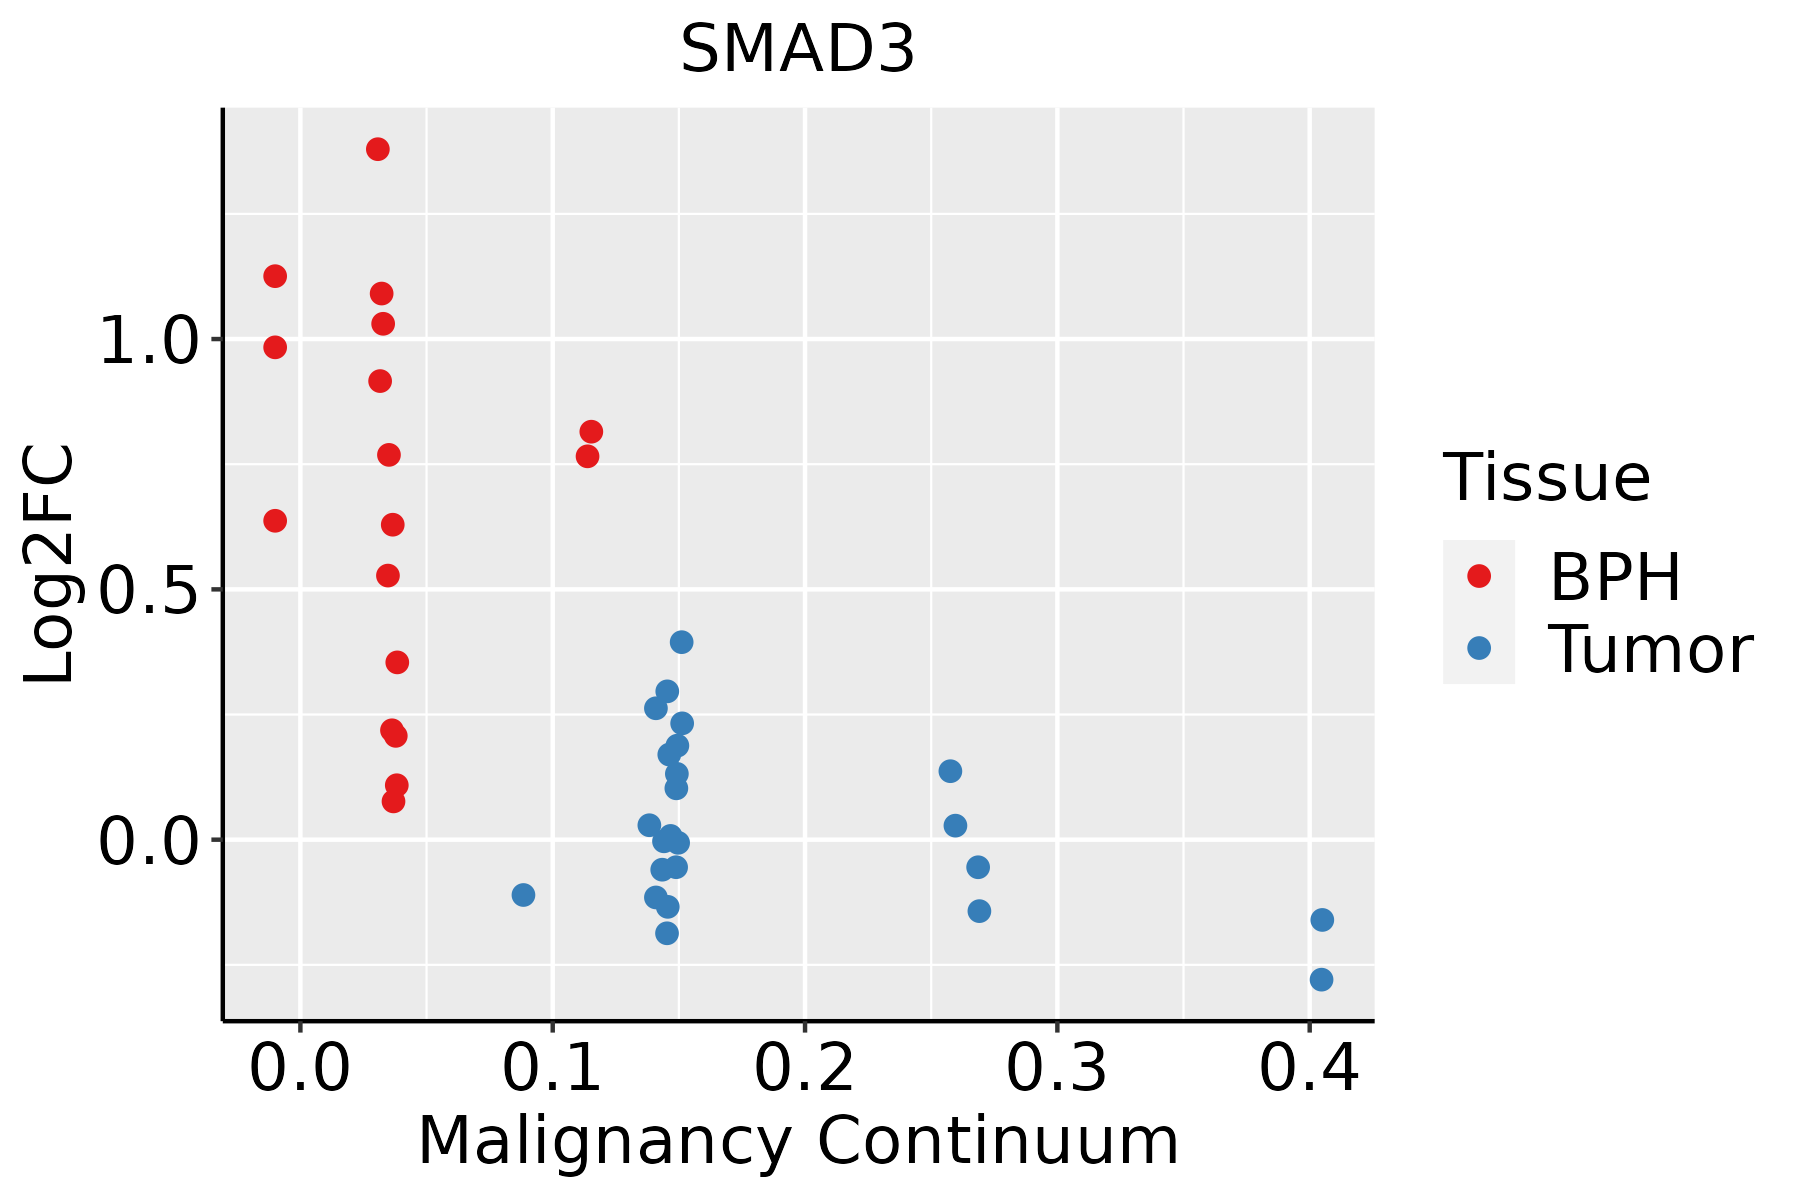 | BPH: Benign Prostatic Hyperplasia |
| Thyroid | 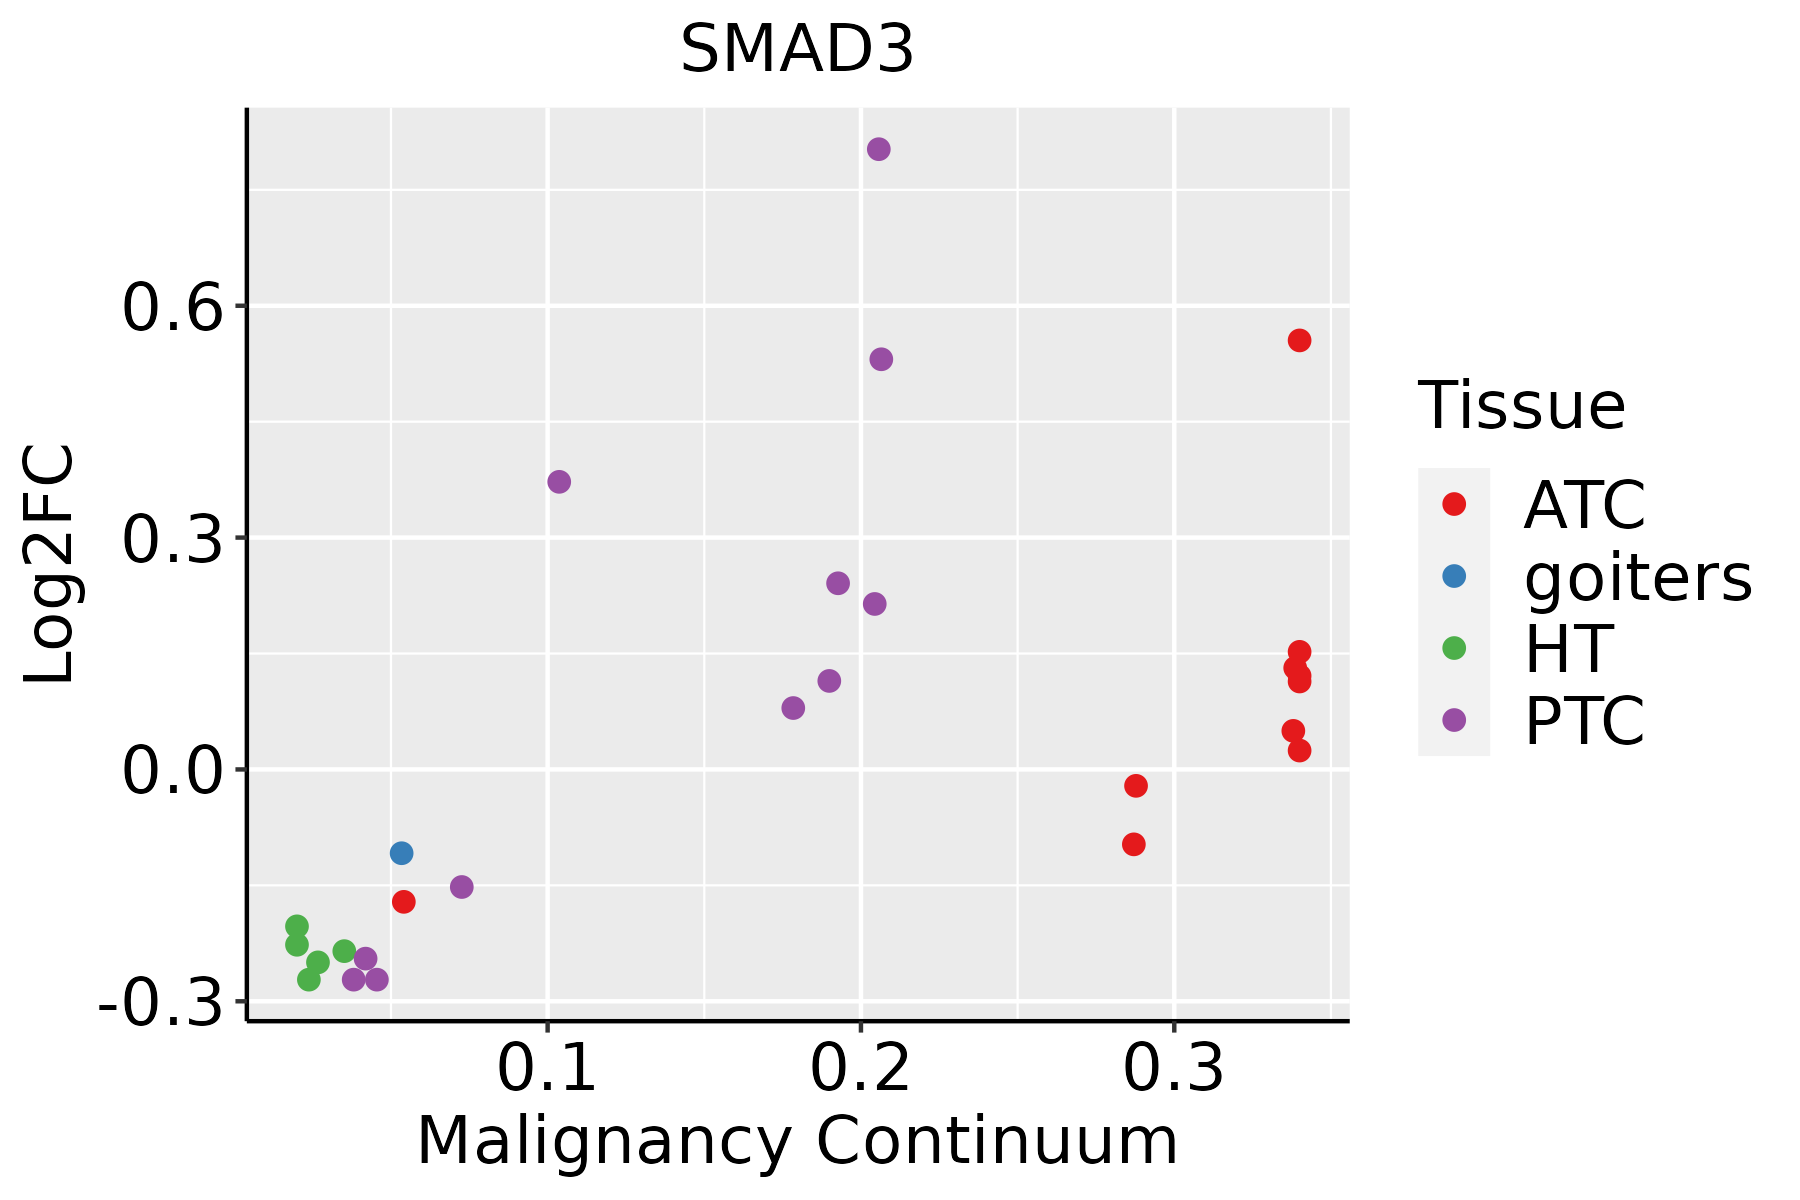 | ATC: Anaplastic thyroid cancer |
| HT: Hashimoto's thyroiditis | ||
| PTC: Papillary thyroid cancer |
| ∗log2FC in expression of this searched gene in stem-like cells from each diseased tissue sample relative to stem-like cells in normal samples in each tissue plotted against the malignancy continuum. Samples are colored based on if they are from different disease stage. |
Top |
Malignant transformation related pathway analysis |
| Find out the enriched GO biological processes and KEGG pathways involved in transition from healthy to precancer to cancer |
| Tissue | Disease Stage | Enriched GO biological Processes |
| Colorectum | AD |  |
| Colorectum | SER |  |
| Colorectum | MSS |  |
| Colorectum | MSI-H |  |
| Colorectum | FAP |  |
| ∗Top 15 enriched GO BP terms are showed in the bar plot of each disease state in each tissue. Each row represents a significant GO biological process which is colored according to the -log10(p.adjust). |
| Page: 1 2 3 4 5 6 7 8 9 |
| GO ID | Tissue | Disease Stage | Description | Gene Ratio | Bg Ratio | pvalue | p.adjust | Count |
| GO:01501161 | Colorectum | SER | regulation of cell-substrate junction organization | 22/2897 | 71/18723 | 7.64e-04 | 9.79e-03 | 22 |
| GO:00423071 | Colorectum | SER | positive regulation of protein import into nucleus | 15/2897 | 41/18723 | 7.73e-04 | 9.84e-03 | 15 |
| GO:19044071 | Colorectum | SER | positive regulation of nitric oxide metabolic process | 15/2897 | 41/18723 | 7.73e-04 | 9.84e-03 | 15 |
| GO:00322311 | Colorectum | SER | regulation of actin filament bundle assembly | 29/2897 | 105/18723 | 1.01e-03 | 1.20e-02 | 29 |
| GO:00362931 | Colorectum | SER | response to decreased oxygen levels | 71/2897 | 322/18723 | 1.04e-03 | 1.22e-02 | 71 |
| GO:00160491 | Colorectum | SER | cell growth | 100/2897 | 482/18723 | 1.07e-03 | 1.24e-02 | 100 |
| GO:00616141 | Colorectum | SER | pri-miRNA transcription by RNA polymerase II | 18/2897 | 55/18723 | 1.11e-03 | 1.28e-02 | 18 |
| GO:00170381 | Colorectum | SER | protein import | 49/2897 | 206/18723 | 1.12e-03 | 1.29e-02 | 49 |
| GO:00300381 | Colorectum | SER | contractile actin filament bundle assembly | 29/2897 | 106/18723 | 1.19e-03 | 1.36e-02 | 29 |
| GO:00431491 | Colorectum | SER | stress fiber assembly | 29/2897 | 106/18723 | 1.19e-03 | 1.36e-02 | 29 |
| GO:00423061 | Colorectum | SER | regulation of protein import into nucleus | 19/2897 | 60/18723 | 1.28e-03 | 1.43e-02 | 19 |
| GO:20012671 | Colorectum | SER | regulation of cysteine-type endopeptidase activity involved in apoptotic signaling pathway | 8/2897 | 16/18723 | 1.30e-03 | 1.45e-02 | 8 |
| GO:00435021 | Colorectum | SER | regulation of muscle adaptation | 27/2897 | 98/18723 | 1.54e-03 | 1.65e-02 | 27 |
| GO:00109211 | Colorectum | SER | regulation of phosphatase activity | 24/2897 | 84/18723 | 1.61e-03 | 1.71e-02 | 24 |
| GO:00353031 | Colorectum | SER | regulation of dephosphorylation | 33/2897 | 128/18723 | 1.71e-03 | 1.78e-02 | 33 |
| GO:00432801 | Colorectum | SER | positive regulation of cysteine-type endopeptidase activity involved in apoptotic process | 33/2897 | 129/18723 | 1.97e-03 | 1.97e-02 | 33 |
| GO:00071601 | Colorectum | SER | cell-matrix adhesion | 53/2897 | 233/18723 | 2.10e-03 | 2.06e-02 | 53 |
| GO:00600701 | Colorectum | SER | canonical Wnt signaling pathway | 66/2897 | 303/18723 | 2.10e-03 | 2.06e-02 | 66 |
| GO:00514921 | Colorectum | SER | regulation of stress fiber assembly | 25/2897 | 91/18723 | 2.36e-03 | 2.25e-02 | 25 |
| GO:00322331 | Colorectum | SER | positive regulation of actin filament bundle assembly | 19/2897 | 63/18723 | 2.41e-03 | 2.29e-02 | 19 |
| Page: 1 2 3 4 5 6 7 8 9 10 11 12 13 14 15 16 17 18 19 20 21 22 23 24 25 26 27 28 29 30 31 32 33 34 35 36 37 38 39 40 41 42 43 44 45 46 47 48 49 50 51 52 53 54 55 56 57 58 59 60 61 62 63 64 65 66 67 68 69 70 71 72 73 74 75 76 77 78 79 80 81 82 83 84 85 86 87 88 89 90 91 92 93 94 95 96 97 98 99 100 101 102 103 104 105 106 107 108 109 110 111 112 113 114 115 116 117 118 119 120 121 122 123 124 125 126 127 128 129 130 131 132 133 134 135 |
| Pathway ID | Tissue | Disease Stage | Description | Gene Ratio | Bg Ratio | pvalue | p.adjust | qvalue | Count |
| hsa0541520 | Cervix | CC | Diabetic cardiomyopathy | 76/1267 | 203/8465 | 1.40e-15 | 6.46e-14 | 3.82e-14 | 76 |
| hsa0421810 | Cervix | CC | Cellular senescence | 49/1267 | 156/8465 | 1.30e-07 | 1.63e-06 | 9.61e-07 | 49 |
| hsa0452020 | Cervix | CC | Adherens junction | 33/1267 | 93/8465 | 6.99e-07 | 7.31e-06 | 4.32e-06 | 33 |
| hsa0516620 | Cervix | CC | Human T-cell leukemia virus 1 infection | 61/1267 | 222/8465 | 8.13e-07 | 7.98e-06 | 4.72e-06 | 61 |
| hsa0414418 | Cervix | CC | Endocytosis | 64/1267 | 251/8465 | 6.97e-06 | 6.10e-05 | 3.61e-05 | 64 |
| hsa0521010 | Cervix | CC | Colorectal cancer | 27/1267 | 86/8465 | 8.60e-05 | 5.57e-04 | 3.30e-04 | 27 |
| hsa052128 | Cervix | CC | Pancreatic cancer | 24/1267 | 76/8465 | 1.89e-04 | 1.11e-03 | 6.55e-04 | 24 |
| hsa043109 | Cervix | CC | Wnt signaling pathway | 43/1267 | 171/8465 | 3.03e-04 | 1.64e-03 | 9.68e-04 | 43 |
| hsa043908 | Cervix | CC | Hippo signaling pathway | 40/1267 | 157/8465 | 3.64e-04 | 1.82e-03 | 1.07e-03 | 40 |
| hsa0522510 | Cervix | CC | Hepatocellular carcinoma | 40/1267 | 168/8465 | 1.52e-03 | 6.39e-03 | 3.78e-03 | 40 |
| hsa046596 | Cervix | CC | Th17 cell differentiation | 28/1267 | 108/8465 | 1.99e-03 | 7.98e-03 | 4.72e-03 | 28 |
| hsa0522014 | Cervix | CC | Chronic myeloid leukemia | 21/1267 | 76/8465 | 3.08e-03 | 1.19e-02 | 7.03e-03 | 21 |
| hsa041106 | Cervix | CC | Cell cycle | 36/1267 | 157/8465 | 4.94e-03 | 1.67e-02 | 9.86e-03 | 36 |
| hsa049336 | Cervix | CC | AGE-RAGE signaling pathway in diabetic complications | 25/1267 | 100/8465 | 5.64e-03 | 1.88e-02 | 1.11e-02 | 25 |
| hsa05415110 | Cervix | CC | Diabetic cardiomyopathy | 76/1267 | 203/8465 | 1.40e-15 | 6.46e-14 | 3.82e-14 | 76 |
| hsa0421815 | Cervix | CC | Cellular senescence | 49/1267 | 156/8465 | 1.30e-07 | 1.63e-06 | 9.61e-07 | 49 |
| hsa04520110 | Cervix | CC | Adherens junction | 33/1267 | 93/8465 | 6.99e-07 | 7.31e-06 | 4.32e-06 | 33 |
| hsa05166110 | Cervix | CC | Human T-cell leukemia virus 1 infection | 61/1267 | 222/8465 | 8.13e-07 | 7.98e-06 | 4.72e-06 | 61 |
| hsa0414419 | Cervix | CC | Endocytosis | 64/1267 | 251/8465 | 6.97e-06 | 6.10e-05 | 3.61e-05 | 64 |
| hsa0521015 | Cervix | CC | Colorectal cancer | 27/1267 | 86/8465 | 8.60e-05 | 5.57e-04 | 3.30e-04 | 27 |
| Page: 1 2 3 4 5 6 7 8 9 10 11 12 13 14 15 16 17 18 19 20 |
Top |
Cell-cell communication analysis |
| Identification of potential cell-cell interactions between two cell types and their ligand-receptor pairs for different disease states |
| Ligand | Receptor | LRpair | Pathway | Tissue | Disease Stage |
| Page: 1 |
Top |
Single-cell gene regulatory network inference analysis |
| Find out the significant the regulons (TFs) and the target genes of each regulon across cell types for different disease states |
| TF | Cell Type | Tissue | Disease Stage | Target Gene | RSS | Regulon Activity |
| SMAD3 | MES | Cervix | Healthy | EPAS1,GAS5,ALDH1A3, etc. | 2.53e-01 |  |
| SMAD3 | CD8TCM | Cervix | ADJ | ACTN4,NDE1,PVT1, etc. | 7.66e-02 |  |
| SMAD3 | NK | Cervix | HSIL_HPV | ACTN4,NDE1,PVT1, etc. | 1.19e-01 |  |
| SMAD3 | CD8TCM | Cervix | N_HPV | ACTN4,NDE1,PVT1, etc. | 1.09e-01 |  |
| SMAD3 | NK | Cervix | N_HPV | ACTN4,NDE1,PVT1, etc. | 7.47e-02 | |
| SMAD3 | BN | Liver | HCC | EPHX1,CMC1,P2RY8, etc. | 5.41e-02 |  |
| SMAD3 | MAST | Lung | IAC | PID1,PLCB1,GRK5, etc. | 3.55e-02 |  |
| SMAD3 | NEUT | Lung | IAC | PID1,PLCB1,GRK5, etc. | 2.31e-02 | |
| SMAD3 | CD4TN | Lung | IAC | PID1,PLCB1,GRK5, etc. | 1.96e-01 | |
| SMAD3 | MMC | Lung | IAC | PID1,PLCB1,GRK5, etc. | 2.32e-02 | |
| ∗The dot plots of a searched regulon are shown for all cell subpopulations in each disease state of each tissue based on the regulon specific score inferred using pySCENIC and by calculating the average expression. |
| Page: 1 2 3 |
Top |
Somatic mutation of malignant transformation related genes |
| Annotation of somatic variants for genes involved in malignant transformation |
| Hugo Symbol | Variant Class | Variant Classification | dbSNP RS | HGVSc | HGVSp | HGVSp Short | SWISSPROT | BIOTYPE | SIFT | PolyPhen | Tumor Sample Barcode | Tissue | Histology | Sex | Age | Stage | Therapy Types | Drugs | Outcome |
| SMAD3 | SNV | Missense_Mutation | novel | c.1094N>C | p.Gln365Pro | p.Q365P | P84022 | protein_coding | deleterious(0.01) | possibly_damaging(0.882) | TCGA-A2-A04R-01 | Breast | breast invasive carcinoma | Female | <65 | I/II | Chemotherapy | taxol | SD |
| SMAD3 | SNV | Missense_Mutation | rs779602560 | c.1145C>T | p.Ala382Val | p.A382V | P84022 | protein_coding | deleterious(0.04) | benign(0.167) | TCGA-A2-A0T6-01 | Breast | breast invasive carcinoma | Female | <65 | I/II | Chemotherapy | adriamycin | SD |
| SMAD3 | SNV | Missense_Mutation | rs863223765 | c.278N>A | p.Arg93Gln | p.R93Q | P84022 | protein_coding | deleterious(0) | probably_damaging(1) | TCGA-E2-A152-01 | Breast | breast invasive carcinoma | Female | <65 | I/II | Targeted Molecular therapy | trastuzumab | PD |
| SMAD3 | SNV | Missense_Mutation | novel | c.611N>A | p.Ser204Tyr | p.S204Y | P84022 | protein_coding | tolerated(0.09) | benign(0) | TCGA-E9-A244-01 | Breast | breast invasive carcinoma | Female | <65 | I/II | Chemotherapy | cyclophosphamide | SD |
| SMAD3 | SNV | Missense_Mutation | c.68N>G | p.Gln23Arg | p.Q23R | P84022 | protein_coding | deleterious(0.01) | benign(0.091) | TCGA-EW-A1IZ-01 | Breast | breast invasive carcinoma | Female | <65 | III/IV | Chemotherapy | taxotere | SD | |
| SMAD3 | insertion | Nonsense_Mutation | novel | c.263_264insTCTCTACTAAAAATACAAAAACAAAATTAG | p.Tyr88_Cys89insLeuTyrTerLysTyrLysAsnLysIleSer | p.Y88_C89insLY*KYKNKIS | P84022 | protein_coding | TCGA-A2-A0D1-01 | Breast | breast invasive carcinoma | Female | >=65 | I/II | Chemotherapy | taxotere | SD | ||
| SMAD3 | SNV | Missense_Mutation | rs863223736 | c.728N>A | p.Arg243His | p.R243H | P84022 | protein_coding | deleterious(0) | probably_damaging(1) | TCGA-2W-A8YY-01 | Cervix | cervical & endocervical cancer | Female | <65 | I/II | Chemotherapy | cisplatin | CR |
| SMAD3 | SNV | Missense_Mutation | rs773543026 | c.730G>A | p.Val244Ile | p.V244I | P84022 | protein_coding | tolerated(0.12) | benign(0.395) | TCGA-EA-A410-01 | Cervix | cervical & endocervical cancer | Female | <65 | I/II | Unknown | Unknown | SD |
| SMAD3 | SNV | Missense_Mutation | rs387906850 | c.859C>T | p.Arg287Trp | p.R287W | P84022 | protein_coding | deleterious(0) | probably_damaging(1) | TCGA-EA-A410-01 | Cervix | cervical & endocervical cancer | Female | <65 | I/II | Unknown | Unknown | SD |
| SMAD3 | SNV | Missense_Mutation | c.384G>C | p.Gln128His | p.Q128H | P84022 | protein_coding | deleterious(0.02) | possibly_damaging(0.528) | TCGA-EK-A2RJ-01 | Cervix | cervical & endocervical cancer | Female | <65 | I/II | Unknown | Unknown | SD |
| Page: 1 2 3 4 5 6 7 8 9 |
Top |
Related drugs of malignant transformation related genes |
| Identification of chemicals and drugs interact with genes involved in malignant transfromation |
| (DGIdb 4.0) |
| Entrez ID | Symbol | Category | Interaction Types | Drug Claim Name | Drug Name | PMIDs |
| 4088 | SMAD3 | DRUGGABLE GENOME, KINASE, CLINICALLY ACTIONABLE, TRANSCRIPTION FACTOR COMPLEX | GNF-PF-1295 | CHEMBL579837 | ||
| 4088 | SMAD3 | DRUGGABLE GENOME, KINASE, CLINICALLY ACTIONABLE, TRANSCRIPTION FACTOR COMPLEX | HELENALIN | HELENALIN | ||
| 4088 | SMAD3 | DRUGGABLE GENOME, KINASE, CLINICALLY ACTIONABLE, TRANSCRIPTION FACTOR COMPLEX | TRICLOCARBAN | TRICLOCARBAN | ||
| 4088 | SMAD3 | DRUGGABLE GENOME, KINASE, CLINICALLY ACTIONABLE, TRANSCRIPTION FACTOR COMPLEX | DNDI1417601 | CHEMBL1503729 | ||
| 4088 | SMAD3 | DRUGGABLE GENOME, KINASE, CLINICALLY ACTIONABLE, TRANSCRIPTION FACTOR COMPLEX | CID 663143 | CHEMBL1342336 | ||
| 4088 | SMAD3 | DRUGGABLE GENOME, KINASE, CLINICALLY ACTIONABLE, TRANSCRIPTION FACTOR COMPLEX | BISINDOLYLMALEIMIDE IX | BISINDOLYLMALEIMIDE IX | ||
| 4088 | SMAD3 | DRUGGABLE GENOME, KINASE, CLINICALLY ACTIONABLE, TRANSCRIPTION FACTOR COMPLEX | MITOXANTRONE | MITOXANTRONE | ||
| 4088 | SMAD3 | DRUGGABLE GENOME, KINASE, CLINICALLY ACTIONABLE, TRANSCRIPTION FACTOR COMPLEX | NSC-724440 | CHEMBL515617 | ||
| 4088 | SMAD3 | DRUGGABLE GENOME, KINASE, CLINICALLY ACTIONABLE, TRANSCRIPTION FACTOR COMPLEX | GNF-PF-1134 | CHEMBL600694 | ||
| 4088 | SMAD3 | DRUGGABLE GENOME, KINASE, CLINICALLY ACTIONABLE, TRANSCRIPTION FACTOR COMPLEX | AZACITIDINE | AZACITIDINE |
| Page: 1 2 3 4 5 6 7 8 9 10 11 12 13 14 15 16 17 18 19 20 21 22 23 |

Copyright 2023-Present -The University of Texas Health Science Center at Houston |