
|
|||||
|
 | |
| |
| |
| |
| |
| |
|
Gene: RICTOR |
Gene summary for RICTOR |
| Gene information | Species | Human | Gene symbol | RICTOR | Gene ID | 253260 |
| Gene name | RPTOR independent companion of MTOR complex 2 | |
| Gene Alias | AVO3 | |
| Cytomap | 5p13.1 | |
| Gene Type | protein-coding | GO ID | GO:0001932 | UniProtAcc | Q6R327 |
Top |
Malignant transformation analysis |
| Identification of the aberrant gene expression in precancerous and cancerous lesions by comparing the gene expression of stem-like cells in diseased tissues with normal stem cells |
| Entrez ID | Symbol | Replicates | Species | Organ | Tissue | Adj P-value | Log2FC | Malignancy |
| 253260 | RICTOR | CA_HPV_1 | Human | Cervix | CC | 2.48e-03 | 1.49e-01 | 0.0264 |
| 253260 | RICTOR | CCI_1 | Human | Cervix | CC | 8.38e-09 | 1.14e+00 | 0.528 |
| 253260 | RICTOR | CCI_2 | Human | Cervix | CC | 1.35e-08 | 1.12e+00 | 0.5249 |
| 253260 | RICTOR | CCI_3 | Human | Cervix | CC | 1.50e-20 | 1.40e+00 | 0.516 |
| 253260 | RICTOR | sample3 | Human | Cervix | CC | 8.26e-12 | 3.32e-01 | 0.1387 |
| 253260 | RICTOR | T3 | Human | Cervix | CC | 3.80e-10 | 3.24e-01 | 0.1389 |
| 253260 | RICTOR | HTA11_3410_2000001011 | Human | Colorectum | AD | 2.45e-15 | -6.11e-01 | 0.0155 |
| 253260 | RICTOR | HTA11_3361_2000001011 | Human | Colorectum | AD | 3.63e-07 | -5.63e-01 | -0.1207 |
| 253260 | RICTOR | HTA11_696_2000001011 | Human | Colorectum | AD | 7.53e-13 | -3.94e-01 | -0.1464 |
| 253260 | RICTOR | HTA11_866_2000001011 | Human | Colorectum | AD | 2.70e-02 | -2.96e-01 | -0.1001 |
| 253260 | RICTOR | HTA11_546_2000001011 | Human | Colorectum | AD | 3.73e-02 | -4.18e-01 | -0.0842 |
| 253260 | RICTOR | HTA11_7862_2000001011 | Human | Colorectum | AD | 1.34e-02 | -5.30e-01 | -0.0179 |
| 253260 | RICTOR | HTA11_866_3004761011 | Human | Colorectum | AD | 3.26e-10 | -4.67e-01 | 0.096 |
| 253260 | RICTOR | HTA11_7696_3000711011 | Human | Colorectum | AD | 1.99e-05 | -4.33e-01 | 0.0674 |
| 253260 | RICTOR | HTA11_99999974143_84620 | Human | Colorectum | MSS | 7.06e-23 | -5.55e-01 | 0.3005 |
| 253260 | RICTOR | F007 | Human | Colorectum | FAP | 1.81e-05 | -4.34e-01 | 0.1176 |
| 253260 | RICTOR | A002-C-010 | Human | Colorectum | FAP | 2.41e-04 | -1.91e-01 | 0.242 |
| 253260 | RICTOR | A001-C-207 | Human | Colorectum | FAP | 1.09e-04 | -2.45e-01 | 0.1278 |
| 253260 | RICTOR | A015-C-203 | Human | Colorectum | FAP | 8.87e-28 | -3.88e-01 | -0.1294 |
| 253260 | RICTOR | A015-C-204 | Human | Colorectum | FAP | 3.91e-04 | -2.55e-01 | -0.0228 |
| Page: 1 2 3 4 5 6 7 8 9 |
| Tissue | Expression Dynamics | Abbreviation |
| Cervix | 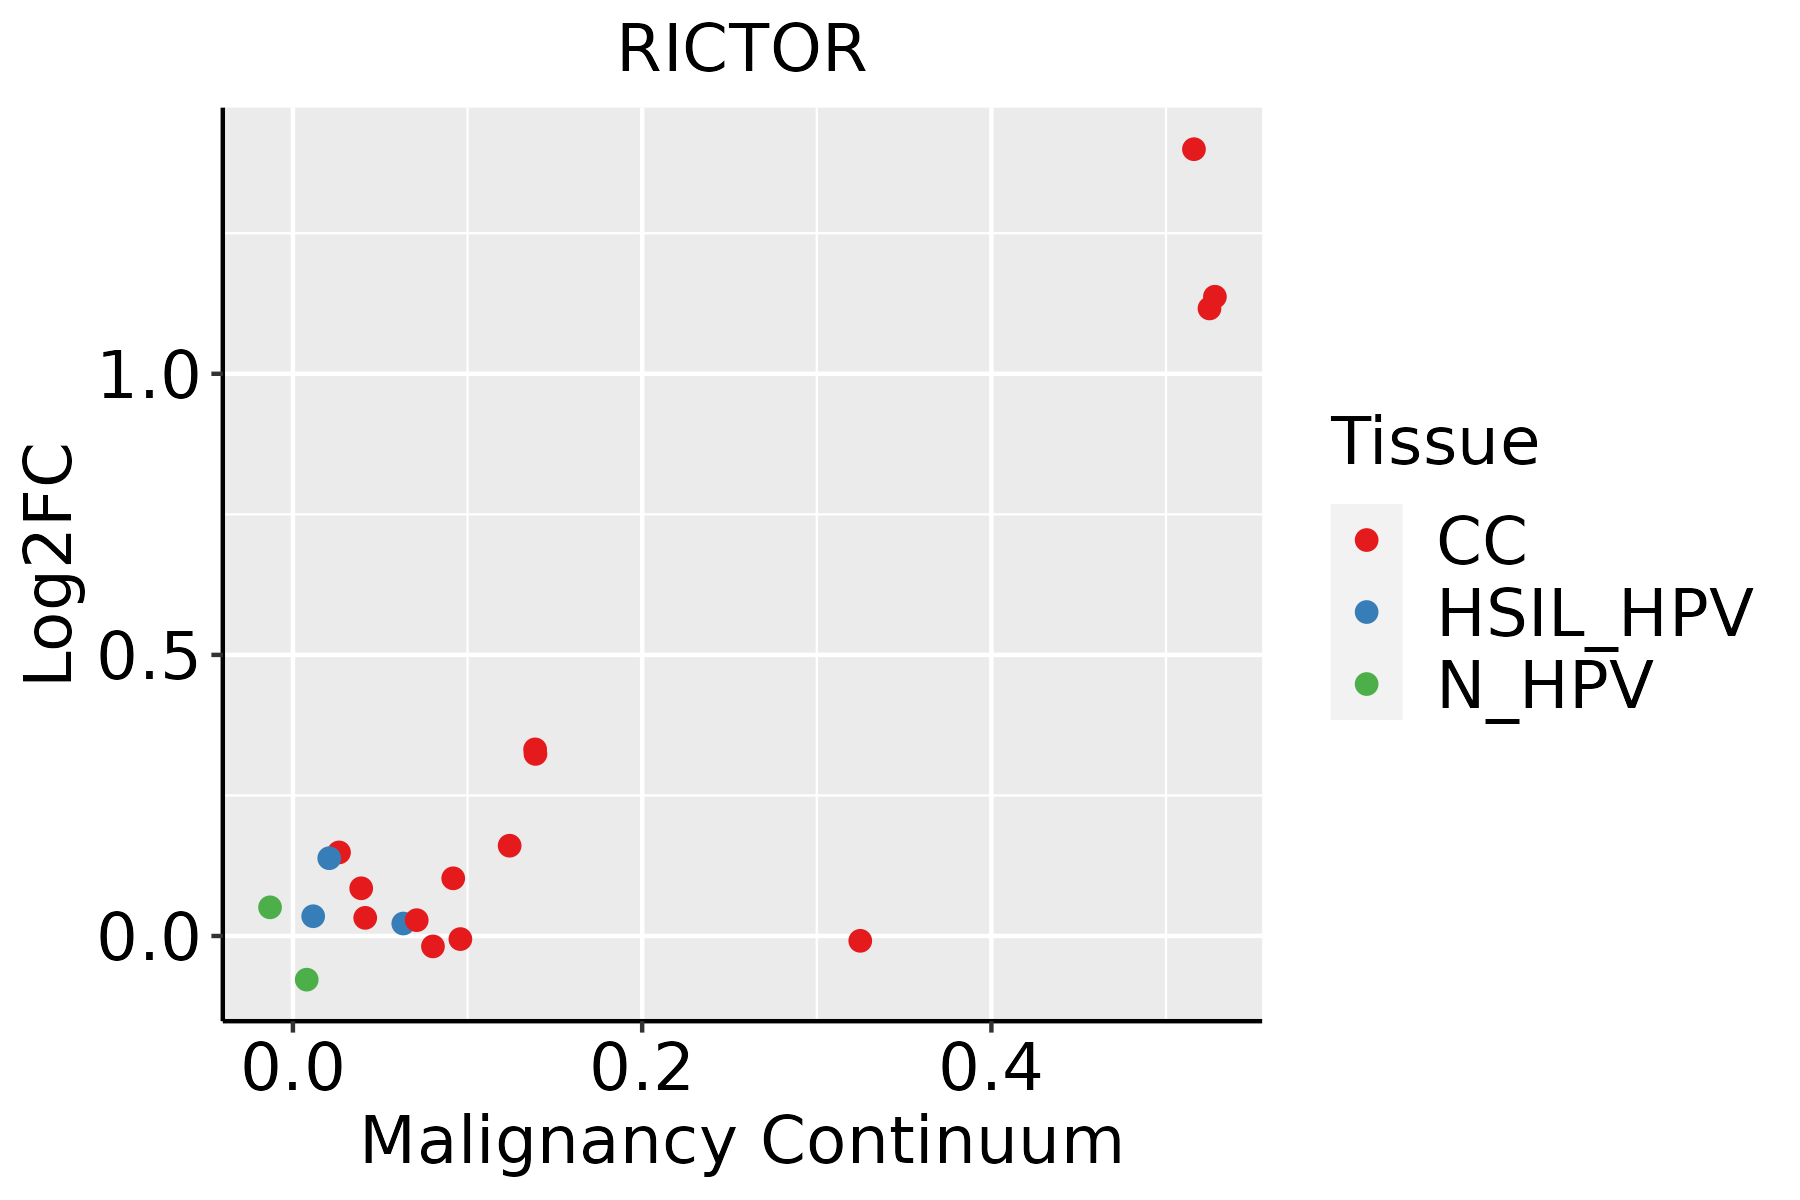 | CC: Cervix cancer |
| HSIL_HPV: HPV-infected high-grade squamous intraepithelial lesions | ||
| N_HPV: HPV-infected normal cervix | ||
| Colorectum (GSE201348) | 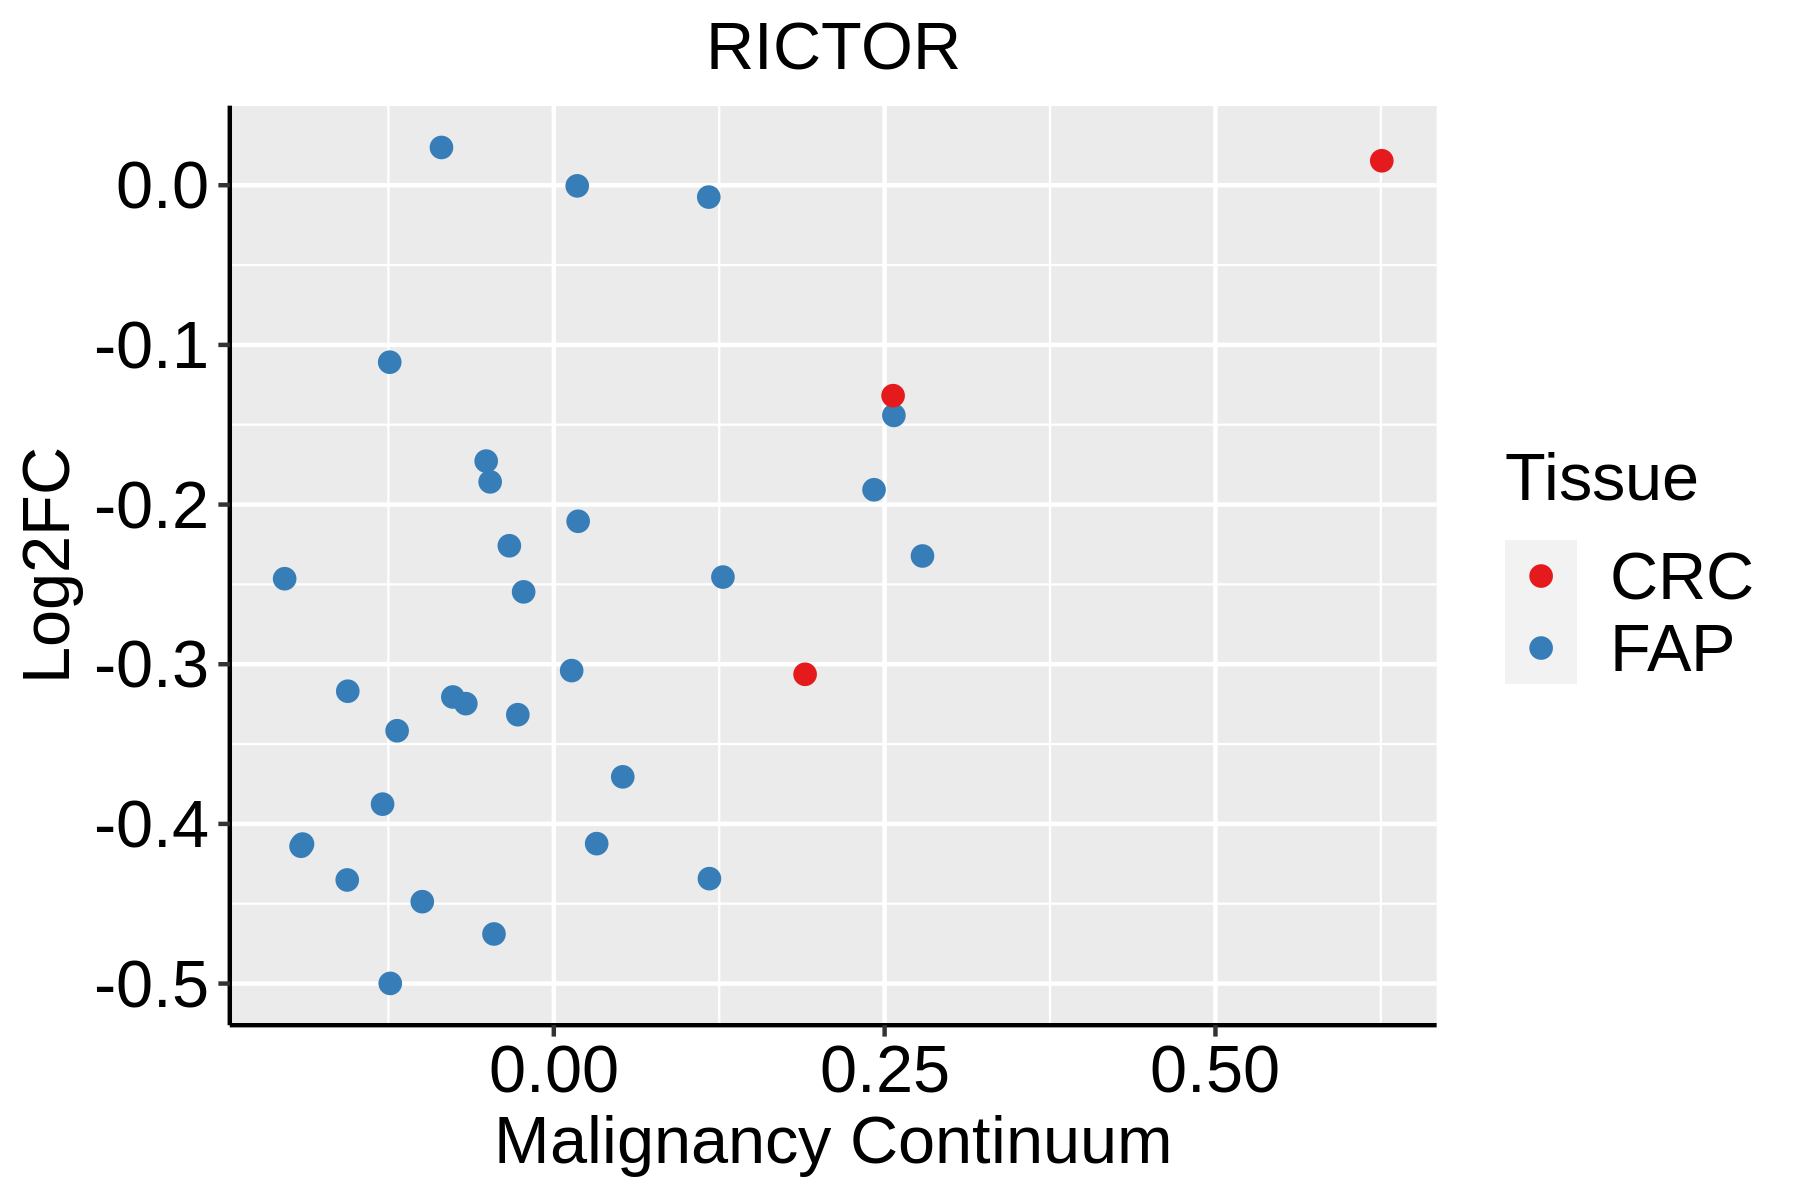 | FAP: Familial adenomatous polyposis |
| CRC: Colorectal cancer | ||
| Colorectum (HTA11) |  | AD: Adenomas |
| SER: Sessile serrated lesions | ||
| MSI-H: Microsatellite-high colorectal cancer | ||
| MSS: Microsatellite stable colorectal cancer | ||
| Esophagus | 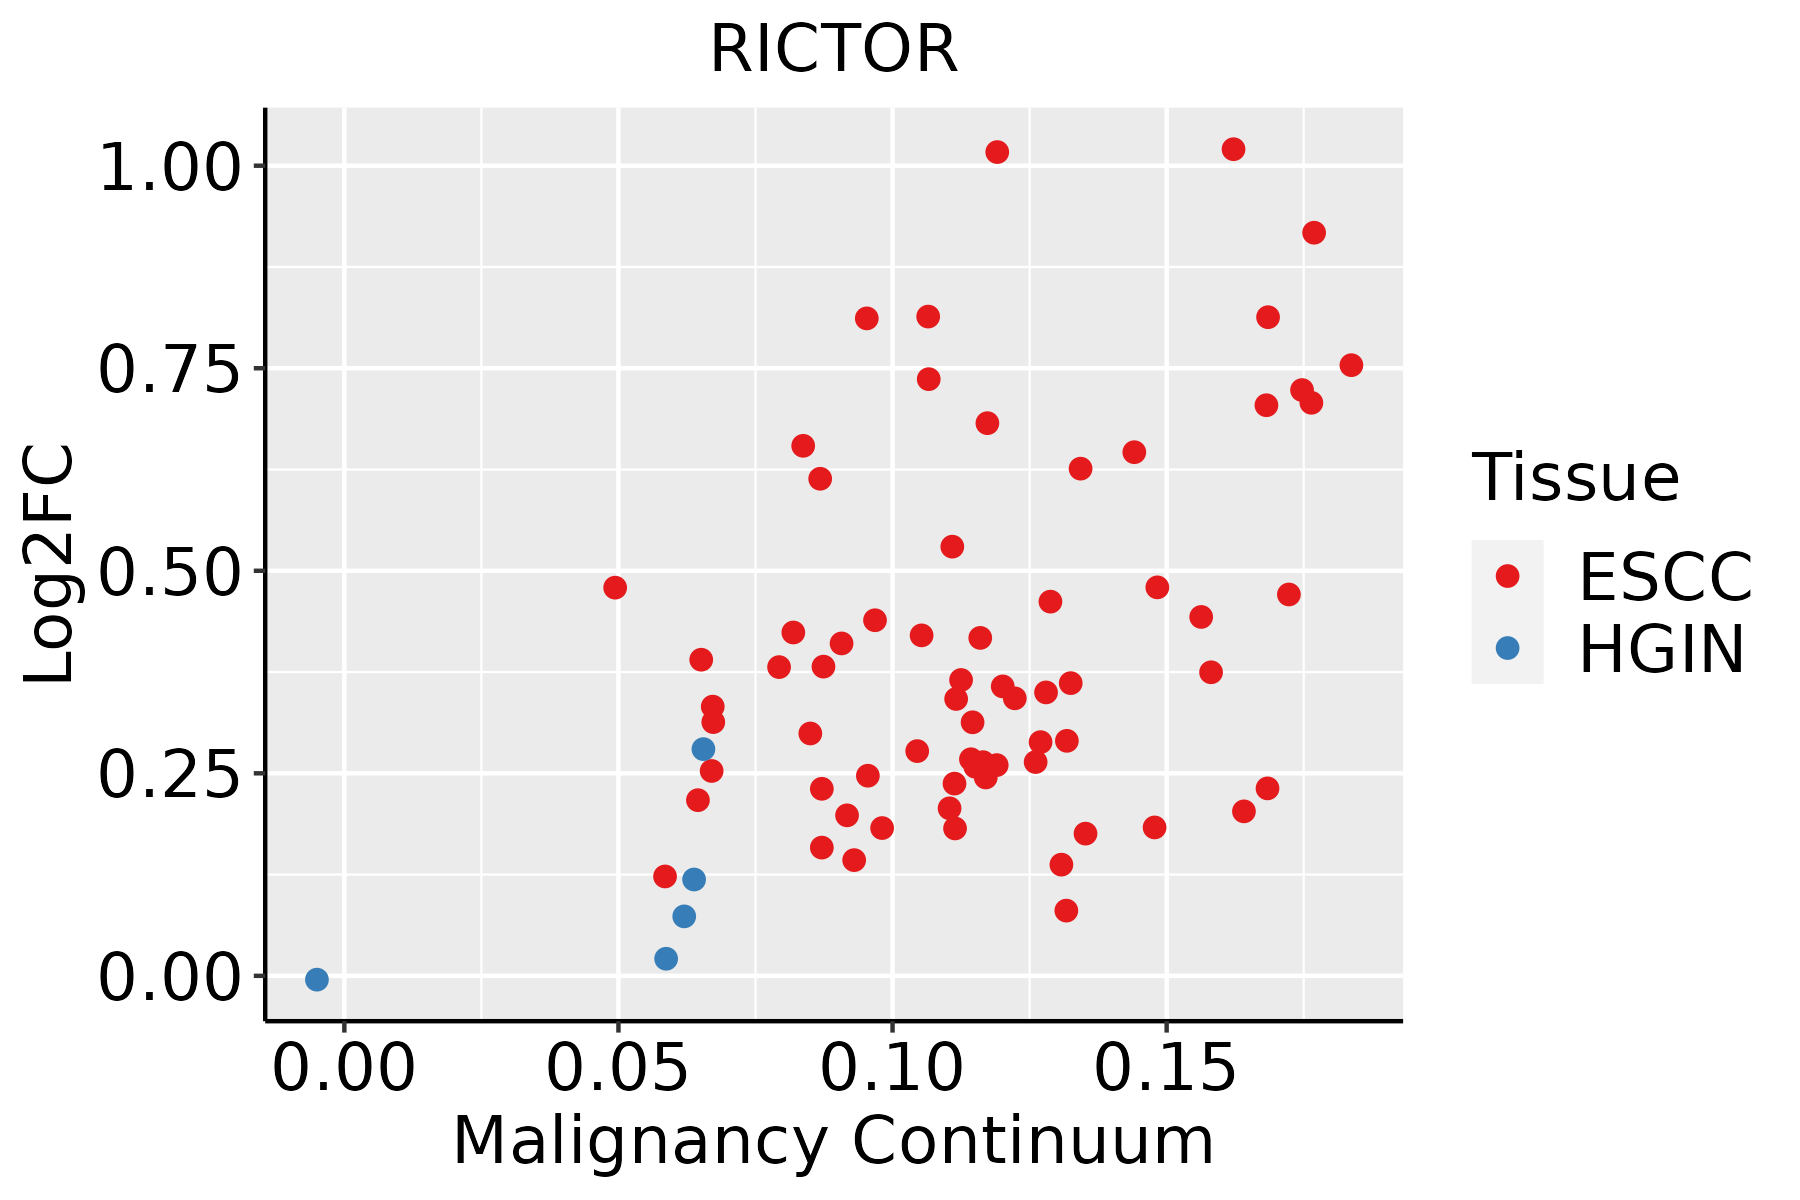 | ESCC: Esophageal squamous cell carcinoma |
| HGIN: High-grade intraepithelial neoplasias | ||
| LGIN: Low-grade intraepithelial neoplasias | ||
| Liver | 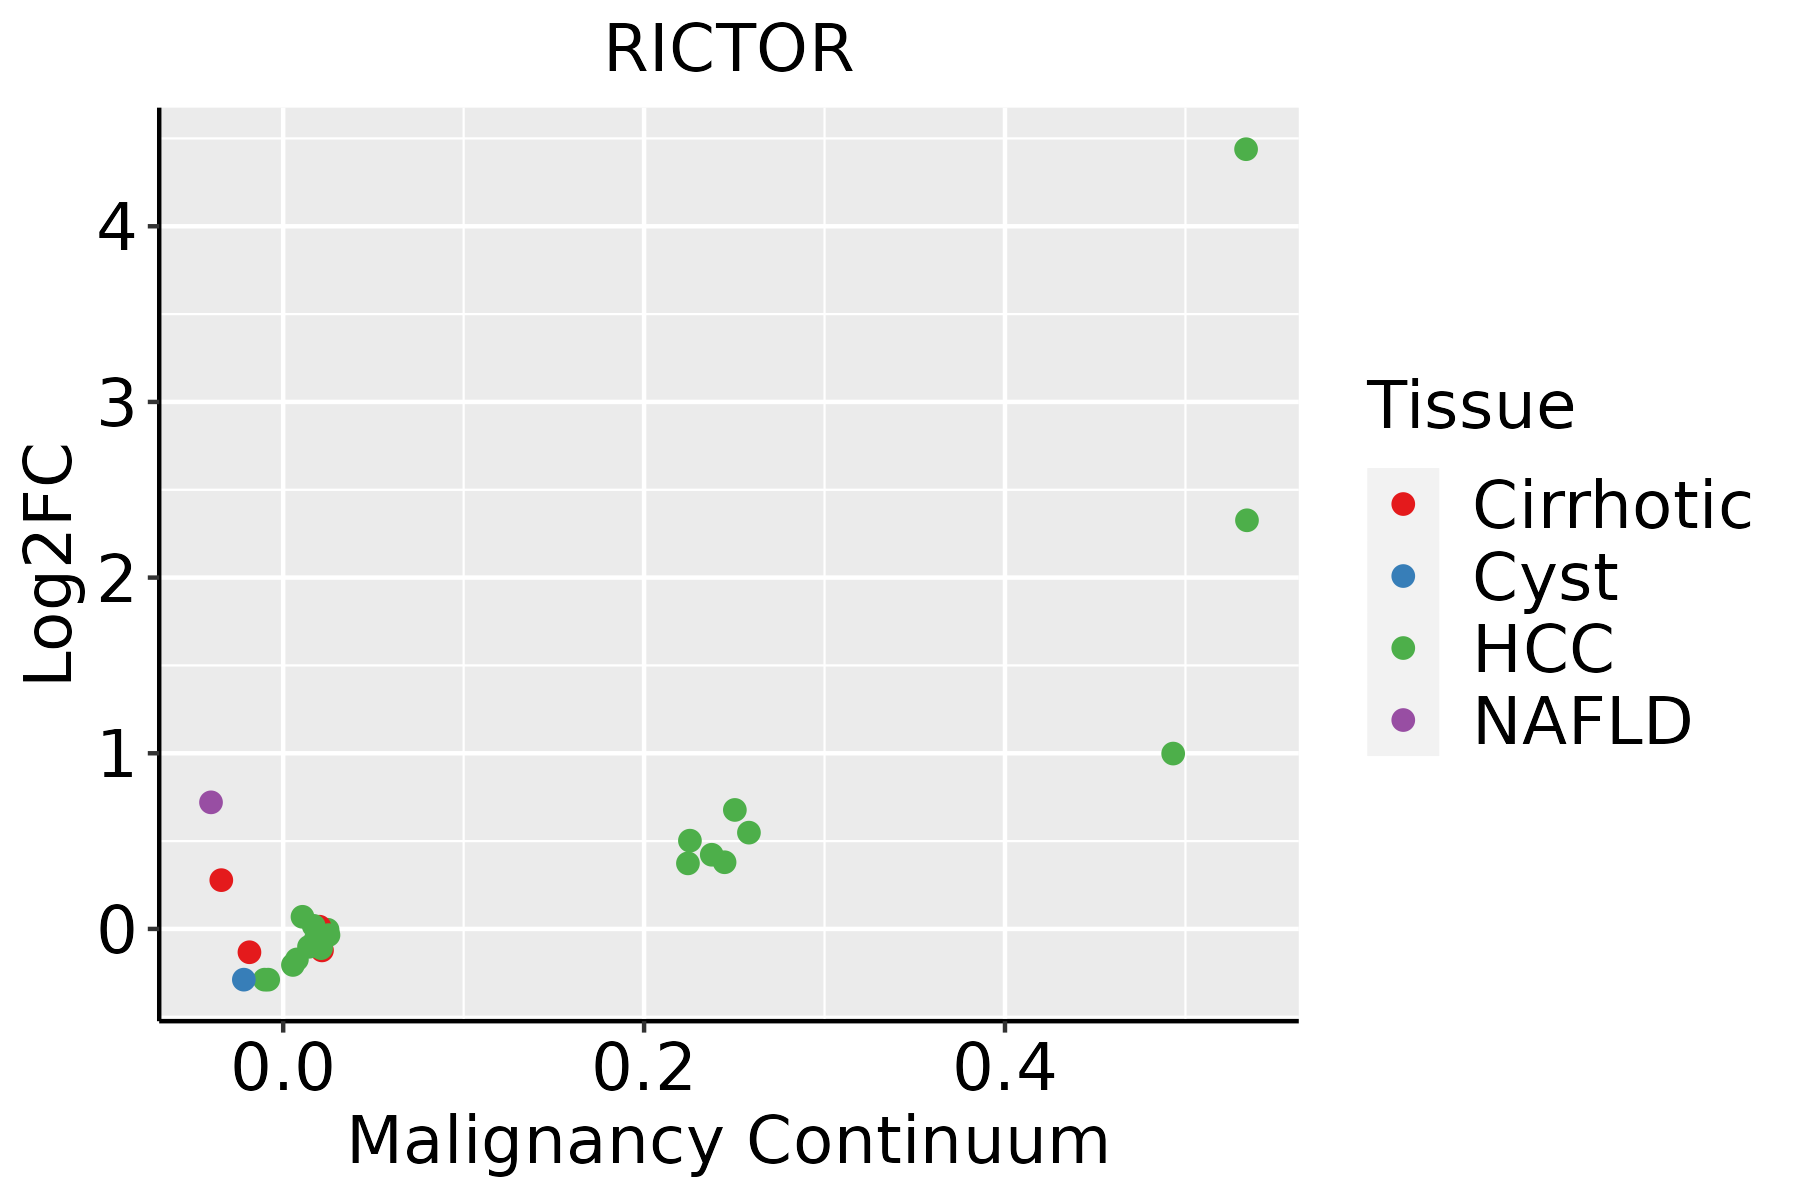 | HCC: Hepatocellular carcinoma |
| NAFLD: Non-alcoholic fatty liver disease | ||
| Lung |  | AAH: Atypical adenomatous hyperplasia |
| AIS: Adenocarcinoma in situ | ||
| IAC: Invasive lung adenocarcinoma | ||
| MIA: Minimally invasive adenocarcinoma | ||
| Oral Cavity | 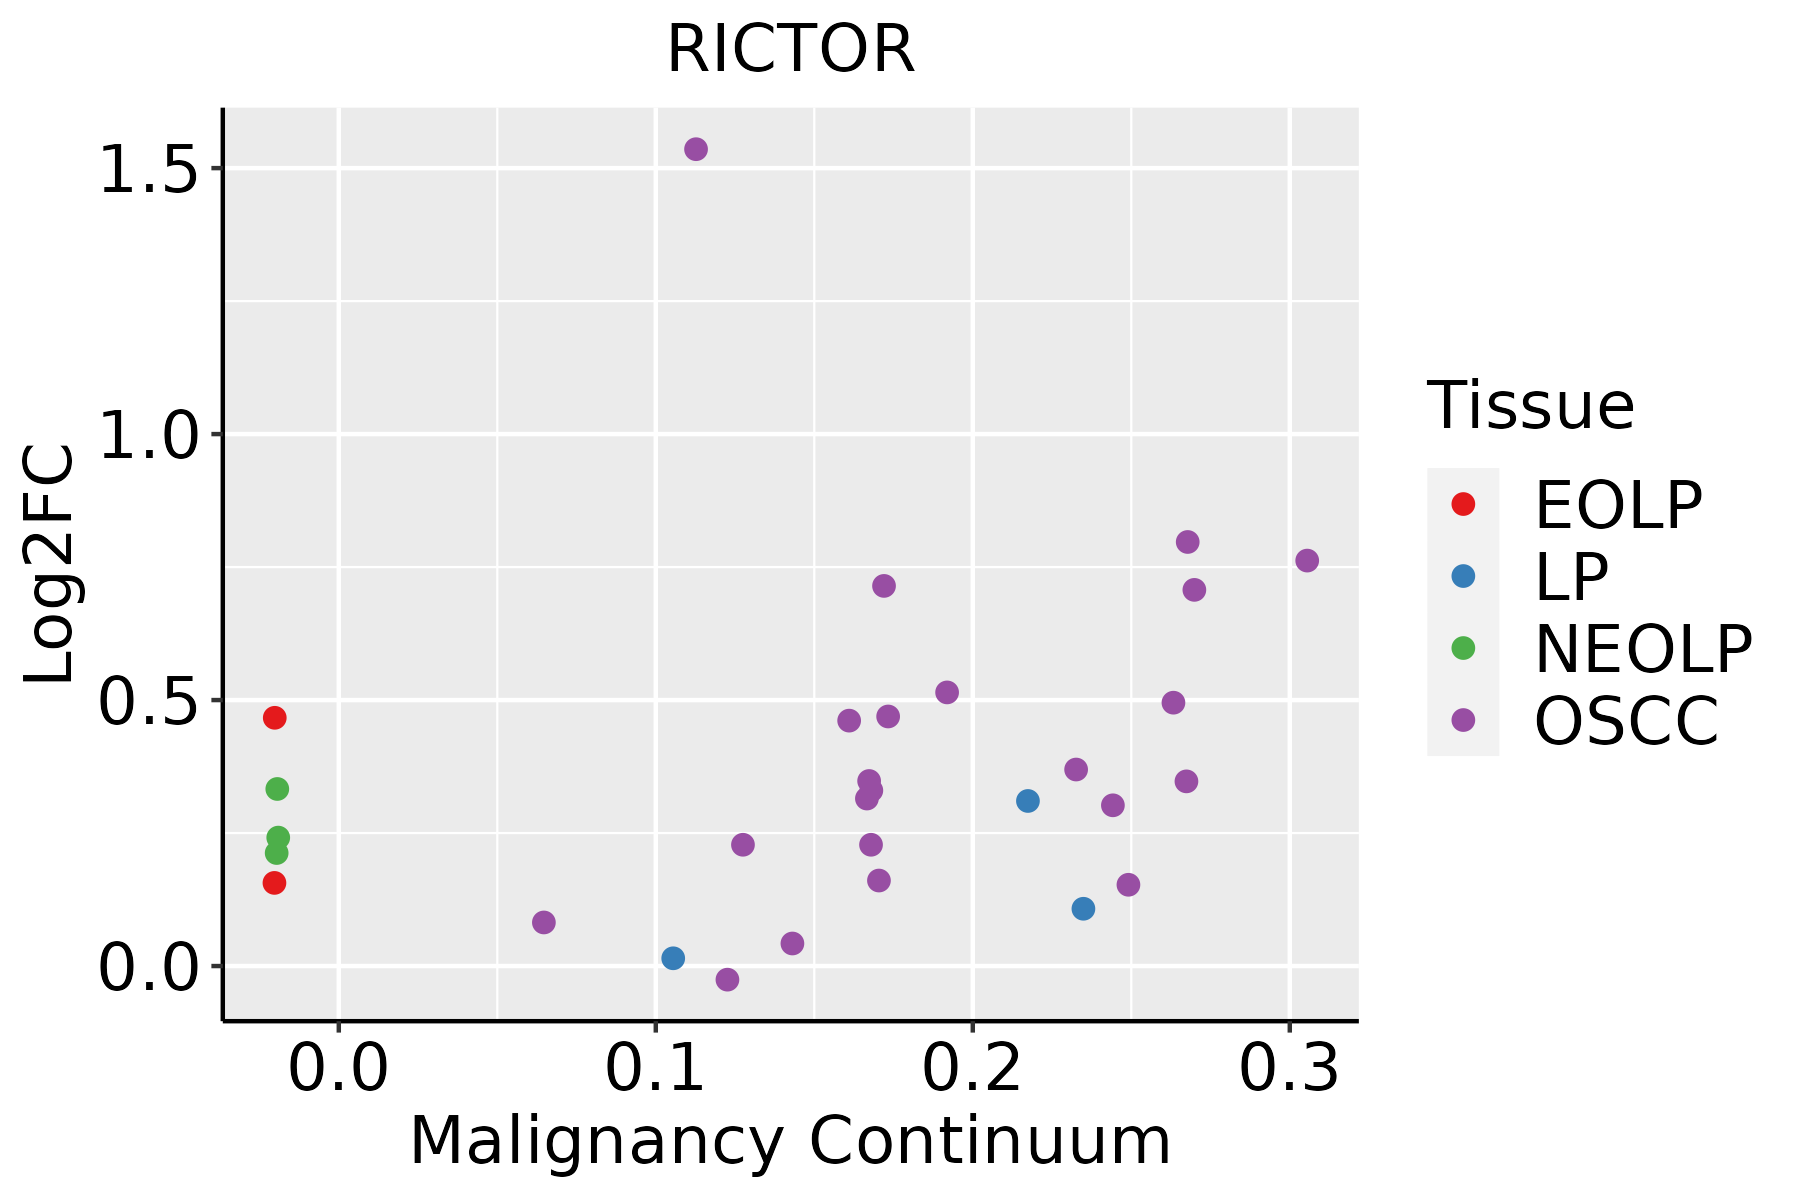 | EOLP: Erosive Oral lichen planus |
| LP: leukoplakia | ||
| NEOLP: Non-erosive oral lichen planus | ||
| OSCC: Oral squamous cell carcinoma | ||
| Thyroid | 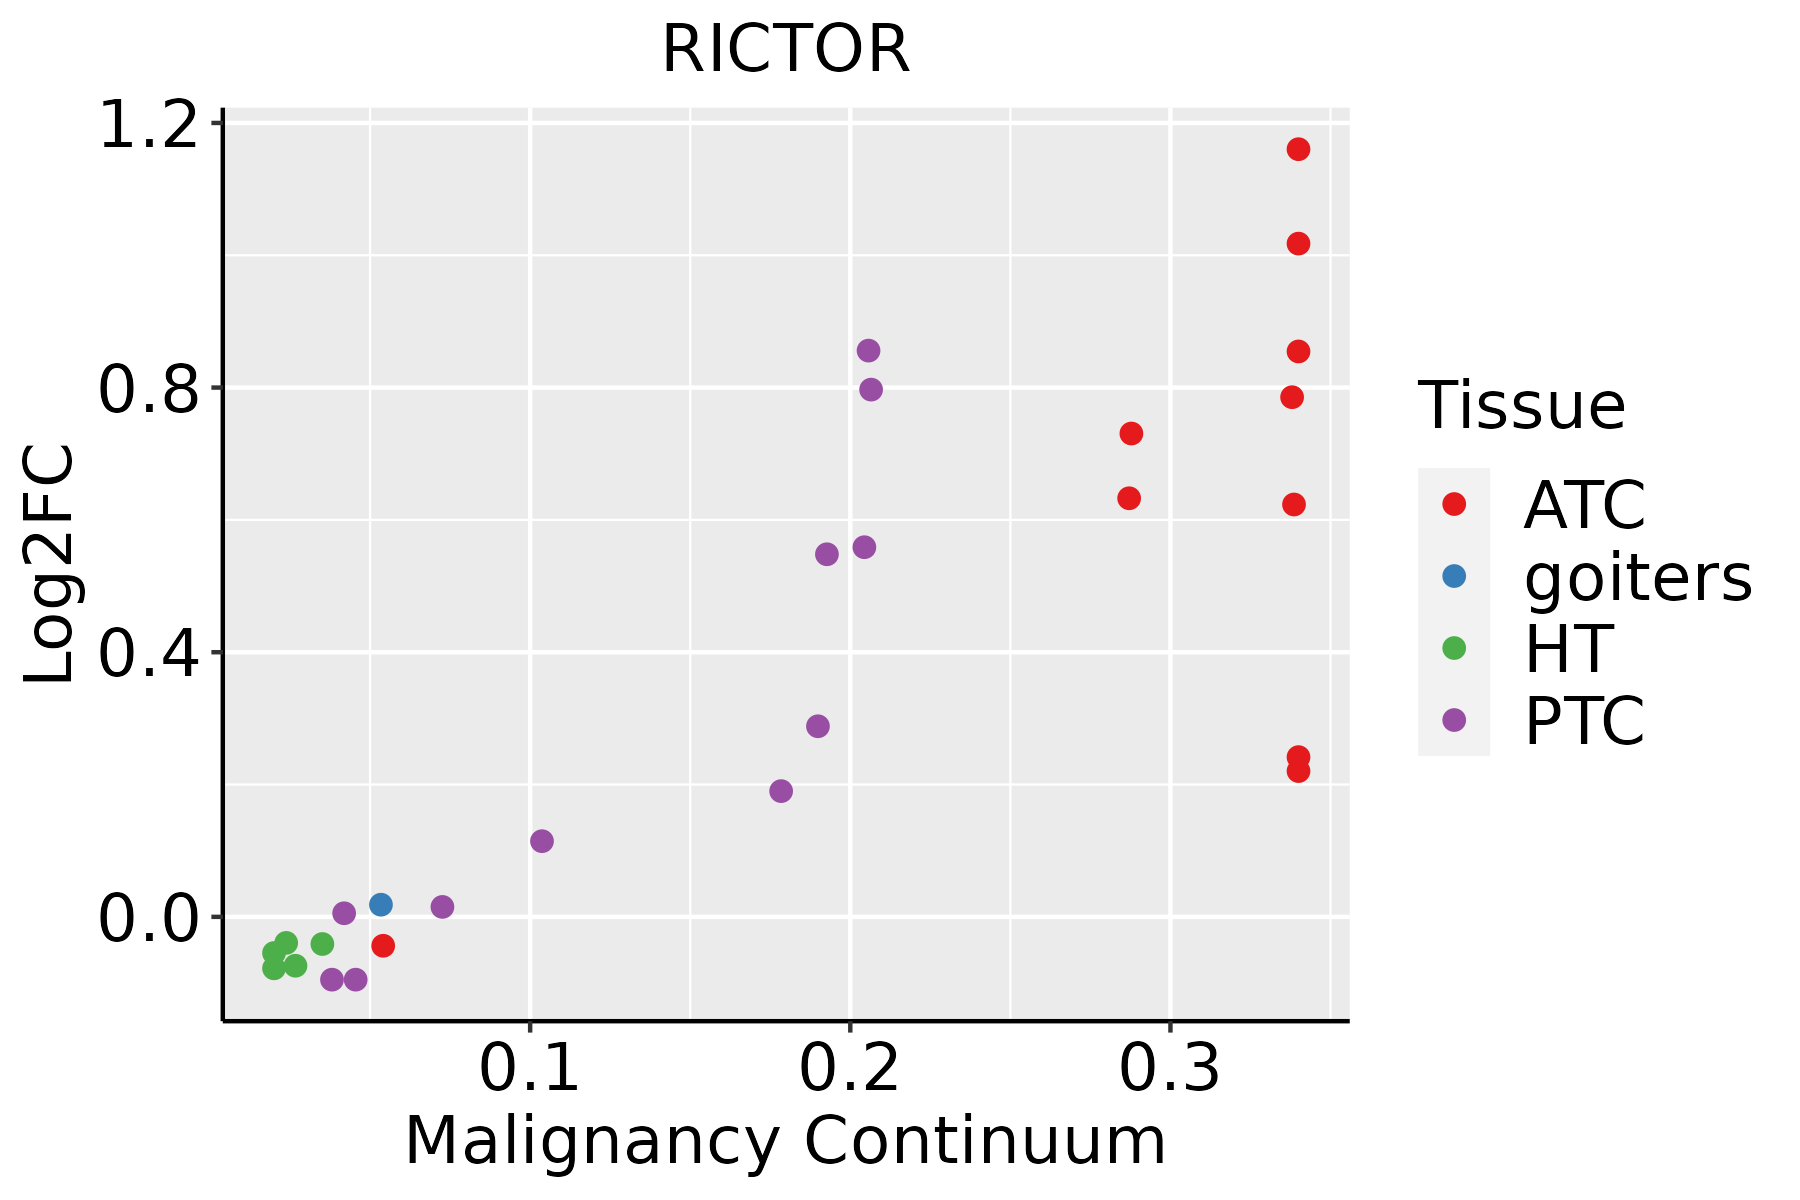 | ATC: Anaplastic thyroid cancer |
| HT: Hashimoto's thyroiditis | ||
| PTC: Papillary thyroid cancer |
| ∗log2FC in expression of this searched gene in stem-like cells from each diseased tissue sample relative to stem-like cells in normal samples in each tissue plotted against the malignancy continuum. Samples are colored based on if they are from different disease stage. |
Top |
Malignant transformation related pathway analysis |
| Find out the enriched GO biological processes and KEGG pathways involved in transition from healthy to precancer to cancer |
| Tissue | Disease Stage | Enriched GO biological Processes |
| Colorectum | AD |  |
| Colorectum | SER |  |
| Colorectum | MSS |  |
| Colorectum | MSI-H |  |
| Colorectum | FAP |  |
| ∗Top 15 enriched GO BP terms are showed in the bar plot of each disease state in each tissue. Each row represents a significant GO biological process which is colored according to the -log10(p.adjust). |
| Page: 1 2 3 4 5 6 7 8 9 |
| GO ID | Tissue | Disease Stage | Description | Gene Ratio | Bg Ratio | pvalue | p.adjust | Count |
| GO:003227123 | Lung | AAH | regulation of protein polymerization | 17/613 | 233/18723 | 1.79e-03 | 4.22e-02 | 17 |
| GO:003133422 | Lung | AAH | positive regulation of protein-containing complex assembly | 17/613 | 237/18723 | 2.15e-03 | 4.66e-02 | 17 |
| GO:000815423 | Lung | AAH | actin polymerization or depolymerization | 16/613 | 218/18723 | 2.27e-03 | 4.84e-02 | 16 |
| GO:003001031 | Lung | MIAC | establishment of cell polarity | 27/967 | 143/18723 | 4.16e-09 | 4.27e-06 | 27 |
| GO:000716332 | Lung | MIAC | establishment or maintenance of cell polarity | 34/967 | 218/18723 | 7.70e-09 | 4.94e-06 | 34 |
| GO:000701533 | Lung | MIAC | actin filament organization | 50/967 | 442/18723 | 1.64e-07 | 3.81e-05 | 50 |
| GO:004308721 | Lung | MIAC | regulation of GTPase activity | 41/967 | 348/18723 | 7.39e-07 | 1.08e-04 | 41 |
| GO:001810521 | Lung | MIAC | peptidyl-serine phosphorylation | 37/967 | 315/18723 | 2.73e-06 | 3.12e-04 | 37 |
| GO:005125823 | Lung | MIAC | protein polymerization | 35/967 | 297/18723 | 4.69e-06 | 4.81e-04 | 35 |
| GO:190290333 | Lung | MIAC | regulation of supramolecular fiber organization | 41/967 | 383/18723 | 8.33e-06 | 7.24e-04 | 41 |
| GO:003227132 | Lung | MIAC | regulation of protein polymerization | 29/967 | 233/18723 | 1.06e-05 | 8.86e-04 | 29 |
| GO:004325423 | Lung | MIAC | regulation of protein-containing complex assembly | 44/967 | 428/18723 | 1.11e-05 | 9.00e-04 | 44 |
| GO:001820921 | Lung | MIAC | peptidyl-serine modification | 37/967 | 338/18723 | 1.38e-05 | 9.86e-04 | 37 |
| GO:011005332 | Lung | MIAC | regulation of actin filament organization | 32/967 | 278/18723 | 1.91e-05 | 1.27e-03 | 32 |
| GO:003297032 | Lung | MIAC | regulation of actin filament-based process | 41/967 | 397/18723 | 1.96e-05 | 1.28e-03 | 41 |
| GO:003287831 | Lung | MIAC | regulation of establishment or maintenance of cell polarity | 8/967 | 25/18723 | 2.42e-05 | 1.53e-03 | 8 |
| GO:003153231 | Lung | MIAC | actin cytoskeleton reorganization | 17/967 | 107/18723 | 3.31e-05 | 1.91e-03 | 17 |
| GO:003133432 | Lung | MIAC | positive regulation of protein-containing complex assembly | 28/967 | 237/18723 | 3.91e-05 | 2.08e-03 | 28 |
| GO:003295632 | Lung | MIAC | regulation of actin cytoskeleton organization | 37/967 | 358/18723 | 4.85e-05 | 2.49e-03 | 37 |
| GO:200011431 | Lung | MIAC | regulation of establishment of cell polarity | 7/967 | 22/18723 | 8.25e-05 | 3.75e-03 | 7 |
| Page: 1 2 3 4 5 6 7 8 9 10 11 12 13 14 15 16 17 18 19 20 21 22 23 24 25 26 27 28 |
| Pathway ID | Tissue | Disease Stage | Description | Gene Ratio | Bg Ratio | pvalue | p.adjust | qvalue | Count |
| hsa041505 | Esophagus | ESCC | mTOR signaling pathway | 98/4205 | 156/8465 | 5.81e-04 | 1.95e-03 | 9.97e-04 | 98 |
| hsa0415013 | Esophagus | ESCC | mTOR signaling pathway | 98/4205 | 156/8465 | 5.81e-04 | 1.95e-03 | 9.97e-04 | 98 |
| hsa041502 | Liver | HCC | mTOR signaling pathway | 95/4020 | 156/8465 | 4.70e-04 | 1.99e-03 | 1.11e-03 | 95 |
| hsa0415011 | Liver | HCC | mTOR signaling pathway | 95/4020 | 156/8465 | 4.70e-04 | 1.99e-03 | 1.11e-03 | 95 |
| hsa041504 | Oral cavity | OSCC | mTOR signaling pathway | 90/3704 | 156/8465 | 2.87e-04 | 9.15e-04 | 4.66e-04 | 90 |
| hsa0415012 | Oral cavity | OSCC | mTOR signaling pathway | 90/3704 | 156/8465 | 2.87e-04 | 9.15e-04 | 4.66e-04 | 90 |
| hsa0415021 | Oral cavity | EOLP | mTOR signaling pathway | 34/1218 | 156/8465 | 7.59e-03 | 2.17e-02 | 1.28e-02 | 34 |
| hsa041503 | Oral cavity | EOLP | mTOR signaling pathway | 34/1218 | 156/8465 | 7.59e-03 | 2.17e-02 | 1.28e-02 | 34 |
| Page: 1 |
Top |
Cell-cell communication analysis |
| Identification of potential cell-cell interactions between two cell types and their ligand-receptor pairs for different disease states |
| Ligand | Receptor | LRpair | Pathway | Tissue | Disease Stage |
| Page: 1 |
Top |
Single-cell gene regulatory network inference analysis |
| Find out the significant the regulons (TFs) and the target genes of each regulon across cell types for different disease states |
| TF | Cell Type | Tissue | Disease Stage | Target Gene | RSS | Regulon Activity |
| ∗The dot plots of a searched regulon are shown for all cell subpopulations in each disease state of each tissue based on the regulon specific score inferred using pySCENIC and by calculating the average expression. |
| Page: 1 |
Top |
Somatic mutation of malignant transformation related genes |
| Annotation of somatic variants for genes involved in malignant transformation |
| Hugo Symbol | Variant Class | Variant Classification | dbSNP RS | HGVSc | HGVSp | HGVSp Short | SWISSPROT | BIOTYPE | SIFT | PolyPhen | Tumor Sample Barcode | Tissue | Histology | Sex | Age | Stage | Therapy Types | Drugs | Outcome |
| RICTOR | SNV | Missense_Mutation | novel | c.4426C>T | p.Pro1476Ser | p.P1476S | Q6R327 | protein_coding | tolerated(0.23) | benign(0.031) | TCGA-5L-AAT0-01 | Breast | breast invasive carcinoma | Female | <65 | I/II | Hormone Therapy | tamoxiphen | SD |
| RICTOR | SNV | Missense_Mutation | novel | c.1259N>T | p.Ser420Leu | p.S420L | Q6R327 | protein_coding | deleterious(0.04) | benign(0.055) | TCGA-5L-AAT1-01 | Breast | breast invasive carcinoma | Female | <65 | III/IV | Hormone Therapy | letrozol | SD |
| RICTOR | SNV | Missense_Mutation | c.2270N>T | p.Thr757Ile | p.T757I | Q6R327 | protein_coding | deleterious(0) | possibly_damaging(0.506) | TCGA-A8-A07G-01 | Breast | breast invasive carcinoma | Female | >=65 | I/II | Chemotherapy | 5-fluorouracil | CR | |
| RICTOR | SNV | Missense_Mutation | c.4292N>T | p.Ser1431Phe | p.S1431F | Q6R327 | protein_coding | deleterious(0.01) | probably_damaging(0.994) | TCGA-AC-A23H-01 | Breast | breast invasive carcinoma | Female | >=65 | I/II | Unknown | Unknown | PD | |
| RICTOR | SNV | Missense_Mutation | novel | c.604N>T | p.Val202Leu | p.V202L | Q6R327 | protein_coding | tolerated(0.1) | benign(0.028) | TCGA-AC-A3EH-01 | Breast | breast invasive carcinoma | Female | >=65 | III/IV | Unknown | Unknown | SD |
| RICTOR | SNV | Missense_Mutation | c.545N>C | p.Arg182Thr | p.R182T | Q6R327 | protein_coding | deleterious(0) | probably_damaging(0.985) | TCGA-BH-A0HA-01 | Breast | breast invasive carcinoma | Female | <65 | I/II | Unknown | Unknown | SD | |
| RICTOR | SNV | Missense_Mutation | c.3665N>T | p.Thr1222Ile | p.T1222I | Q6R327 | protein_coding | deleterious(0) | probably_damaging(0.996) | TCGA-BH-A0HF-01 | Breast | breast invasive carcinoma | Female | >=65 | I/II | Hormone Therapy | arimidex | SD | |
| RICTOR | SNV | Missense_Mutation | rs778788008 | c.301G>A | p.Ala101Thr | p.A101T | Q6R327 | protein_coding | tolerated(0.07) | probably_damaging(0.993) | TCGA-BH-A0HY-01 | Breast | breast invasive carcinoma | Female | <65 | I/II | Hormone Therapy | taxotere | CR |
| RICTOR | SNV | Missense_Mutation | c.4882N>A | p.Asp1628Asn | p.D1628N | Q6R327 | protein_coding | deleterious(0.01) | probably_damaging(0.993) | TCGA-BH-A1EV-01 | Breast | breast invasive carcinoma | Female | <65 | III/IV | Unknown | Unknown | PD | |
| RICTOR | SNV | Missense_Mutation | c.2425N>T | p.Leu809Phe | p.L809F | Q6R327 | protein_coding | deleterious(0.01) | possibly_damaging(0.747) | TCGA-D8-A1JA-01 | Breast | breast invasive carcinoma | Female | <65 | III/IV | Chemotherapy | adriamycin | PD |
| Page: 1 2 3 4 5 6 7 8 9 10 11 12 13 14 15 16 17 18 |
Top |
Related drugs of malignant transformation related genes |
| Identification of chemicals and drugs interact with genes involved in malignant transfromation |
| (DGIdb 4.0) |
| Entrez ID | Symbol | Category | Interaction Types | Drug Claim Name | Drug Name | PMIDs |
| 253260 | RICTOR | CLINICALLY ACTIONABLE | inhibitor | MLN0128 | SAPANISERTIB | |
| 253260 | RICTOR | CLINICALLY ACTIONABLE | inhibitor | OSI-027 | OSI-027 | |
| 253260 | RICTOR | CLINICALLY ACTIONABLE | inhibitor | AZD8055 | AZD-8055 | |
| 253260 | RICTOR | CLINICALLY ACTIONABLE | VISTUSERTIB | VISTUSERTIB | 28028034 |
| Page: 1 |

Copyright 2023-Present -The University of Texas Health Science Center at Houston |