Schematic overview of the cellular and molecular mechanisms involved in the cancer progression, including the proposed cellular and molecular mechanisms in cancer cells trajectory. AT1: alveolar type 1 cells; AT2: alveolar type 2 cells; AAH: atypical adenomatous hyperplasia; AIS: adenocarcinoma in situ; MIA: minimally invasive adenocarcinoma; IA: invasive adenocarcinoma; EMT: epithelial-mesenchymal transition

Home

Download

Statistics

Help

Contact

Center for Computational Systems Medicine
leaf

Gene summary

leaf

Malignant transformation analysis

leaf

Malignant transformation related pathway analysis

leaf

Cell-cell communication analysis

leaf

Single-cell gene regulatory network inference analysis

leaf

Somatic mutation of malignant transformation related genes

leaf

Related drugs of malignant transformation related genes

Gene: PRDX3

Gene summary for PRDX3

check button Gene summary.

Gene informationSpeciesHuman
Gene symbol

PRDX3

Gene ID

10935

Gene nameperoxiredoxin 3
Gene AliasAOP-1
Cytomap10q26.11
Gene Typeprotein-coding
GO ID

GO:0000003

UniProtAcc

P30048


Top

Malignant transformation analysis

check button Identification of the aberrant gene expression in precancerous and cancerous lesions by comparing the gene expression of stem-like cells in diseased tissues with normal stem cells
check button Malignant transformation involving gene list.
Entrez IDSymbolReplicatesSpeciesOrganTissueAdj P-valueLog2FCMalignancy
10935PRDX3HTA11_1938_2000001011HumanColorectumAD6.49e-096.01e-01-0.0811
10935PRDX3HTA11_78_2000001011HumanColorectumAD1.02e-053.19e-01-0.1088
10935PRDX3HTA11_347_2000001011HumanColorectumAD1.02e-103.72e-01-0.1954
10935PRDX3HTA11_696_2000001011HumanColorectumAD1.41e-021.70e-01-0.1464
10935PRDX3HTA11_1391_2000001011HumanColorectumAD2.21e-033.28e-01-0.059
10935PRDX3HTA11_7862_2000001011HumanColorectumAD1.55e-044.17e-01-0.0179
10935PRDX3HTA11_866_3004761011HumanColorectumAD7.05e-083.83e-010.096
10935PRDX3HTA11_4255_2000001011HumanColorectumSER6.14e-065.64e-010.0446
10935PRDX3HTA11_8622_2000001021HumanColorectumSER4.38e-023.56e-010.0528
10935PRDX3HTA11_6801_2000001011HumanColorectumSER4.51e-129.89e-010.0171
10935PRDX3HTA11_7696_3000711011HumanColorectumAD2.75e-082.53e-010.0674
10935PRDX3HTA11_7469_2000001011HumanColorectumAD3.77e-046.06e-01-0.0124
10935PRDX3HTA11_6818_2000001021HumanColorectumAD3.33e-053.00e-010.0588
10935PRDX3HTA11_99999970781_79442HumanColorectumMSS8.78e-296.97e-010.294
10935PRDX3HTA11_99999965062_69753HumanColorectumMSI-H1.16e-051.04e+000.3487
10935PRDX3HTA11_99999965104_69814HumanColorectumMSS3.99e-125.90e-010.281
10935PRDX3HTA11_99999971662_82457HumanColorectumMSS1.17e-175.71e-010.3859
10935PRDX3HTA11_99999974143_84620HumanColorectumMSS2.03e-032.35e-010.3005
10935PRDX3AEH-subject1HumanEndometriumAEH4.90e-06-2.75e-01-0.3059
10935PRDX3AEH-subject2HumanEndometriumAEH1.50e-08-2.73e-01-0.2525
Page: 1 2 3 4 5 6 7 8 9 

check button Transcriptomic changes along malignancy continuum.
TissueExpression DynamicsAbbreviation
Colorectum (GSE201348)The image shows the transcriptomic changes along malignancy continuum.log2FC in expression of this searched gene in stem-like cells from each diseased tissue sample relative to stem-like cells in normal samples in each tissue plotted against the malignancy continuum. Samples are colored based on if they are from different disease stage.FAP: Familial adenomatous polyposis
CRC: Colorectal cancer
Colorectum (HTA11)The image shows the transcriptomic changes along malignancy continuum.log2FC in expression of this searched gene in stem-like cells from each diseased tissue sample relative to stem-like cells in normal samples in each tissue plotted against the malignancy continuum. Samples are colored based on if they are from different disease stage.AD: Adenomas
SER: Sessile serrated lesions
MSI-H: Microsatellite-high colorectal cancer
MSS: Microsatellite stable colorectal cancer
EndometriumThe image shows the transcriptomic changes along malignancy continuum.log2FC in expression of this searched gene in stem-like cells from each diseased tissue sample relative to stem-like cells in normal samples in each tissue plotted against the malignancy continuum. Samples are colored based on if they are from different disease stage.
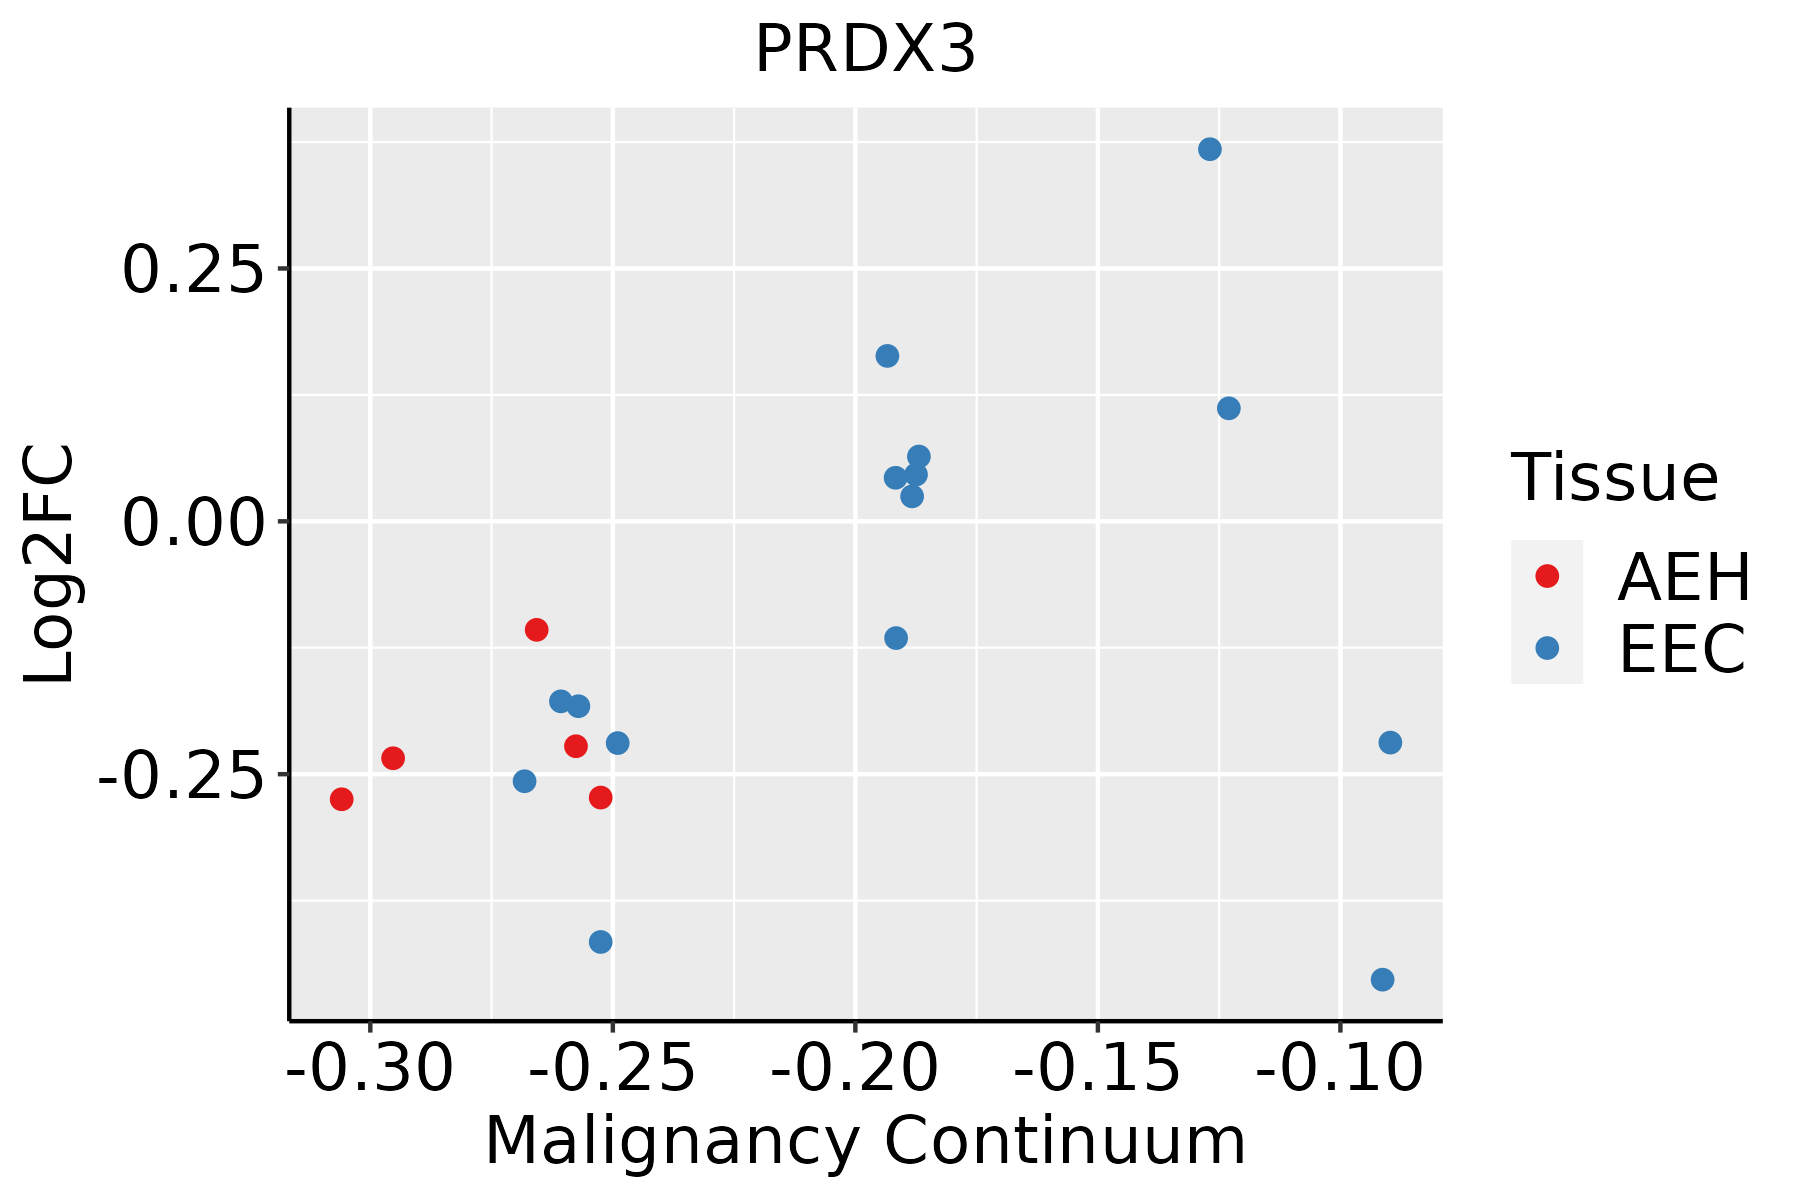
AEH: Atypical endometrial hyperplasia
EEC: Endometrioid Cancer
EsophagusThe image shows the transcriptomic changes along malignancy continuum.log2FC in expression of this searched gene in stem-like cells from each diseased tissue sample relative to stem-like cells in normal samples in each tissue plotted against the malignancy continuum. Samples are colored based on if they are from different disease stage.
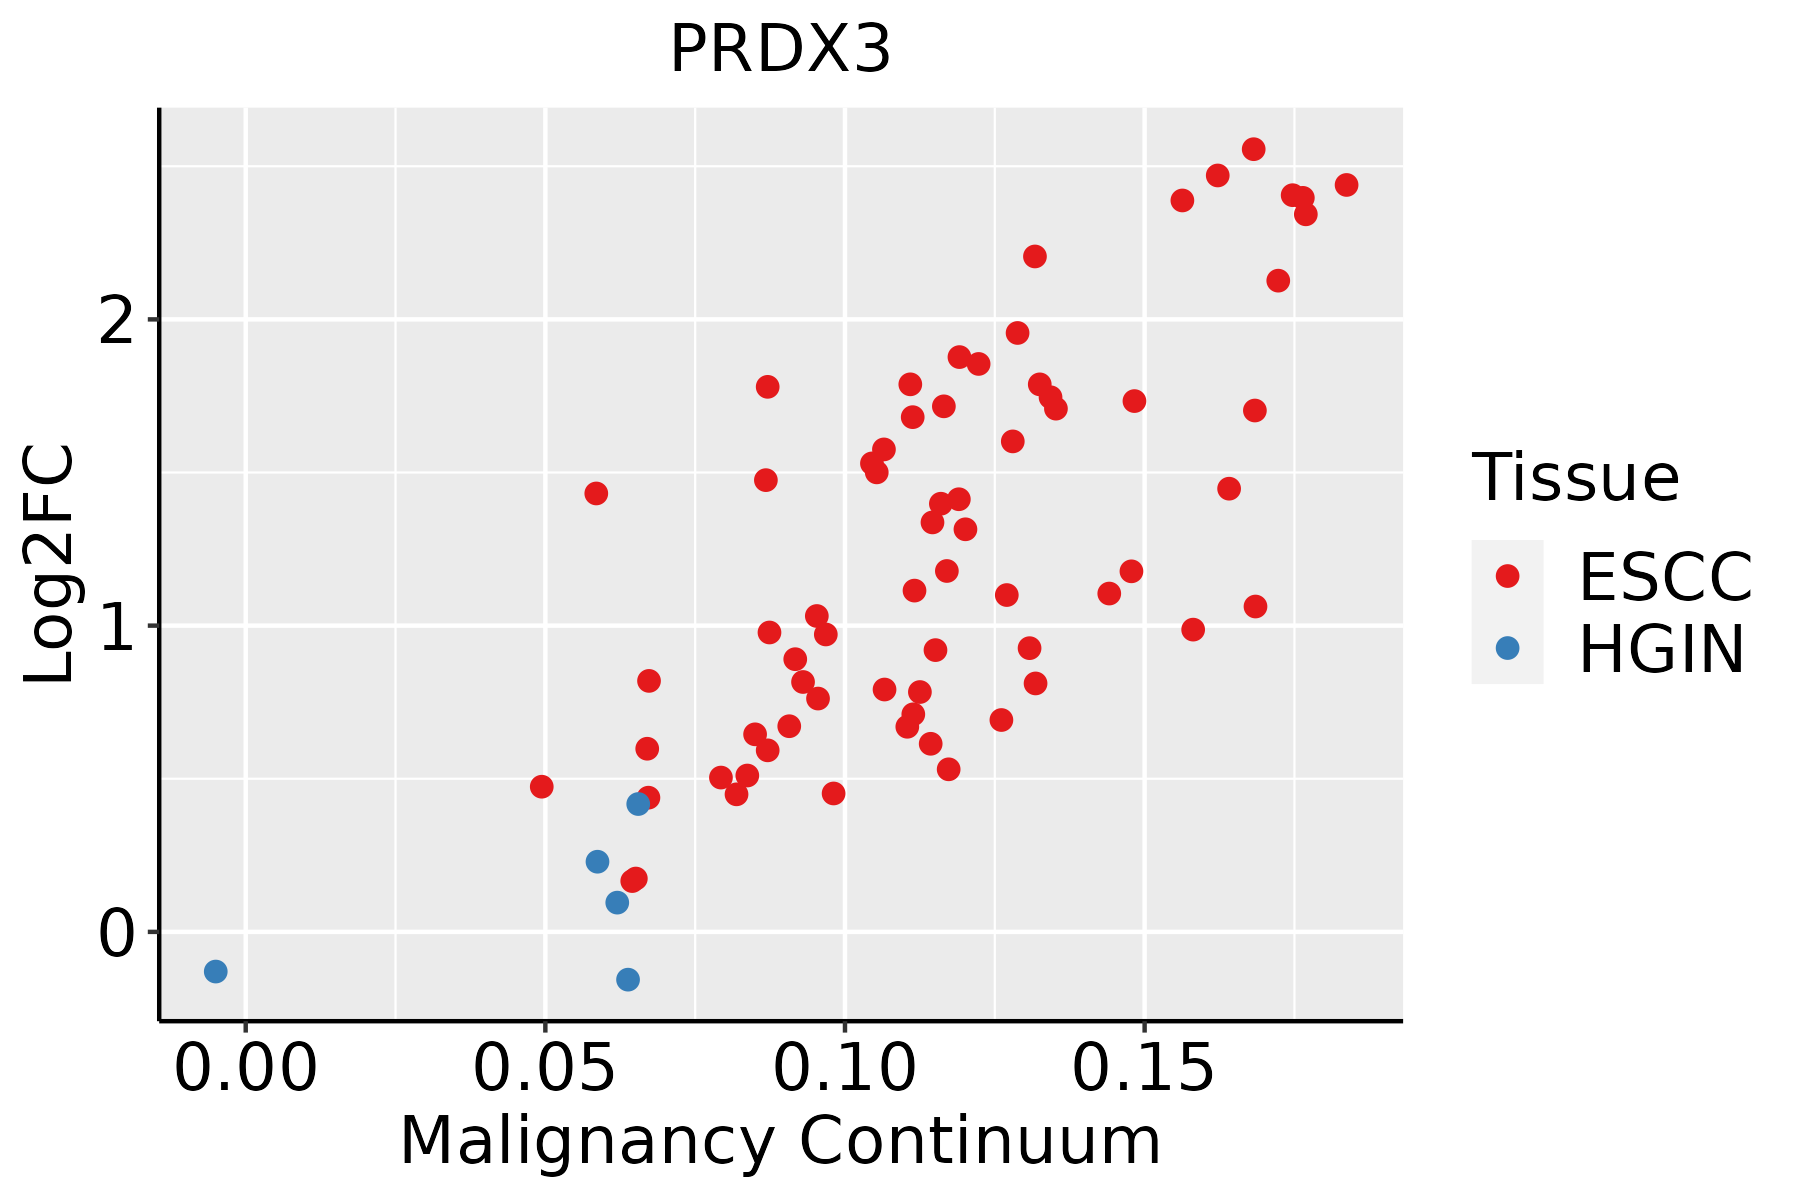
ESCC: Esophageal squamous cell carcinoma
HGIN: High-grade intraepithelial neoplasias
LGIN: Low-grade intraepithelial neoplasias
LiverThe image shows the transcriptomic changes along malignancy continuum.log2FC in expression of this searched gene in stem-like cells from each diseased tissue sample relative to stem-like cells in normal samples in each tissue plotted against the malignancy continuum. Samples are colored based on if they are from different disease stage.
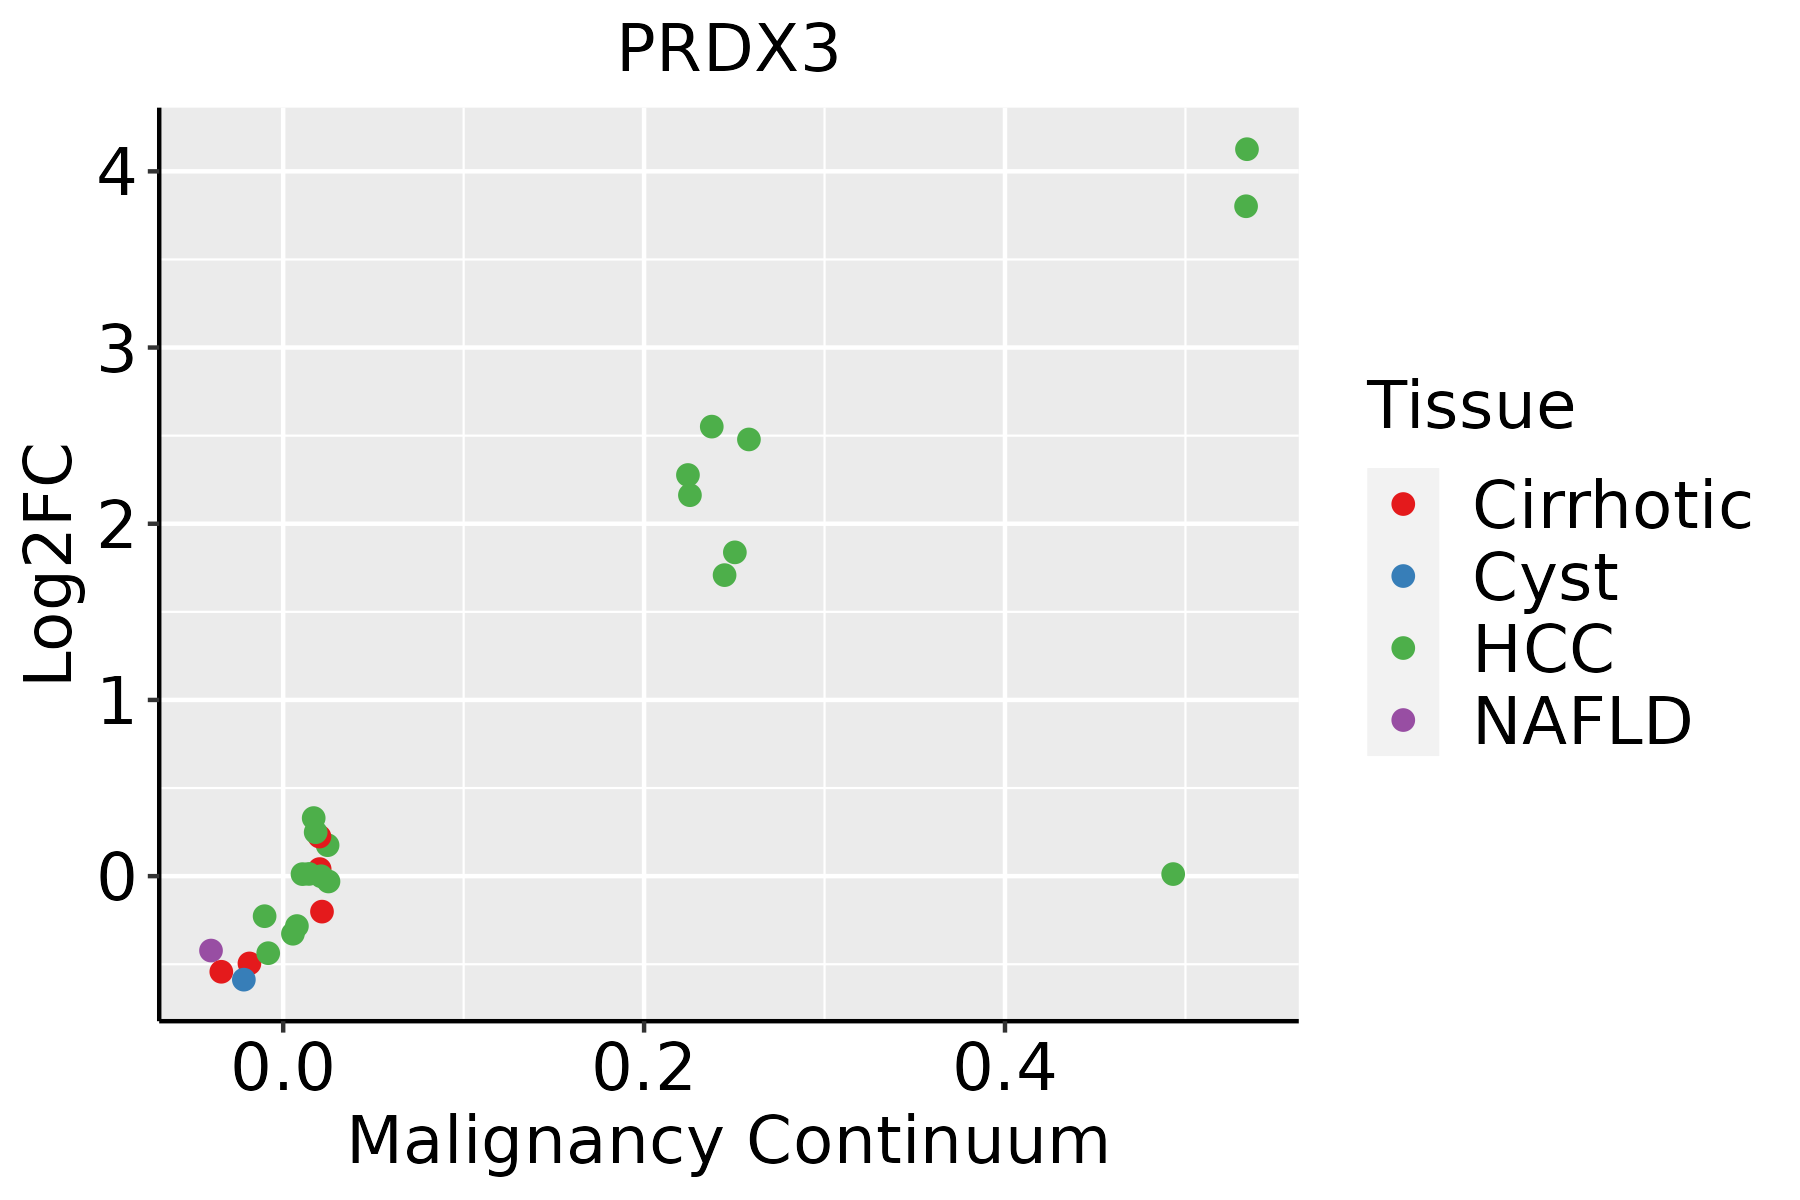
HCC: Hepatocellular carcinoma
NAFLD: Non-alcoholic fatty liver disease
Oral CavityThe image shows the transcriptomic changes along malignancy continuum.log2FC in expression of this searched gene in stem-like cells from each diseased tissue sample relative to stem-like cells in normal samples in each tissue plotted against the malignancy continuum. Samples are colored based on if they are from different disease stage.
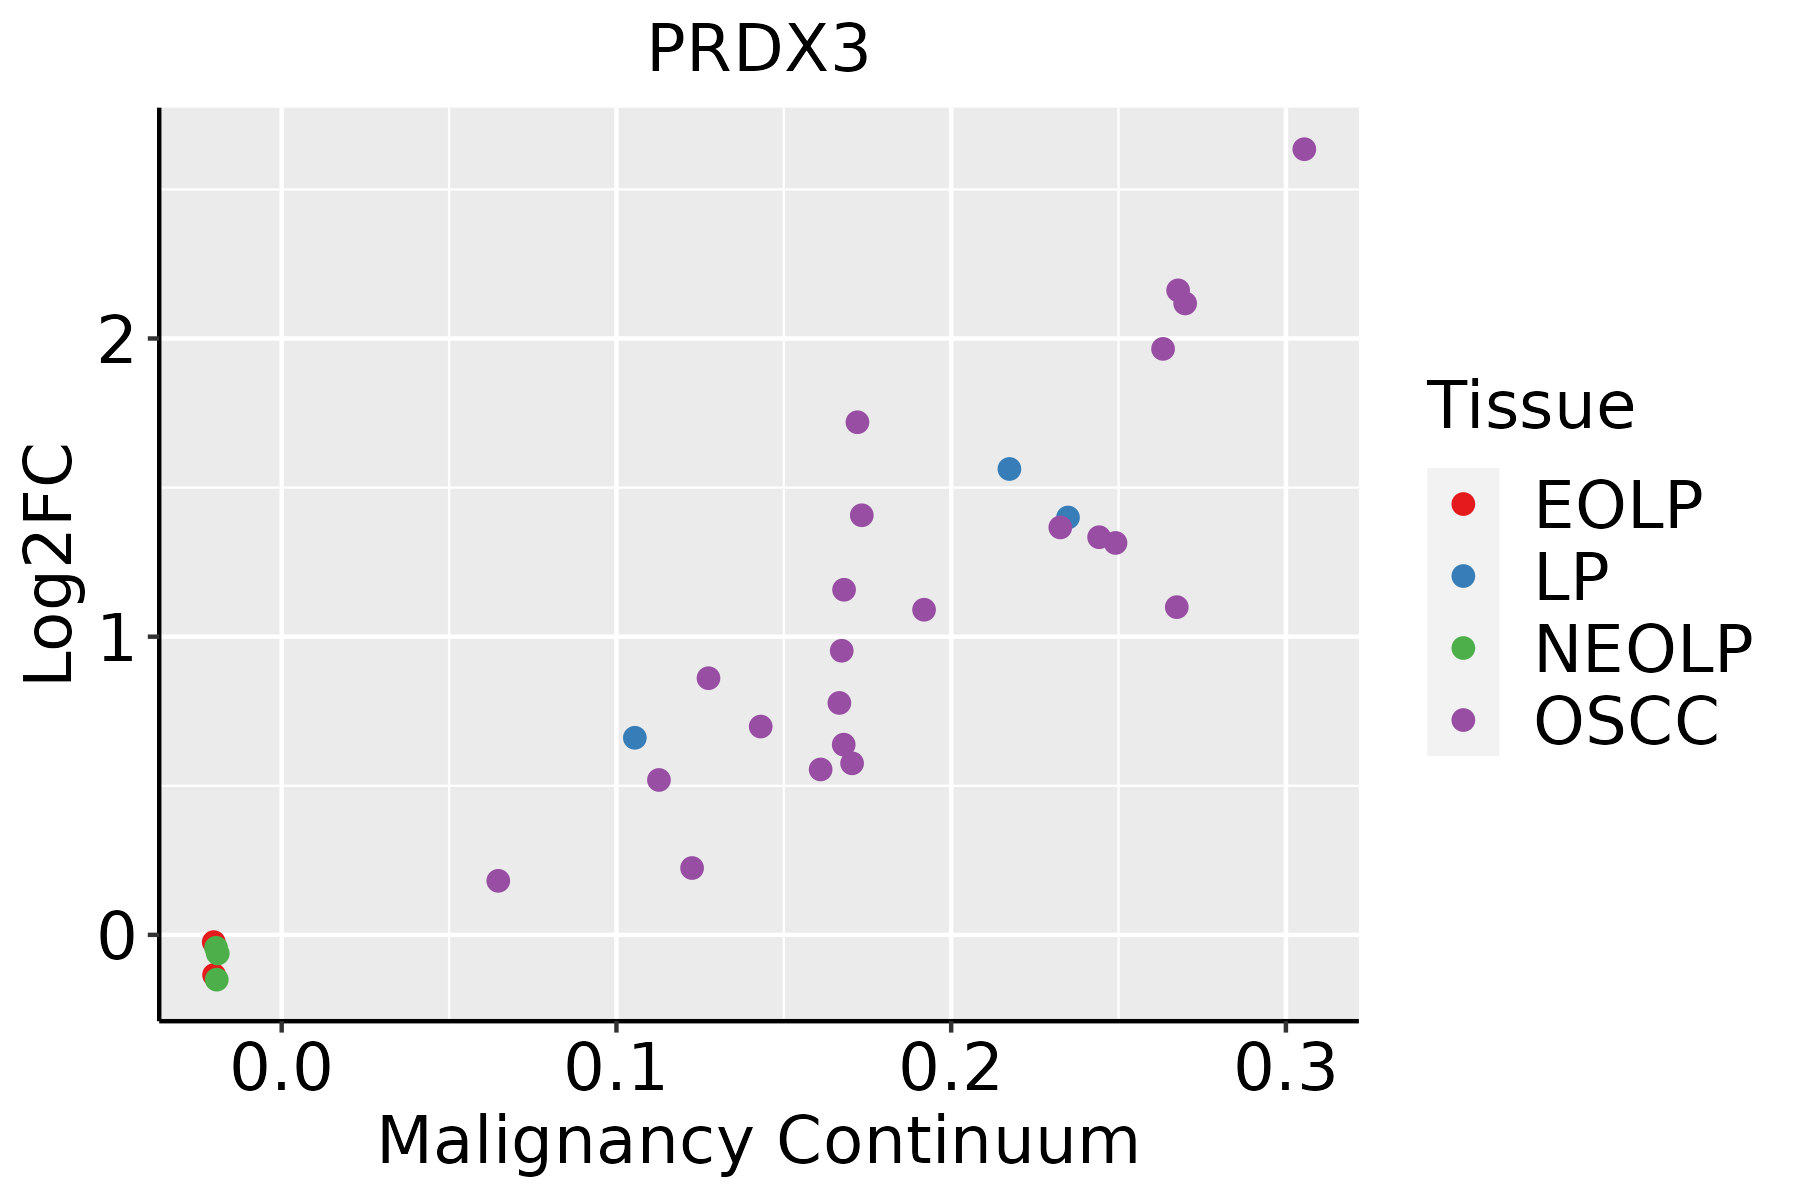
EOLP: Erosive Oral lichen planus
LP: leukoplakia
NEOLP: Non-erosive oral lichen planus
OSCC: Oral squamous cell carcinoma
ProstateThe image shows the transcriptomic changes along malignancy continuum.log2FC in expression of this searched gene in stem-like cells from each diseased tissue sample relative to stem-like cells in normal samples in each tissue plotted against the malignancy continuum. Samples are colored based on if they are from different disease stage.BPH: Benign Prostatic Hyperplasia
SkinThe image shows the transcriptomic changes along malignancy continuum.log2FC in expression of this searched gene in stem-like cells from each diseased tissue sample relative to stem-like cells in normal samples in each tissue plotted against the malignancy continuum. Samples are colored based on if they are from different disease stage.
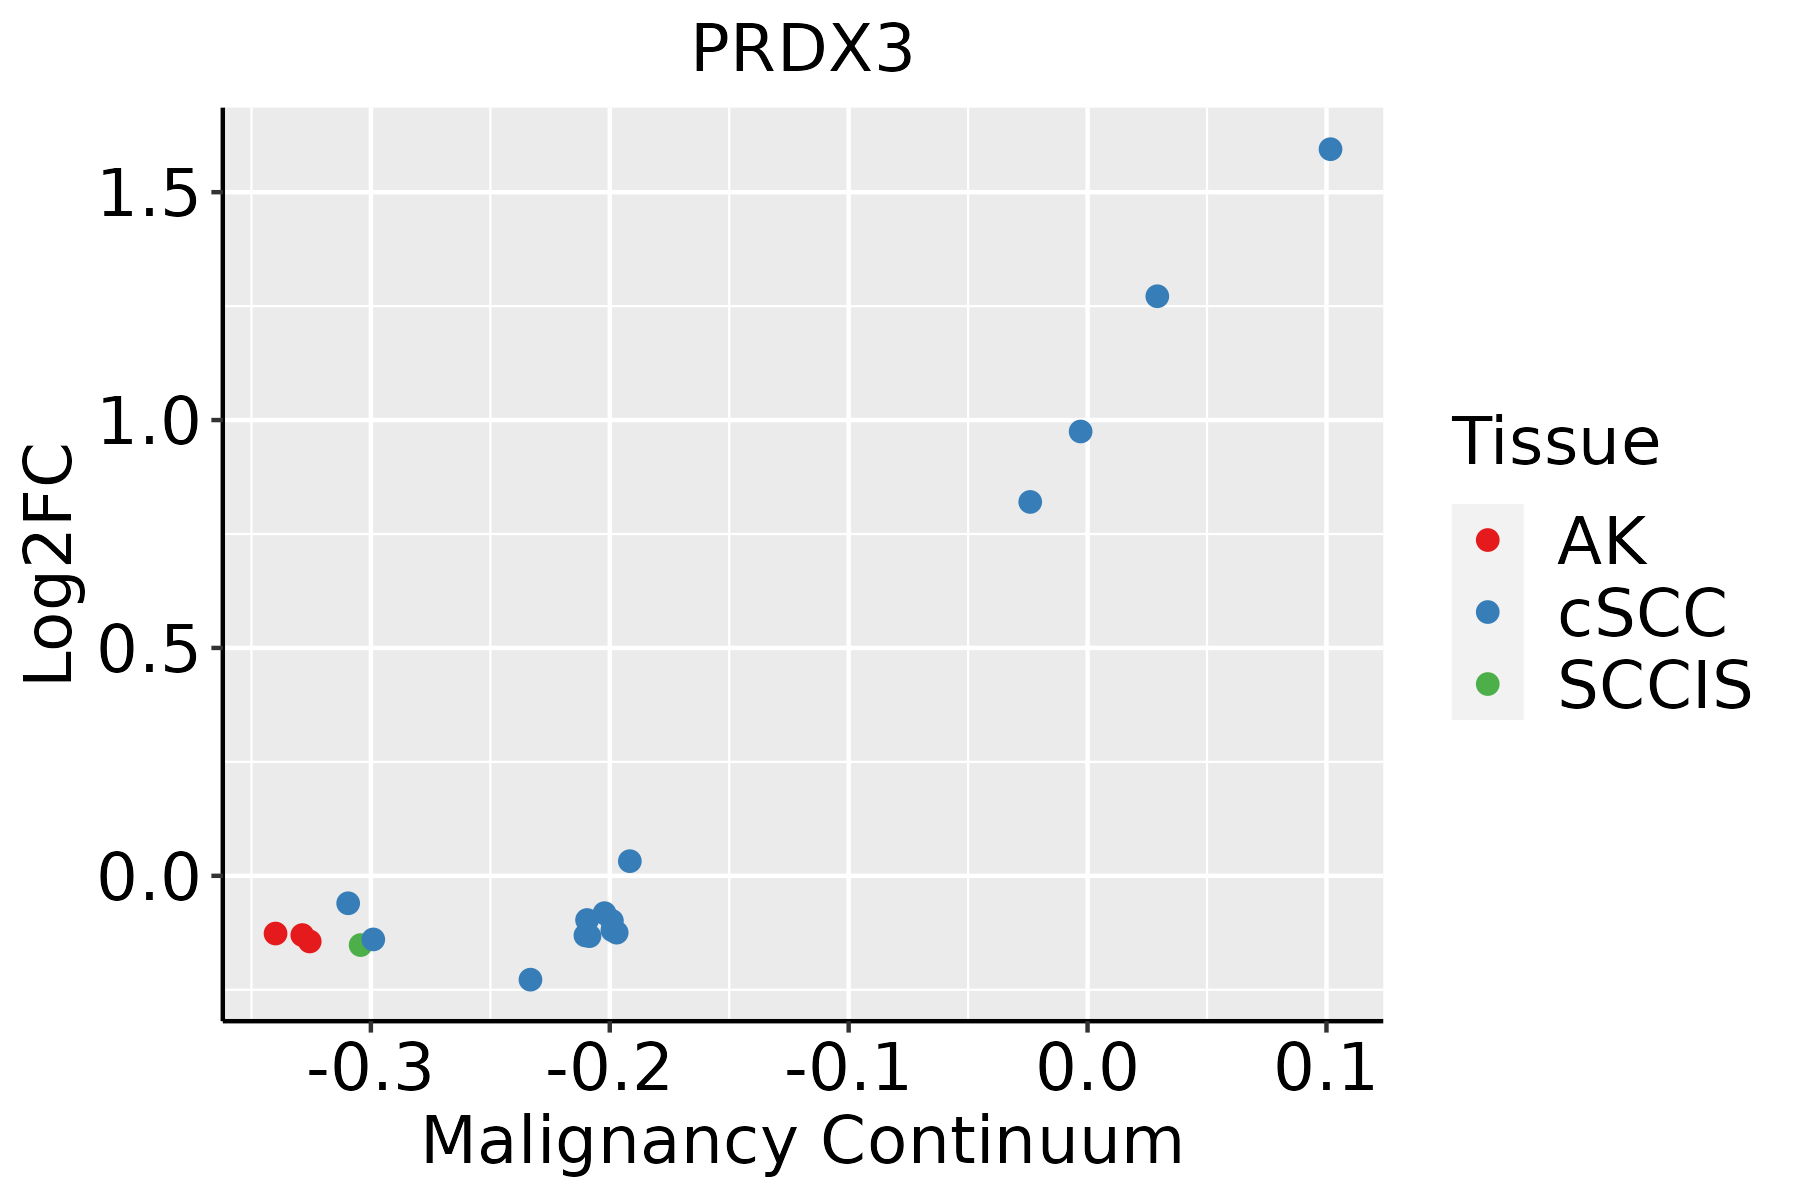
AK: Actinic keratosis
cSCC: Cutaneous squamous cell carcinoma
SCCIS:squamous cell carcinoma in situ
ThyroidThe image shows the transcriptomic changes along malignancy continuum.log2FC in expression of this searched gene in stem-like cells from each diseased tissue sample relative to stem-like cells in normal samples in each tissue plotted against the malignancy continuum. Samples are colored based on if they are from different disease stage.ATC: Anaplastic thyroid cancer
HT: Hashimoto's thyroiditis
PTC: Papillary thyroid cancer
∗log2FC in expression of this searched gene in stem-like cells from each diseased tissue sample relative to stem-like cells in normal samples in each tissue plotted against the malignancy continuum. Samples are colored based on if they are from different disease stage.

Top

Malignant transformation related pathway analysis

check buttonFind out the enriched GO biological processes and KEGG pathways involved in transition from healthy to precancer to cancer
check button Figure of enriched GO biological processes.
TissueDisease StageEnriched GO biological Processes
ColorectumADGO analysis - Figure of enriched GO biological processes: Top 15 enriched GO BP terms are showed in the bar plot of each disease state in each tissue. Each row represents a significant GO biological process which is colored according to the -log10(p.adjust).
ColorectumSERGO analysis - Figure of enriched GO biological processes: Top 15 enriched GO BP terms are showed in the bar plot of each disease state in each tissue. Each row represents a significant GO biological process which is colored according to the -log10(p.adjust).
ColorectumMSSGO analysis - Figure of enriched GO biological processes: Top 15 enriched GO BP terms are showed in the bar plot of each disease state in each tissue. Each row represents a significant GO biological process which is colored according to the -log10(p.adjust).
ColorectumMSI-HGO analysis - Figure of enriched GO biological processes: Top 15 enriched GO BP terms are showed in the bar plot of each disease state in each tissue. Each row represents a significant GO biological process which is colored according to the -log10(p.adjust).
ColorectumFAPGO analysis - Figure of enriched GO biological processes: Top 15 enriched GO BP terms are showed in the bar plot of each disease state in each tissue. Each row represents a significant GO biological process which is colored according to the -log10(p.adjust).
∗Top 15 enriched GO BP terms are showed in the bar plot of each disease state in each tissue. Each row represents a significant GO biological process which is colored according to the -log10(p.adjust).
Page: 1 2 3 4 5 6 7 8 9 

check button Enriched GO biological processes.
GO IDTissueDisease StageDescriptionGene RatioBg Ratiopvaluep.adjustCount
GO:00447067Oral cavityOSCCmulti-multicellular organism process105/7305220/187235.05e-031.97e-02105
GO:009875418Oral cavityOSCCdetoxification75/7305152/187235.99e-032.28e-0275
GO:0006979110Oral cavityLPresponse to oxidative stress181/4623446/187235.74e-146.10e-12181
GO:2000116110Oral cavityLPregulation of cysteine-type endopeptidase activity109/4623235/187233.16e-132.91e-11109
GO:0043281110Oral cavityLPregulation of cysteine-type endopeptidase activity involved in apoptotic process99/4623209/187237.89e-136.68e-1199
GO:0052547110Oral cavityLPregulation of peptidase activity177/4623461/187233.01e-112.00e-09177
GO:0052548110Oral cavityLPregulation of endopeptidase activity164/4623432/187234.33e-102.20e-08164
GO:0000302110Oral cavityLPresponse to reactive oxygen species95/4623222/187232.23e-099.98e-0895
GO:0042542110Oral cavityLPresponse to hydrogen peroxide68/4623146/187236.95e-092.81e-0768
GO:004315418Oral cavityLPnegative regulation of cysteine-type endopeptidase activity involved in apoptotic process43/462378/187238.35e-093.31e-0743
GO:0062197110Oral cavityLPcellular response to chemical stress130/4623337/187238.94e-093.52e-07130
GO:200011719Oral cavityLPnegative regulation of cysteine-type endopeptidase activity46/462386/187239.22e-093.61e-0746
GO:0051348110Oral cavityLPnegative regulation of transferase activity106/4623268/187234.60e-081.61e-06106
GO:0034599110Oral cavityLPcellular response to oxidative stress110/4623288/187232.19e-076.65e-06110
GO:0010563110Oral cavityLPnegative regulation of phosphorus metabolic process153/4623442/187231.47e-063.53e-05153
GO:0045936110Oral cavityLPnegative regulation of phosphate metabolic process152/4623441/187232.10e-064.77e-05152
GO:005188116Oral cavityLPregulation of mitochondrial membrane potential36/462374/187236.85e-061.34e-0436
GO:0045861110Oral cavityLPnegative regulation of proteolysis122/4623351/187231.32e-052.34e-04122
GO:005109213Oral cavityLPpositive regulation of NF-kappaB transcription factor activity61/4623152/187231.82e-053.11e-0461
GO:0030099110Oral cavityLPmyeloid cell differentiation130/4623381/187231.94e-053.27e-04130
Page: 1 2 3 4 5 6 7 8 9 10 11 12 13 14 15 16 17 18 19 20 21 22 23 24 25 26 27 28 29 30 31 32 

check button Enriched KEGG pathways.
Pathway IDTissueDisease StageDescriptionGene RatioBg Ratiopvaluep.adjustqvalueCount
Page: 1 

Top

Cell-cell communication analysis

check buttonIdentification of potential cell-cell interactions between two cell types and their ligand-receptor pairs for different disease states
LigandReceptorLRpairPathwayTissueDisease Stage
Page: 1 

Top

Single-cell gene regulatory network inference analysis

check buttonFind out the significant the regulons (TFs) and the target genes of each regulon across cell types for different disease states
TFCell TypeTissueDisease StageTarget GeneRSSRegulon Activity
∗The dot plots of a searched regulon are shown for all cell subpopulations in each disease state of each tissue based on the regulon specific score inferred using pySCENIC and by calculating the average expression.
Page: 1 

Top

Somatic mutation of malignant transformation related genes

check buttonAnnotation of somatic variants for genes involved in malignant transformation
Hugo SymbolVariant ClassVariant ClassificationdbSNP RSHGVScHGVSpHGVSp ShortSWISSPROTBIOTYPESIFTPolyPhenTumor Sample BarcodeTissueHistologySexAgeStageTherapy TypesDrugsOutcome
PRDX3SNVMissense_Mutationrs548327727c.604N>Ap.Asp202Asnp.D202NP30048protein_codingdeleterious(0.03)probably_damaging(0.994)TCGA-AN-A046-01Breastbreast invasive carcinomaFemale>=65I/IIUnknownUnknownSD
PRDX3SNVMissense_Mutationc.301N>Tp.Pro101Serp.P101SP30048protein_codingdeleterious(0)probably_damaging(0.998)TCGA-CK-4951-01Colorectumcolon adenocarcinomaFemale>=65I/IIUnknownUnknownPD
PRDX3SNVMissense_Mutationrs548327727c.604G>Ap.Asp202Asnp.D202NP30048protein_codingdeleterious(0.03)probably_damaging(0.994)TCGA-AX-A2HC-01Endometriumuterine corpus endometrioid carcinomaFemale<65III/IVChemotherapypaclitaxelPD
PRDX3SNVMissense_Mutationrs751585321c.640C>Tp.Arg214Cysp.R214CP30048protein_codingdeleterious(0.04)benign(0.074)TCGA-B5-A0JZ-01Endometriumuterine corpus endometrioid carcinomaFemale<65III/IVChemotherapycarboplatinPD
PRDX3SNVMissense_Mutationrs779344159c.361G>Ap.Glu121Lysp.E121KP30048protein_codingtolerated(0.11)possibly_damaging(0.79)TCGA-BS-A0UF-01Endometriumuterine corpus endometrioid carcinomaFemale>=65I/IIUnknownUnknownSD
PRDX3SNVMissense_Mutationnovelc.223N>Gp.Thr75Alap.T75AP30048protein_codingdeleterious(0.02)possibly_damaging(0.878)TCGA-D1-A1NY-01Endometriumuterine corpus endometrioid carcinomaFemale>=65I/IIChemotherapycarboplatinSD
PRDX3SNVMissense_Mutationnovelc.443G>Tp.Arg148Ilep.R148IP30048protein_codingdeleterious(0)possibly_damaging(0.859)TCGA-E6-A1LX-01Endometriumuterine corpus endometrioid carcinomaFemale<65I/IIUnknownUnknownSD
PRDX3SNVMissense_Mutationnovelc.221N>Ap.Gly74Aspp.G74DP30048protein_codingdeleterious(0.03)probably_damaging(0.993)TCGA-E6-A2P9-01Endometriumuterine corpus endometrioid carcinomaFemale>=65I/IIUnknownUnknownSD
PRDX3SNVMissense_Mutationrs772428160c.128N>Cp.Leu43Serp.L43SP30048protein_codingtolerated(0.21)benign(0.013)TCGA-EO-A3AY-01Endometriumuterine corpus endometrioid carcinomaFemale<65I/IIUnknownUnknownPD
PRDX3SNVMissense_Mutationnovelc.541C>Ap.Leu181Ilep.L181IP30048protein_codingtolerated(1)benign(0.005)TCGA-FI-A2D5-01Endometriumuterine corpus endometrioid carcinomaFemale<65III/IVChemotherapycarboplatinumPD
Page: 1 2 

Top

Related drugs of malignant transformation related genes

check buttonIdentification of chemicals and drugs interact with genes involved in malignant transfromation
(DGIdb 4.0)
Entrez IDSymbolCategoryInteraction TypesDrug Claim NameDrug NamePMIDs
Page: 1