
|
|||||
|
 | |
| |
| |
| |
| |
| |
|
Gene: NAT1 |
Gene summary for NAT1 |
| Gene information | Species | Human | Gene symbol | NAT1 | Gene ID | 9 |
| Gene name | N-acetyltransferase 1 | |
| Gene Alias | AAC1 | |
| Cytomap | 8p22 | |
| Gene Type | protein-coding | GO ID | GO:0006805 | UniProtAcc | P18440 |
Top |
Malignant transformation analysis |
| Identification of the aberrant gene expression in precancerous and cancerous lesions by comparing the gene expression of stem-like cells in diseased tissues with normal stem cells |
| Entrez ID | Symbol | Replicates | Species | Organ | Tissue | Adj P-value | Log2FC | Malignancy |
| 9 | NAT1 | GSM4909293 | Human | Breast | IDC | 2.14e-20 | 2.94e-01 | 0.1581 |
| 9 | NAT1 | GSM4909301 | Human | Breast | IDC | 1.08e-04 | 1.77e-01 | 0.1577 |
| 9 | NAT1 | GSM4909302 | Human | Breast | IDC | 2.03e-04 | 2.38e-01 | 0.1545 |
| 9 | NAT1 | GSM4909307 | Human | Breast | IDC | 6.51e-27 | 5.45e-01 | 0.1569 |
| 9 | NAT1 | GSM4909308 | Human | Breast | IDC | 5.04e-70 | 9.70e-01 | 0.158 |
| 9 | NAT1 | GSM4909317 | Human | Breast | IDC | 7.99e-15 | 3.46e-01 | 0.1355 |
| 9 | NAT1 | GSM4909318 | Human | Breast | IDC | 3.03e-07 | 6.66e-01 | 0.2031 |
| 9 | NAT1 | GSM4909321 | Human | Breast | IDC | 5.62e-10 | 4.10e-01 | 0.1559 |
| 9 | NAT1 | NCCBC11 | Human | Breast | DCIS | 1.04e-06 | 6.00e-01 | 0.1232 |
| 9 | NAT1 | NCCBC3 | Human | Breast | DCIS | 2.50e-23 | 5.17e-01 | 0.1198 |
| 9 | NAT1 | P3 | Human | Breast | IDC | 6.97e-04 | 3.71e-01 | 0.1542 |
| Page: 1 |
| Tissue | Expression Dynamics | Abbreviation |
| Breast | 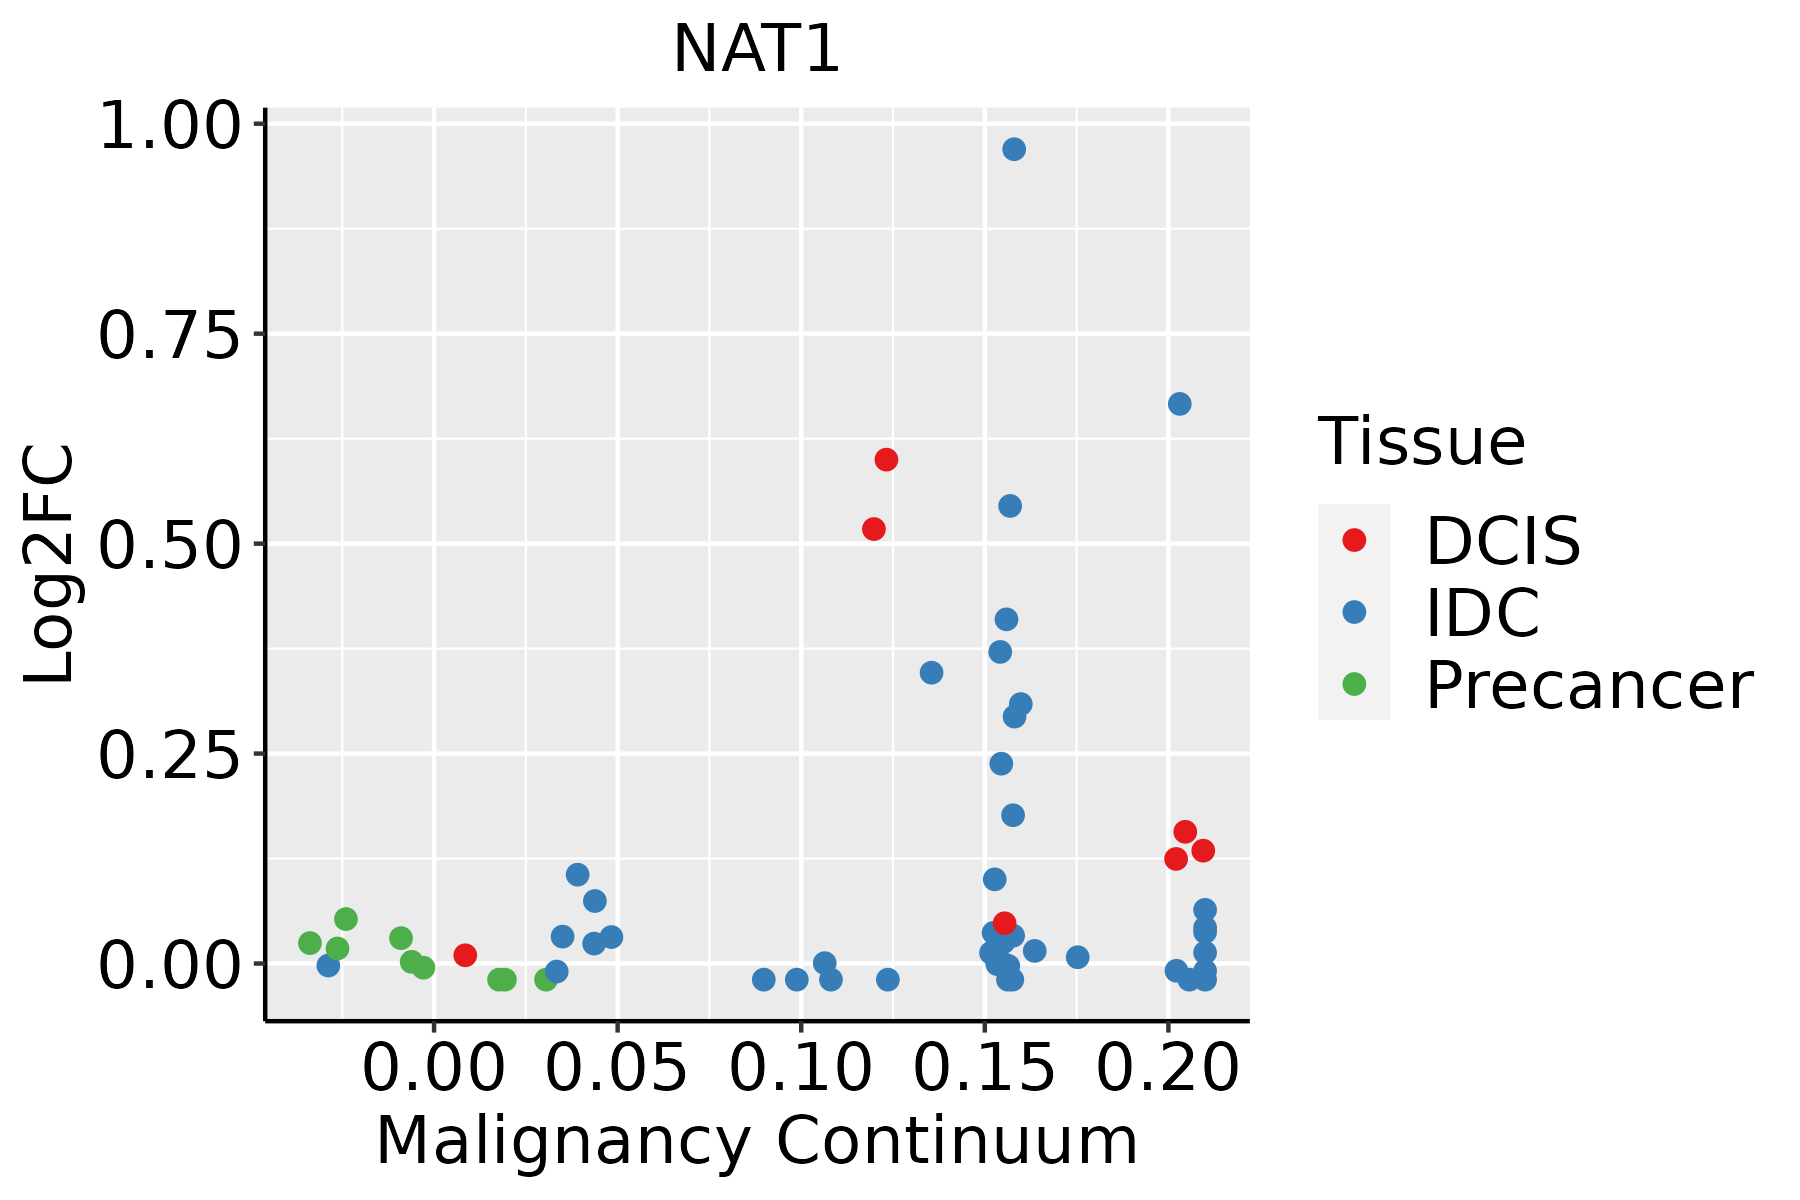 | IDC: Invasive ductal carcinoma |
| DCIS: Ductal carcinoma in situ | ||
| Precancer(BRCA1-mut): Precancerous lesion from BRCA1 mutation carriers |
| ∗log2FC in expression of this searched gene in stem-like cells from each diseased tissue sample relative to stem-like cells in normal samples in each tissue plotted against the malignancy continuum. Samples are colored based on if they are from different disease stage. |
Top |
Malignant transformation related pathway analysis |
| Find out the enriched GO biological processes and KEGG pathways involved in transition from healthy to precancer to cancer |
| Tissue | Disease Stage | Enriched GO biological Processes |
| Colorectum | AD |  |
| Colorectum | SER |  |
| Colorectum | MSS |  |
| Colorectum | MSI-H |  |
| Colorectum | FAP |  |
| ∗Top 15 enriched GO BP terms are showed in the bar plot of each disease state in each tissue. Each row represents a significant GO biological process which is colored according to the -log10(p.adjust). |
| Page: 1 2 3 4 5 6 7 8 9 |
| GO ID | Tissue | Disease Stage | Description | Gene Ratio | Bg Ratio | pvalue | p.adjust | Count |
| GO:00330024 | Oral cavity | OSCC | muscle cell proliferation | 115/7305 | 248/18723 | 1.05e-02 | 3.58e-02 | 115 |
| GO:0006040 | Oral cavity | OSCC | amino sugar metabolic process | 24/7305 | 42/18723 | 1.30e-02 | 4.34e-02 | 24 |
| GO:0006047 | Oral cavity | OSCC | UDP-N-acetylglucosamine metabolic process | 10/7305 | 14/18723 | 1.44e-02 | 4.69e-02 | 10 |
| GO:000188919 | Oral cavity | LP | liver development | 62/4623 | 147/18723 | 2.32e-06 | 5.14e-05 | 62 |
| GO:0048732110 | Oral cavity | LP | gland development | 149/4623 | 436/18723 | 4.51e-06 | 9.17e-05 | 149 |
| GO:006100819 | Oral cavity | LP | hepaticobiliary system development | 62/4623 | 150/18723 | 5.13e-06 | 1.03e-04 | 62 |
| GO:003304422 | Oral cavity | EOLP | regulation of chromosome organization | 50/2218 | 187/18723 | 1.80e-08 | 7.94e-07 | 50 |
| GO:007190023 | Oral cavity | EOLP | regulation of protein serine/threonine kinase activity | 75/2218 | 359/18723 | 5.81e-07 | 1.53e-05 | 75 |
| GO:003300212 | Oral cavity | EOLP | muscle cell proliferation | 56/2218 | 248/18723 | 1.25e-06 | 3.00e-05 | 56 |
| GO:004865915 | Oral cavity | EOLP | smooth muscle cell proliferation | 44/2218 | 184/18723 | 3.47e-06 | 7.48e-05 | 44 |
| GO:004477222 | Oral cavity | EOLP | mitotic cell cycle phase transition | 81/2218 | 424/18723 | 8.32e-06 | 1.59e-04 | 81 |
| GO:004866015 | Oral cavity | EOLP | regulation of smooth muscle cell proliferation | 42/2218 | 180/18723 | 1.10e-05 | 1.93e-04 | 42 |
| GO:004586017 | Oral cavity | EOLP | positive regulation of protein kinase activity | 74/2218 | 386/18723 | 1.78e-05 | 2.89e-04 | 74 |
| GO:001003826 | Oral cavity | EOLP | response to metal ion | 71/2218 | 373/18723 | 3.32e-05 | 4.65e-04 | 71 |
| GO:001063923 | Oral cavity | EOLP | negative regulation of organelle organization | 67/2218 | 348/18723 | 3.78e-05 | 5.21e-04 | 67 |
| GO:000008221 | Oral cavity | EOLP | G1/S transition of mitotic cell cycle | 46/2218 | 214/18723 | 4.02e-05 | 5.51e-04 | 46 |
| GO:003367419 | Oral cavity | EOLP | positive regulation of kinase activity | 82/2218 | 467/18723 | 1.58e-04 | 1.68e-03 | 82 |
| GO:00515929 | Oral cavity | EOLP | response to calcium ion | 33/2218 | 149/18723 | 2.62e-04 | 2.54e-03 | 33 |
| GO:004484321 | Oral cavity | EOLP | cell cycle G1/S phase transition | 47/2218 | 241/18723 | 3.79e-04 | 3.41e-03 | 47 |
| GO:007190214 | Oral cavity | EOLP | positive regulation of protein serine/threonine kinase activity | 40/2218 | 200/18723 | 5.93e-04 | 4.99e-03 | 40 |
| Page: 1 2 3 4 5 6 7 8 9 10 11 12 13 14 15 16 17 18 19 20 21 22 23 24 25 26 27 |
| Pathway ID | Tissue | Disease Stage | Description | Gene Ratio | Bg Ratio | pvalue | p.adjust | qvalue | Count |
| Page: 1 |
Top |
Cell-cell communication analysis |
| Identification of potential cell-cell interactions between two cell types and their ligand-receptor pairs for different disease states |
| Ligand | Receptor | LRpair | Pathway | Tissue | Disease Stage |
| Page: 1 |
Top |
Single-cell gene regulatory network inference analysis |
| Find out the significant the regulons (TFs) and the target genes of each regulon across cell types for different disease states |
| TF | Cell Type | Tissue | Disease Stage | Target Gene | RSS | Regulon Activity |
| ∗The dot plots of a searched regulon are shown for all cell subpopulations in each disease state of each tissue based on the regulon specific score inferred using pySCENIC and by calculating the average expression. |
| Page: 1 |
Top |
Somatic mutation of malignant transformation related genes |
| Annotation of somatic variants for genes involved in malignant transformation |
| Hugo Symbol | Variant Class | Variant Classification | dbSNP RS | HGVSc | HGVSp | HGVSp Short | SWISSPROT | BIOTYPE | SIFT | PolyPhen | Tumor Sample Barcode | Tissue | Histology | Sex | Age | Stage | Therapy Types | Drugs | Outcome |
| NAT1 | SNV | Missense_Mutation | c.655N>A | p.Gly219Arg | p.G219R | protein_coding | deleterious(0.02) | possibly_damaging(0.887) | TCGA-BH-A0HF-01 | Breast | breast invasive carcinoma | Female | >=65 | I/II | Hormone Therapy | arimidex | SD | ||
| NAT1 | insertion | Frame_Shift_Ins | rs746311173 | c.486dupA | p.Tyr163IlefsTer15 | p.Y163Ifs*15 | protein_coding | TCGA-AN-A0AK-01 | Breast | breast invasive carcinoma | Female | >=65 | I/II | Unknown | Unknown | SD | |||
| NAT1 | insertion | In_Frame_Ins | novel | c.1043_1044insGCCTCTCTC | p.Arg348_Phe349insProLeuSer | p.R348_F349insPLS | protein_coding | TCGA-B6-A0IN-01 | Breast | breast invasive carcinoma | Female | <65 | I/II | Unknown | Unknown | PD | |||
| NAT1 | SNV | Missense_Mutation | novel | c.37N>A | p.Glu13Lys | p.E13K | protein_coding | possibly_damaging(0.502) | TCGA-2W-A8YY-01 | Cervix | cervical & endocervical cancer | Female | <65 | I/II | Chemotherapy | cisplatin | CR | ||
| NAT1 | SNV | Missense_Mutation | c.1014G>C | p.Gln338His | p.Q338H | protein_coding | tolerated(0.07) | possibly_damaging(0.477) | TCGA-EK-A2RC-01 | Cervix | cervical & endocervical cancer | Female | <65 | I/II | Unknown | Unknown | SD | ||
| NAT1 | SNV | Missense_Mutation | novel | c.689N>C | p.Gln230Pro | p.Q230P | protein_coding | tolerated(0.18) | benign(0.057) | TCGA-AZ-4315-01 | Colorectum | colon adenocarcinoma | Male | <65 | I/II | Unknown | Unknown | SD | |
| NAT1 | SNV | Missense_Mutation | rs138061602 | c.377G>A | p.Arg126Gln | p.R126Q | protein_coding | deleterious(0.02) | possibly_damaging(0.903) | TCGA-A5-A0GB-01 | Endometrium | uterine corpus endometrioid carcinoma | Female | >=65 | I/II | Unknown | Unknown | SD | |
| NAT1 | SNV | Missense_Mutation | novel | c.689A>G | p.Gln230Arg | p.Q230R | protein_coding | tolerated(0.08) | benign(0.057) | TCGA-A5-A1OF-01 | Endometrium | uterine corpus endometrioid carcinoma | Female | <65 | I/II | Unknown | Unknown | SD | |
| NAT1 | SNV | Missense_Mutation | c.974N>G | p.Ile325Arg | p.I325R | protein_coding | deleterious(0) | probably_damaging(0.964) | TCGA-AP-A054-01 | Endometrium | uterine corpus endometrioid carcinoma | Female | <65 | III/IV | Chemotherapy | carboplatin | PD | ||
| NAT1 | SNV | Missense_Mutation | novel | c.473N>A | p.Thr158Asn | p.T158N | protein_coding | tolerated(0.2) | benign(0.005) | TCGA-AX-A2HC-01 | Endometrium | uterine corpus endometrioid carcinoma | Female | <65 | III/IV | Chemotherapy | paclitaxel | PD |
| Page: 1 2 3 |
Top |
Related drugs of malignant transformation related genes |
| Identification of chemicals and drugs interact with genes involved in malignant transfromation |
| (DGIdb 4.0) |
| Entrez ID | Symbol | Category | Interaction Types | Drug Claim Name | Drug Name | PMIDs |
| 9 | NAT1 | ENZYME, DRUGGABLE GENOME | inhibitor | CHEMBL1201023 | ORPHENADRINE HYDROCHLORIDE | |
| 9 | NAT1 | ENZYME, DRUGGABLE GENOME | CHEMBL1201483 | PSEUDOEPHEDRINE POLISTIREX | ||
| 9 | NAT1 | ENZYME, DRUGGABLE GENOME | inhibitor | CHEMBL1898523 | PHENDIMETRAZINE TARTRATE | |
| 9 | NAT1 | ENZYME, DRUGGABLE GENOME | inhibitor | CHEMBL3301595 | DASOTRALINE | |
| 9 | NAT1 | ENZYME, DRUGGABLE GENOME | CHEMBL1200992 | |||
| 9 | NAT1 | ENZYME, DRUGGABLE GENOME | inhibitor | CHEMBL1237135 | MAPROTILINE HYDROCHLORIDE | |
| 9 | NAT1 | ENZYME, DRUGGABLE GENOME | inhibitor | CHEMBL1722 | METHYLPHENIDATE HYDROCHLORIDE | |
| 9 | NAT1 | ENZYME, DRUGGABLE GENOME | inhibitor | CHEMBL1200492 | NEFAZODONE HYDROCHLORIDE | |
| 9 | NAT1 | ENZYME, DRUGGABLE GENOME | inhibitor | CHEMBL2105732 | LEVOMILNACIPRAN HYDROCHLORIDE | |
| 9 | NAT1 | ENZYME, DRUGGABLE GENOME | inhibitor | CHEMBL2103857 | EDIVOXETINE |
| Page: 1 2 3 4 5 6 7 |

Copyright 2023-Present -The University of Texas Health Science Center at Houston |