
|
|||||
|
 | |
| |
| |
| |
| |
| |
|
Gene: MTPN |
Gene summary for MTPN |
| Gene information | Species | Human | Gene symbol | MTPN | Gene ID | 136319 |
| Gene name | myotrophin | |
| Gene Alias | GCDP | |
| Cytomap | 7q33 | |
| Gene Type | protein-coding | GO ID | GO:0001558 | UniProtAcc | P58546 |
Top |
Malignant transformation analysis |
| Identification of the aberrant gene expression in precancerous and cancerous lesions by comparing the gene expression of stem-like cells in diseased tissues with normal stem cells |
| Entrez ID | Symbol | Replicates | Species | Organ | Tissue | Adj P-value | Log2FC | Malignancy |
| 136319 | MTPN | CA_HPV_1 | Human | Cervix | CC | 4.38e-12 | -5.54e-02 | 0.0264 |
| 136319 | MTPN | N_HPV_1 | Human | Cervix | N_HPV | 2.87e-02 | -1.20e-01 | 0.0079 |
| 136319 | MTPN | CCI_1 | Human | Cervix | CC | 4.69e-04 | -6.18e-01 | 0.528 |
| 136319 | MTPN | CCI_3 | Human | Cervix | CC | 3.06e-06 | -6.13e-01 | 0.516 |
| 136319 | MTPN | CCII_1 | Human | Cervix | CC | 2.24e-16 | -7.36e-01 | 0.3249 |
| 136319 | MTPN | H2 | Human | Cervix | HSIL_HPV | 2.33e-07 | -3.52e-01 | 0.0632 |
| 136319 | MTPN | L1 | Human | Cervix | CC | 2.05e-04 | -2.62e-01 | 0.0802 |
| 136319 | MTPN | T1 | Human | Cervix | CC | 1.80e-03 | -4.03e-01 | 0.0918 |
| 136319 | MTPN | T3 | Human | Cervix | CC | 4.89e-03 | -1.62e-01 | 0.1389 |
| 136319 | MTPN | AEH-subject1 | Human | Endometrium | AEH | 1.00e-11 | -3.34e-01 | -0.3059 |
| 136319 | MTPN | AEH-subject2 | Human | Endometrium | AEH | 3.90e-11 | -2.58e-01 | -0.2525 |
| 136319 | MTPN | AEH-subject3 | Human | Endometrium | AEH | 3.97e-09 | -2.72e-01 | -0.2576 |
| 136319 | MTPN | AEH-subject4 | Human | Endometrium | AEH | 7.88e-03 | -1.11e-01 | -0.2657 |
| 136319 | MTPN | AEH-subject5 | Human | Endometrium | AEH | 2.89e-02 | -1.96e-01 | -0.2953 |
| 136319 | MTPN | EEC-subject1 | Human | Endometrium | EEC | 1.41e-10 | -3.68e-01 | -0.2682 |
| 136319 | MTPN | EEC-subject2 | Human | Endometrium | EEC | 2.52e-18 | -4.41e-01 | -0.2607 |
| 136319 | MTPN | EEC-subject3 | Human | Endometrium | EEC | 2.40e-24 | -2.61e-01 | -0.2525 |
| 136319 | MTPN | EEC-subject4 | Human | Endometrium | EEC | 5.58e-03 | -2.13e-01 | -0.2571 |
| 136319 | MTPN | EEC-subject5 | Human | Endometrium | EEC | 1.14e-05 | -2.75e-01 | -0.249 |
| 136319 | MTPN | GSM5276935 | Human | Endometrium | EEC | 9.56e-06 | -2.85e-01 | -0.123 |
| Page: 1 2 3 4 5 6 7 8 9 |
| Tissue | Expression Dynamics | Abbreviation |
| Cervix |  | CC: Cervix cancer |
| HSIL_HPV: HPV-infected high-grade squamous intraepithelial lesions | ||
| N_HPV: HPV-infected normal cervix | ||
| Endometrium | 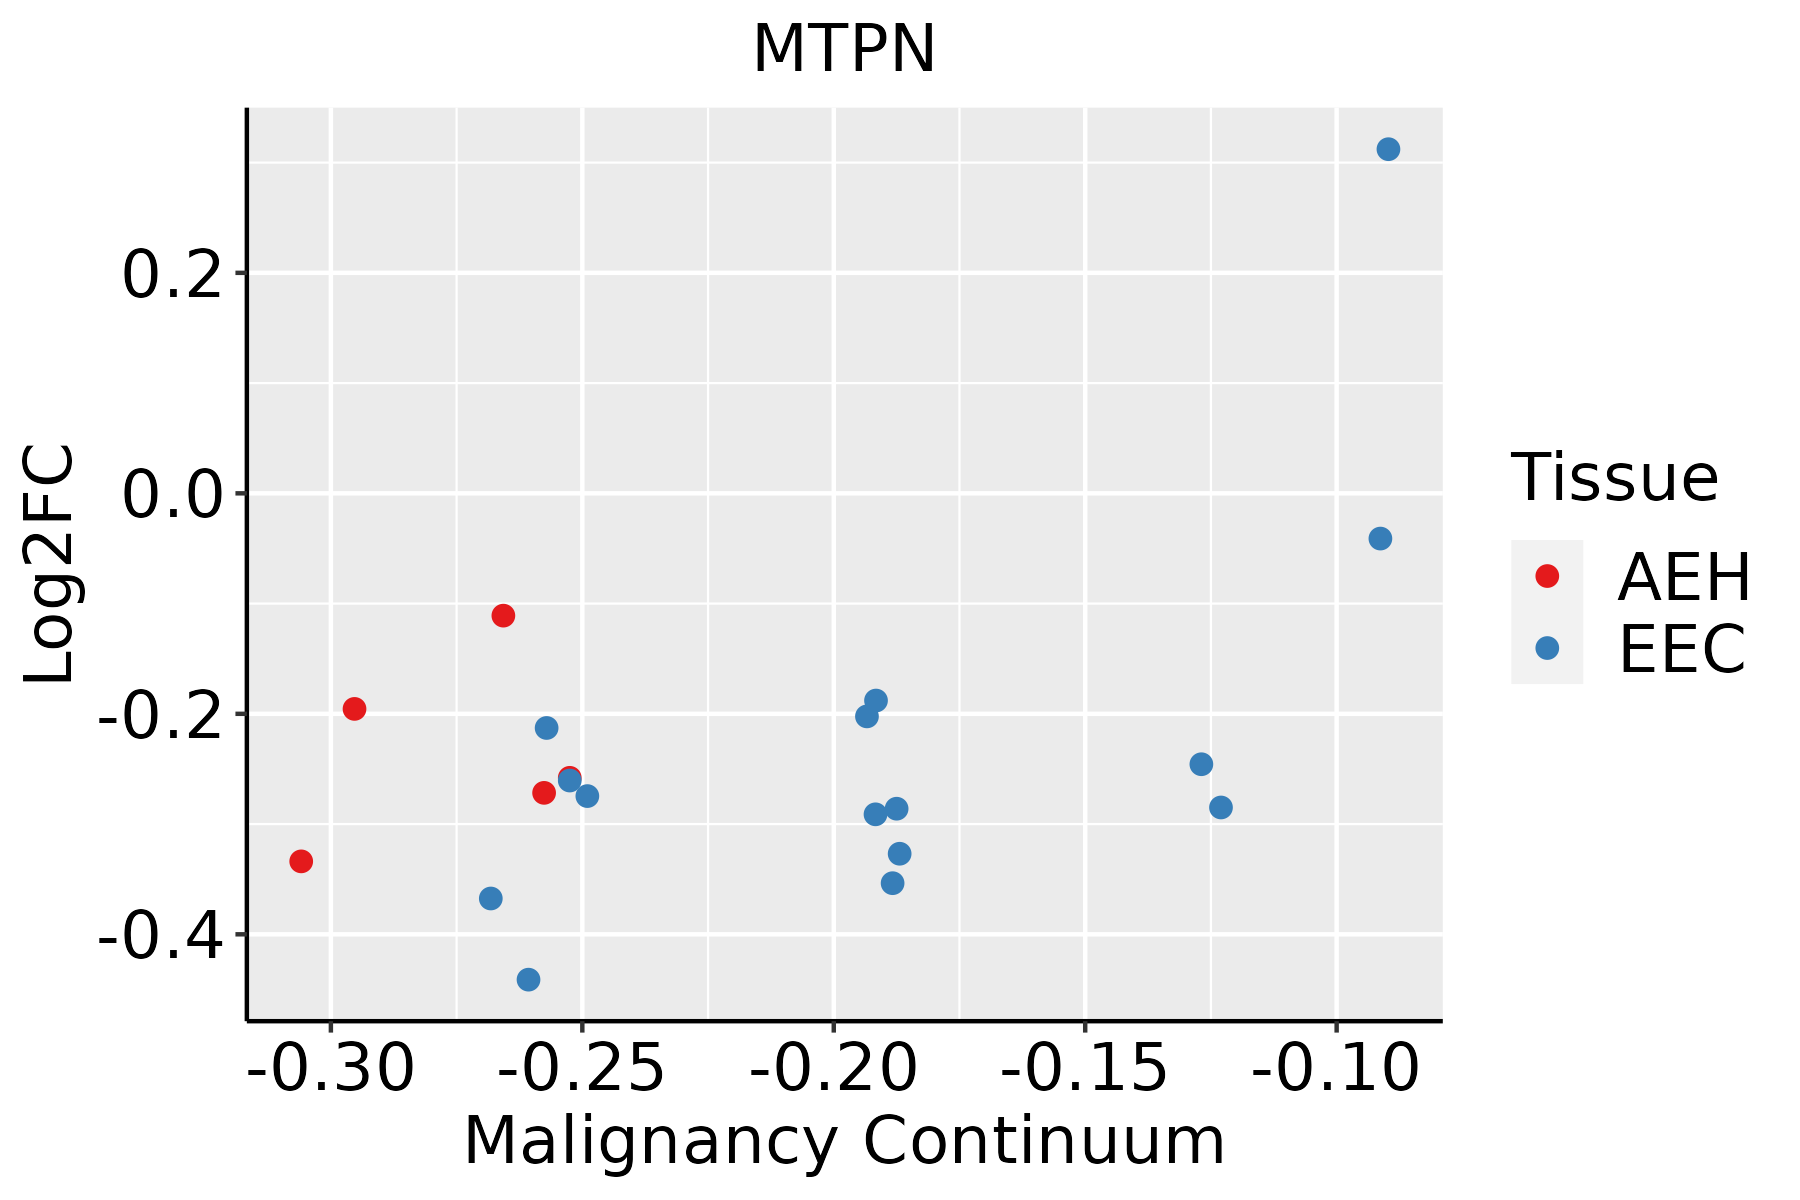 | AEH: Atypical endometrial hyperplasia |
| EEC: Endometrioid Cancer | ||
| Esophagus | 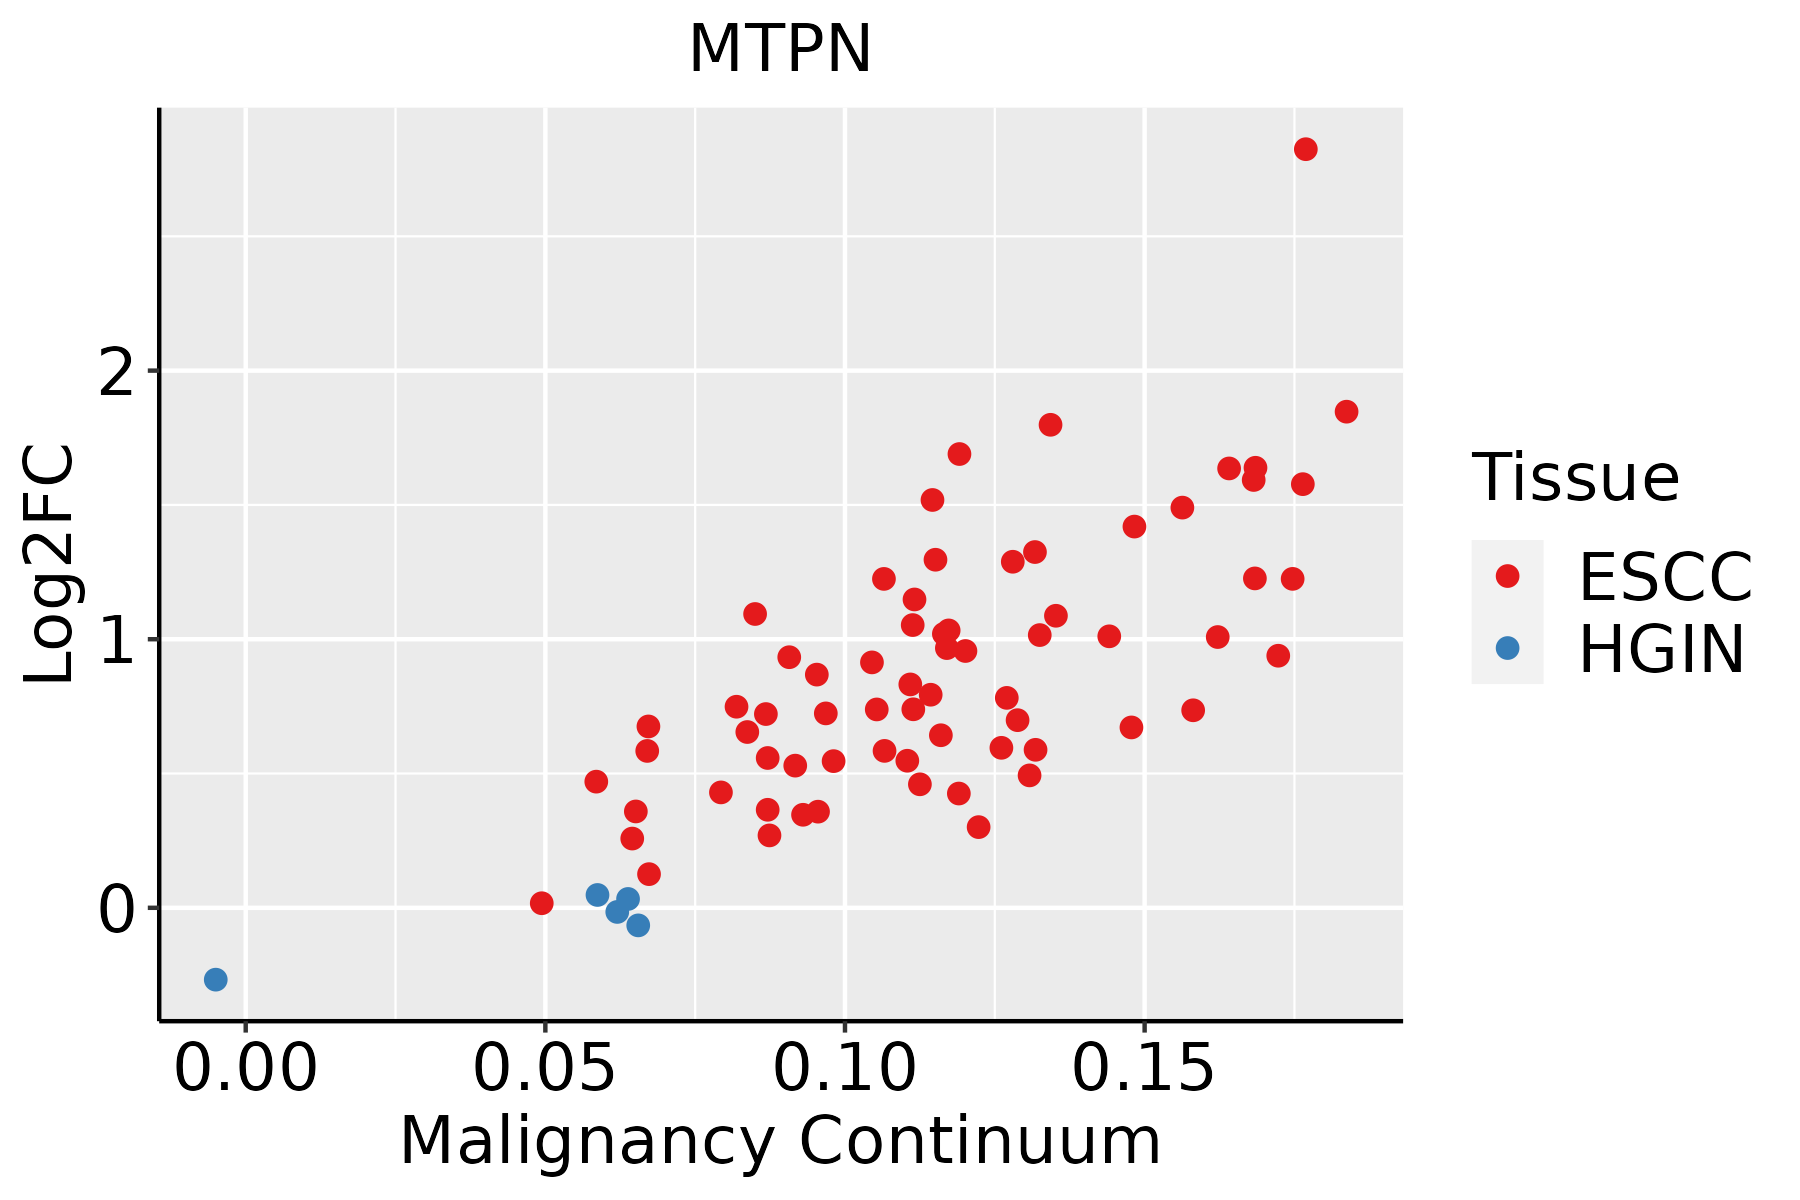 | ESCC: Esophageal squamous cell carcinoma |
| HGIN: High-grade intraepithelial neoplasias | ||
| LGIN: Low-grade intraepithelial neoplasias | ||
| Liver | 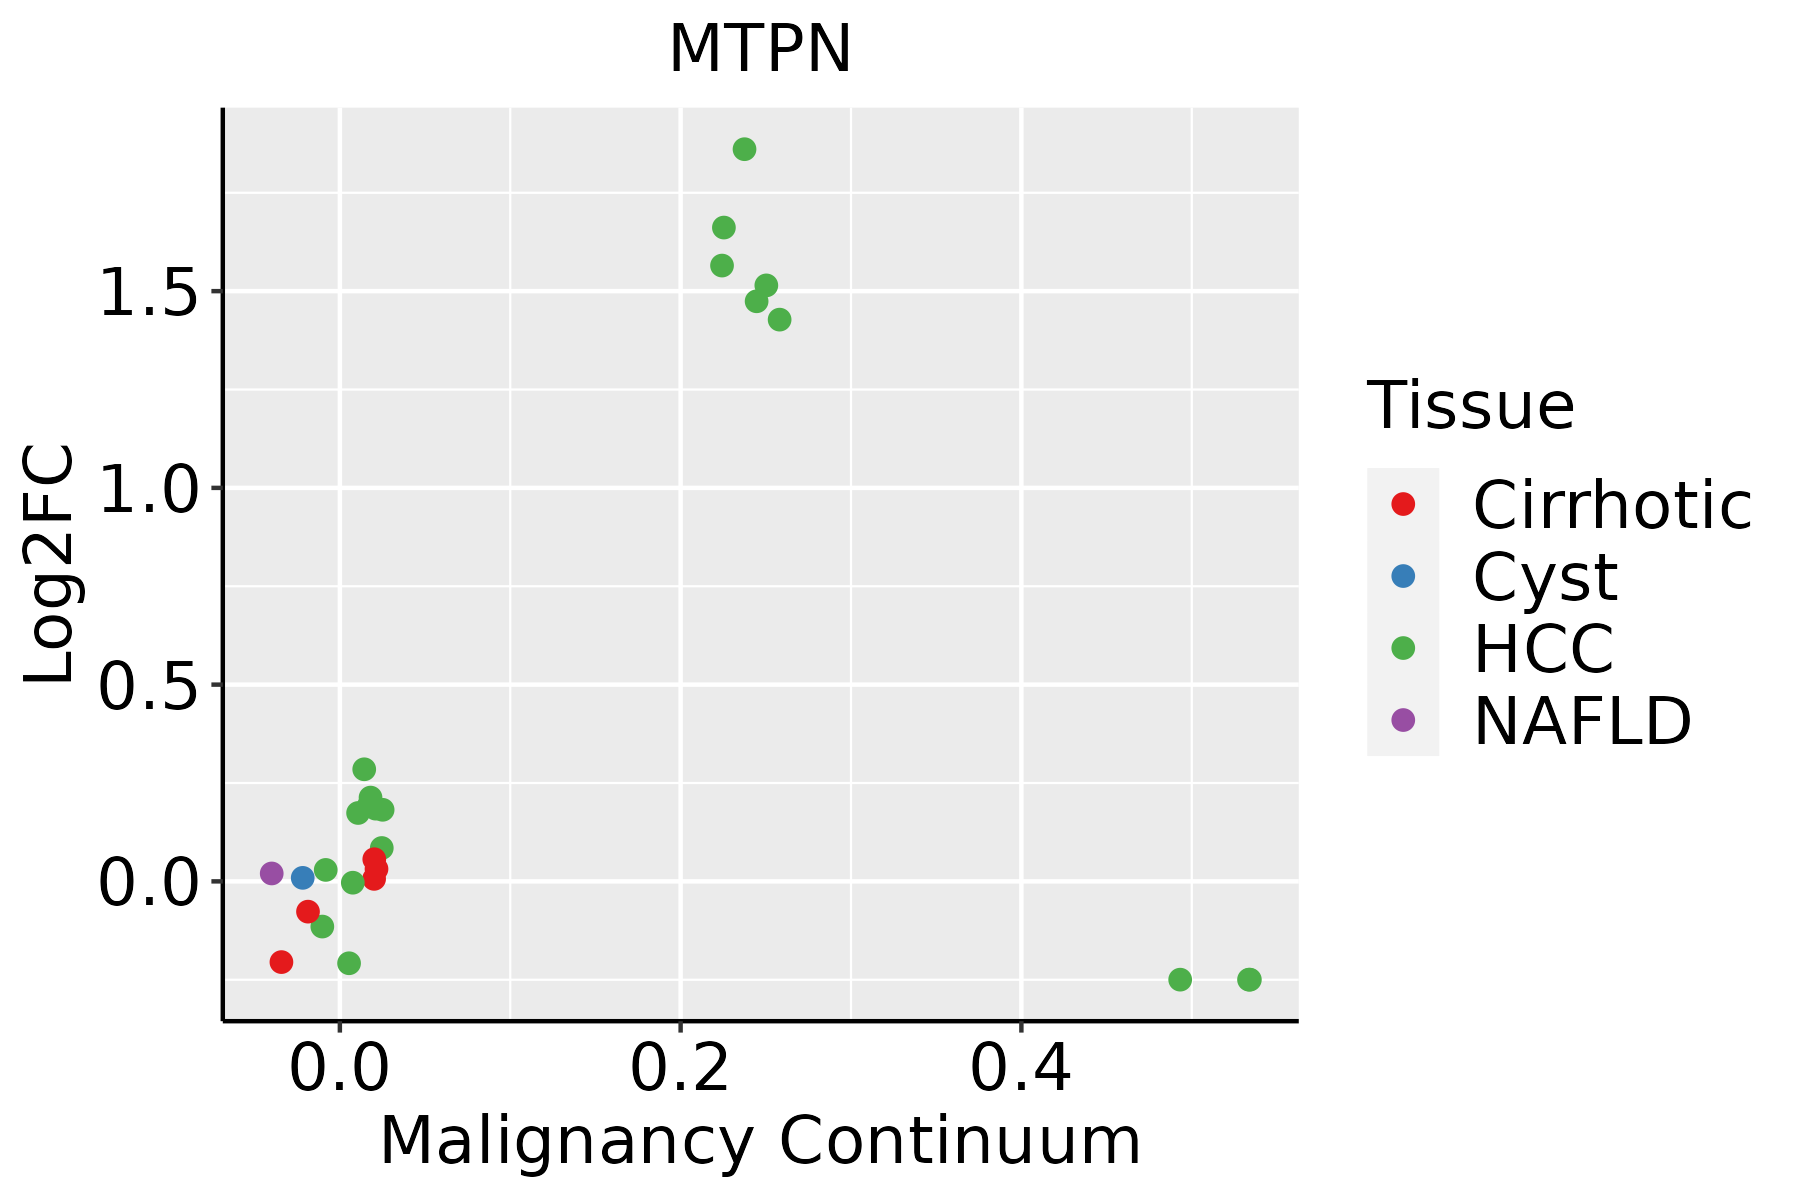 | HCC: Hepatocellular carcinoma |
| NAFLD: Non-alcoholic fatty liver disease | ||
| Oral Cavity | 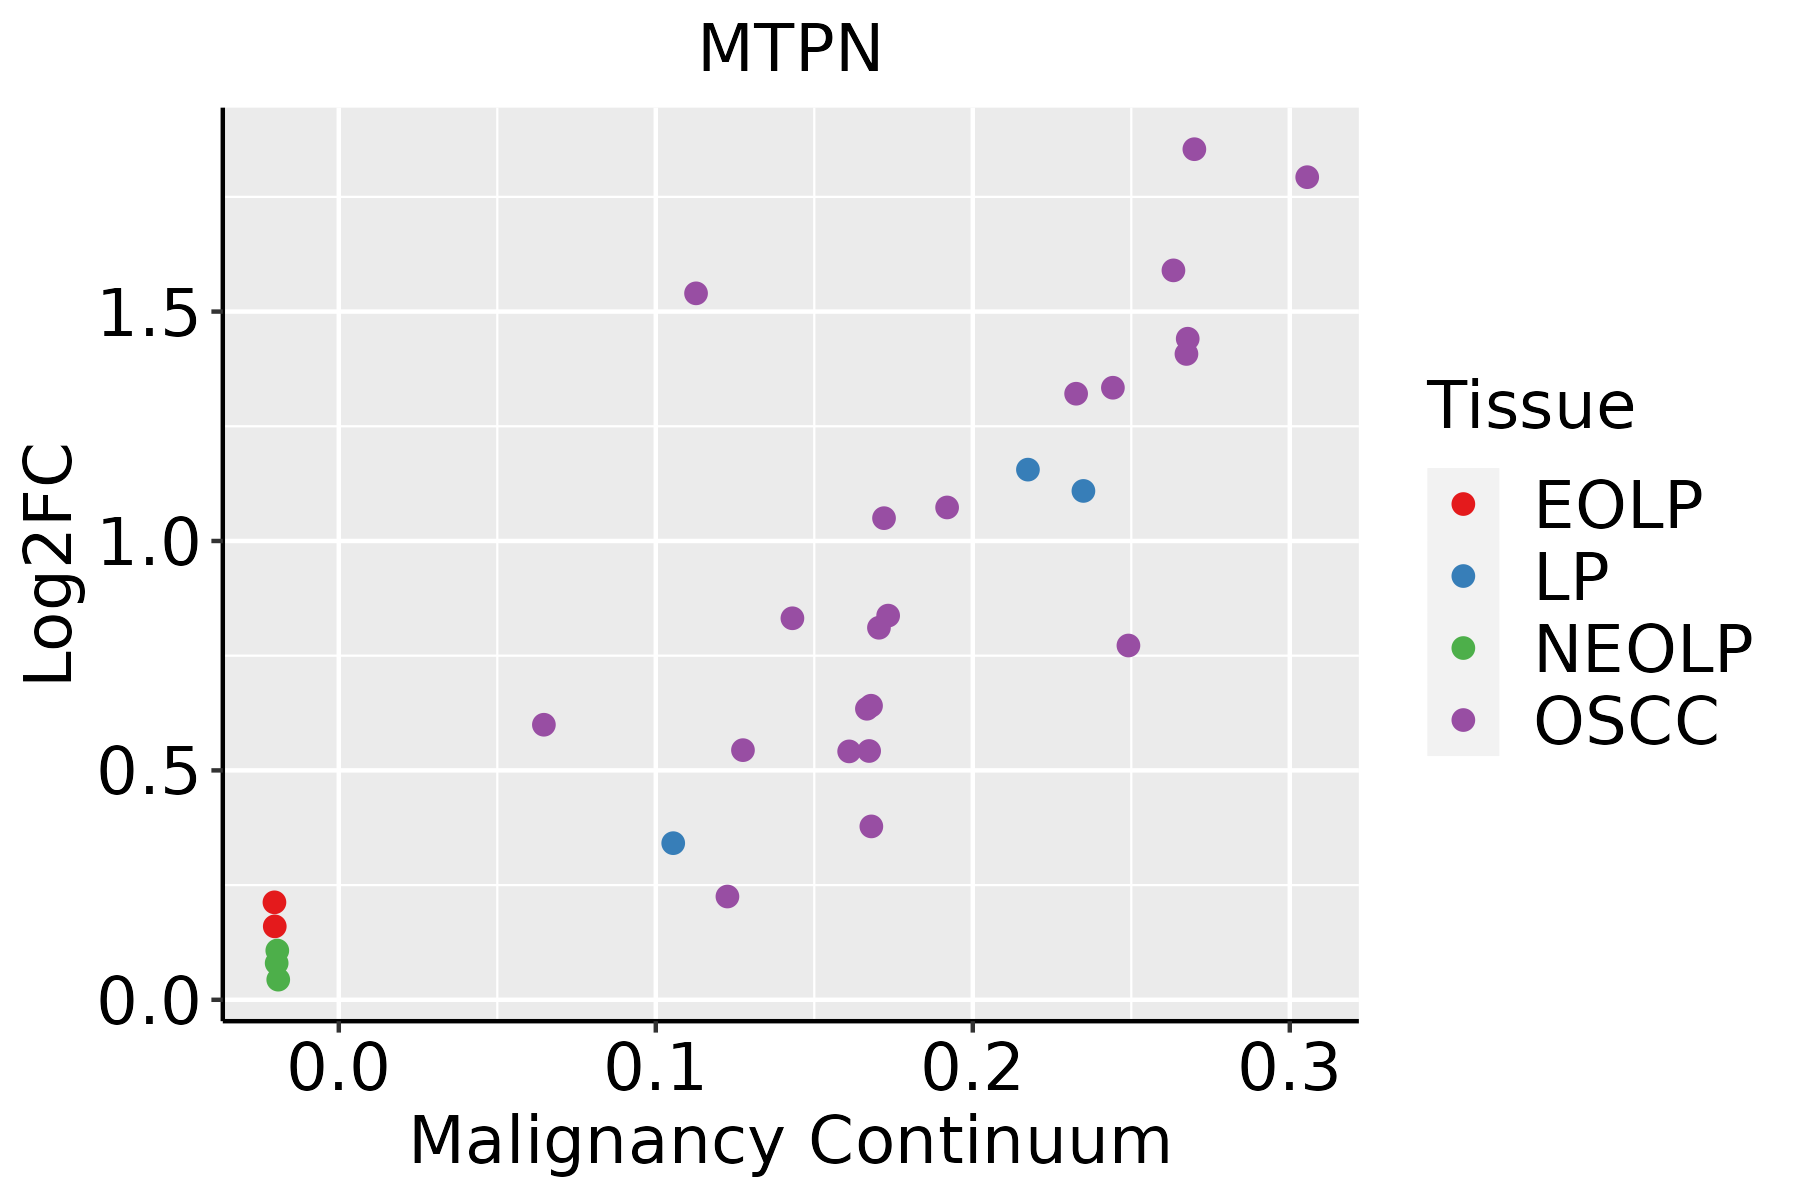 | EOLP: Erosive Oral lichen planus |
| LP: leukoplakia | ||
| NEOLP: Non-erosive oral lichen planus | ||
| OSCC: Oral squamous cell carcinoma | ||
| Prostate | 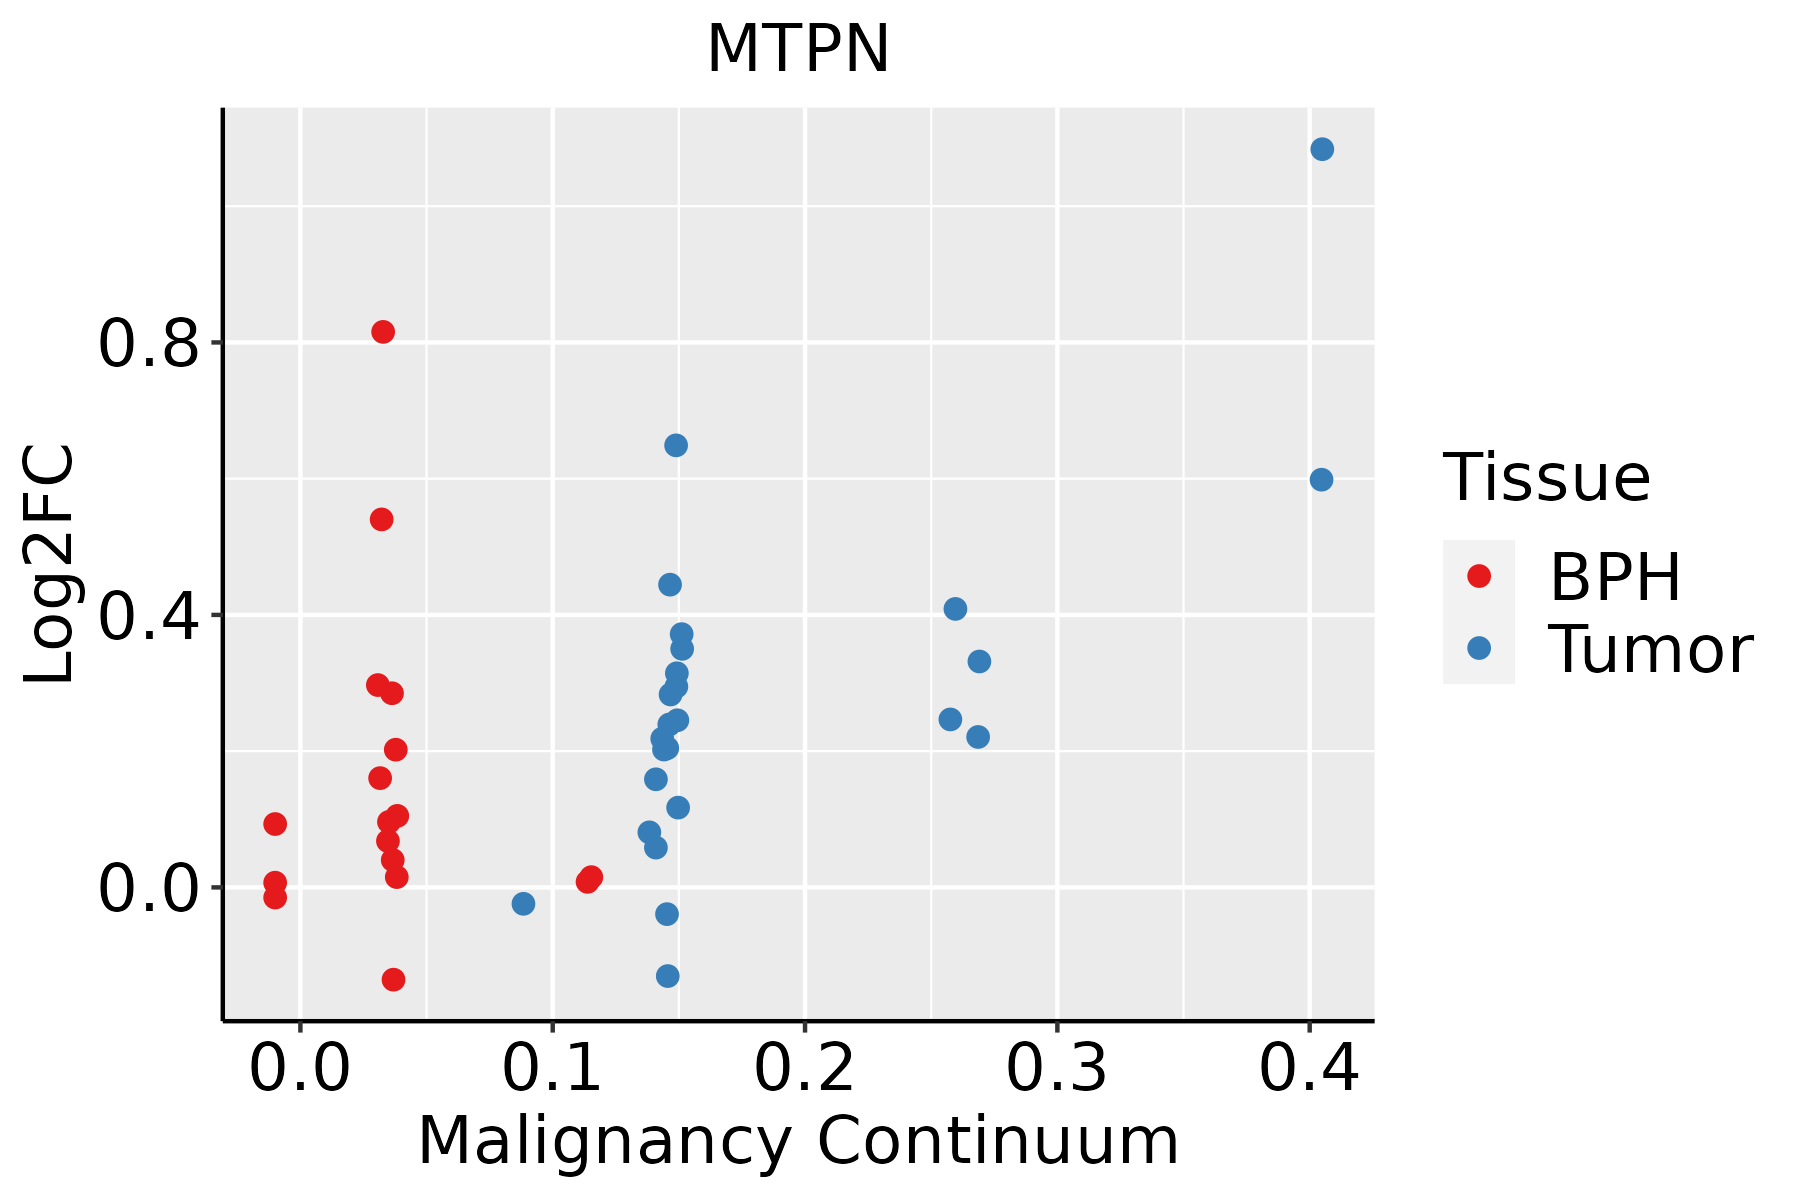 | BPH: Benign Prostatic Hyperplasia |
| Skin | 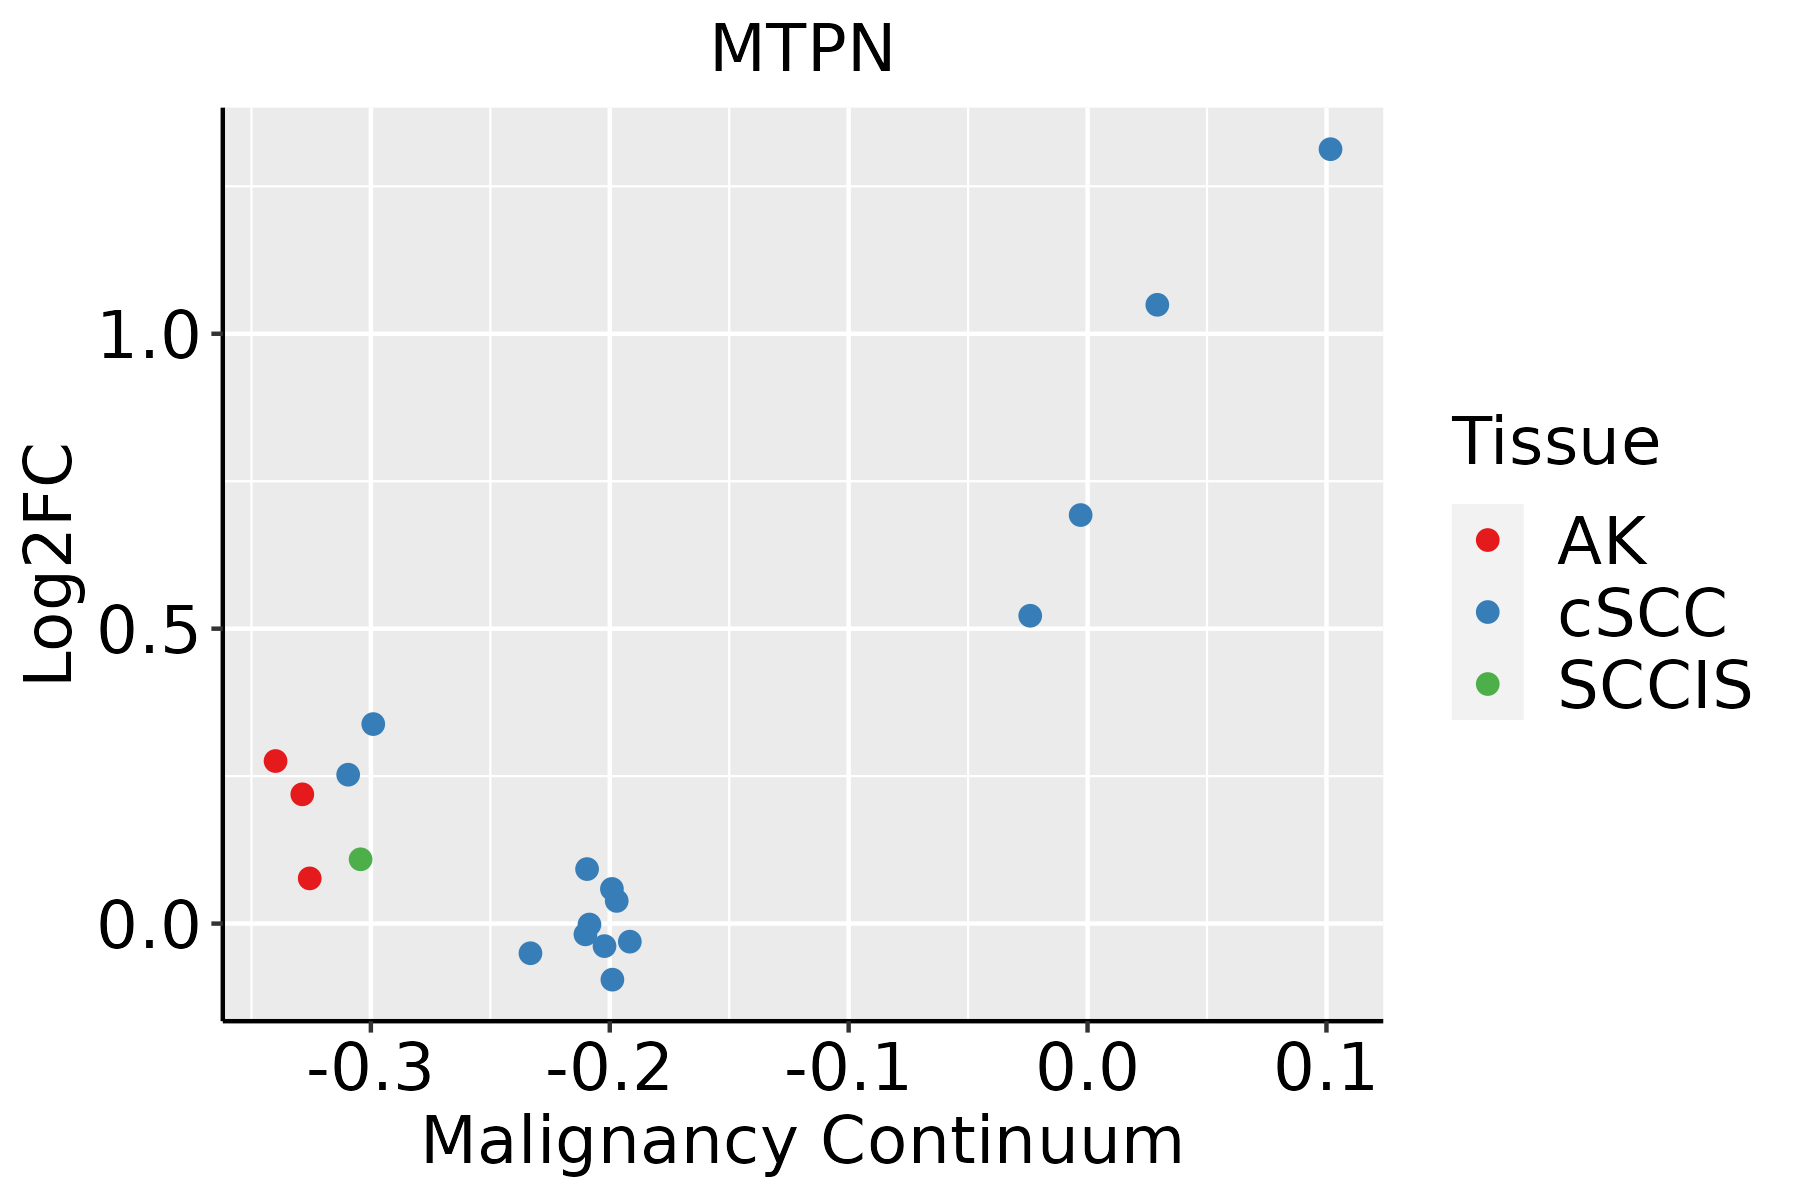 | AK: Actinic keratosis |
| cSCC: Cutaneous squamous cell carcinoma | ||
| SCCIS:squamous cell carcinoma in situ | ||
| Thyroid |  | ATC: Anaplastic thyroid cancer |
| HT: Hashimoto's thyroiditis | ||
| PTC: Papillary thyroid cancer |
| ∗log2FC in expression of this searched gene in stem-like cells from each diseased tissue sample relative to stem-like cells in normal samples in each tissue plotted against the malignancy continuum. Samples are colored based on if they are from different disease stage. |
Top |
Malignant transformation related pathway analysis |
| Find out the enriched GO biological processes and KEGG pathways involved in transition from healthy to precancer to cancer |
| Tissue | Disease Stage | Enriched GO biological Processes |
| Colorectum | AD |  |
| Colorectum | SER |  |
| Colorectum | MSS |  |
| Colorectum | MSI-H |  |
| Colorectum | FAP |  |
| ∗Top 15 enriched GO BP terms are showed in the bar plot of each disease state in each tissue. Each row represents a significant GO biological process which is colored according to the -log10(p.adjust). |
| Page: 1 2 3 4 5 6 7 8 9 |
| GO ID | Tissue | Disease Stage | Description | Gene Ratio | Bg Ratio | pvalue | p.adjust | Count |
| GO:001604918 | Oral cavity | LP | cell growth | 155/4623 | 482/18723 | 1.08e-04 | 1.31e-03 | 155 |
| GO:0007015110 | Oral cavity | LP | actin filament organization | 143/4623 | 442/18723 | 1.44e-04 | 1.65e-03 | 143 |
| GO:000806418 | Oral cavity | LP | regulation of actin polymerization or depolymerization | 69/4623 | 188/18723 | 1.55e-04 | 1.76e-03 | 69 |
| GO:003083217 | Oral cavity | LP | regulation of actin filament length | 69/4623 | 189/18723 | 1.86e-04 | 2.05e-03 | 69 |
| GO:000155817 | Oral cavity | LP | regulation of cell growth | 134/4623 | 414/18723 | 2.25e-04 | 2.41e-03 | 134 |
| GO:003004119 | Oral cavity | LP | actin filament polymerization | 69/4623 | 191/18723 | 2.65e-04 | 2.75e-03 | 69 |
| GO:000815419 | Oral cavity | LP | actin polymerization or depolymerization | 76/4623 | 218/18723 | 4.67e-04 | 4.42e-03 | 76 |
| GO:003133319 | Oral cavity | LP | negative regulation of protein-containing complex assembly | 52/4623 | 141/18723 | 8.28e-04 | 7.24e-03 | 52 |
| GO:0110053110 | Oral cavity | LP | regulation of actin filament organization | 92/4623 | 278/18723 | 9.25e-04 | 7.85e-03 | 92 |
| GO:00422461 | Oral cavity | LP | tissue regeneration | 30/4623 | 72/18723 | 1.13e-03 | 9.27e-03 | 30 |
| GO:005109114 | Oral cavity | LP | positive regulation of DNA-binding transcription factor activity | 86/4623 | 260/18723 | 1.35e-03 | 1.08e-02 | 86 |
| GO:004340311 | Oral cavity | LP | skeletal muscle tissue regeneration | 18/4623 | 37/18723 | 1.36e-03 | 1.08e-02 | 18 |
| GO:190290418 | Oral cavity | LP | negative regulation of supramolecular fiber organization | 56/4623 | 167/18723 | 6.19e-03 | 3.66e-02 | 56 |
| GO:004325426 | Oral cavity | EOLP | regulation of protein-containing complex assembly | 112/2218 | 428/18723 | 1.58e-16 | 1.35e-13 | 112 |
| GO:000641726 | Oral cavity | EOLP | regulation of translation | 108/2218 | 468/18723 | 4.04e-12 | 7.34e-10 | 108 |
| GO:190290326 | Oral cavity | EOLP | regulation of supramolecular fiber organization | 93/2218 | 383/18723 | 6.50e-12 | 1.08e-09 | 93 |
| GO:000701526 | Oral cavity | EOLP | actin filament organization | 102/2218 | 442/18723 | 1.61e-11 | 2.48e-09 | 102 |
| GO:003297026 | Oral cavity | EOLP | regulation of actin filament-based process | 93/2218 | 397/18723 | 5.39e-11 | 7.03e-09 | 93 |
| GO:003227125 | Oral cavity | EOLP | regulation of protein polymerization | 64/2218 | 233/18723 | 5.54e-11 | 7.07e-09 | 64 |
| GO:005125825 | Oral cavity | EOLP | protein polymerization | 74/2218 | 297/18723 | 2.65e-10 | 2.45e-08 | 74 |
| Page: 1 2 3 4 5 6 7 8 9 10 11 12 13 14 15 16 17 18 19 20 21 22 23 24 25 26 27 28 29 30 31 32 33 34 35 36 37 38 |
| Pathway ID | Tissue | Disease Stage | Description | Gene Ratio | Bg Ratio | pvalue | p.adjust | qvalue | Count |
| Page: 1 |
Top |
Cell-cell communication analysis |
| Identification of potential cell-cell interactions between two cell types and their ligand-receptor pairs for different disease states |
| Ligand | Receptor | LRpair | Pathway | Tissue | Disease Stage |
| Page: 1 |
Top |
Single-cell gene regulatory network inference analysis |
| Find out the significant the regulons (TFs) and the target genes of each regulon across cell types for different disease states |
| TF | Cell Type | Tissue | Disease Stage | Target Gene | RSS | Regulon Activity |
| ∗The dot plots of a searched regulon are shown for all cell subpopulations in each disease state of each tissue based on the regulon specific score inferred using pySCENIC and by calculating the average expression. |
| Page: 1 |
Top |
Somatic mutation of malignant transformation related genes |
| Annotation of somatic variants for genes involved in malignant transformation |
| Hugo Symbol | Variant Class | Variant Classification | dbSNP RS | HGVSc | HGVSp | HGVSp Short | SWISSPROT | BIOTYPE | SIFT | PolyPhen | Tumor Sample Barcode | Tissue | Histology | Sex | Age | Stage | Therapy Types | Drugs | Outcome |
| MTPN | SNV | Missense_Mutation | novel | c.7G>A | p.Asp3Asn | p.D3N | P58546 | protein_coding | tolerated(0.3) | possibly_damaging(0.649) | TCGA-PE-A5DE-01 | Breast | breast invasive carcinoma | Female | <65 | I/II | Chemotherapy | taxotere | CR |
| MTPN | SNV | Missense_Mutation | novel | c.229T>G | p.Tyr77Asp | p.Y77D | P58546 | protein_coding | deleterious(0.01) | possibly_damaging(0.814) | TCGA-CA-6717-01 | Colorectum | colon adenocarcinoma | Male | <65 | I/II | Chemotherapy | oxaliplatin | CR |
| MTPN | SNV | Missense_Mutation | c.188N>A | p.Ala63Asp | p.A63D | P58546 | protein_coding | deleterious(0.05) | probably_damaging(0.988) | TCGA-AP-A059-01 | Endometrium | uterine corpus endometrioid carcinoma | Female | >=65 | I/II | Unknown | Unknown | SD | |
| MTPN | SNV | Missense_Mutation | c.310G>A | p.Ala104Thr | p.A104T | P58546 | protein_coding | tolerated(0.34) | probably_damaging(0.934) | TCGA-BG-A0M7-01 | Endometrium | uterine corpus endometrioid carcinoma | Female | <65 | III/IV | Chemotherapy | carboplatin | SD | |
| MTPN | SNV | Missense_Mutation | novel | c.147N>C | p.Glu49Asp | p.E49D | P58546 | protein_coding | tolerated(0.53) | benign(0.007) | TCGA-BS-A0UF-01 | Endometrium | uterine corpus endometrioid carcinoma | Female | >=65 | I/II | Unknown | Unknown | SD |
| MTPN | SNV | Missense_Mutation | c.18N>A | p.Phe6Leu | p.F6L | P58546 | protein_coding | tolerated(1) | benign(0.389) | TCGA-BS-A0UF-01 | Endometrium | uterine corpus endometrioid carcinoma | Female | >=65 | I/II | Unknown | Unknown | SD | |
| MTPN | SNV | Missense_Mutation | novel | c.259N>A | p.Leu87Ile | p.L87I | P58546 | protein_coding | deleterious(0.01) | probably_damaging(0.982) | TCGA-DF-A2KU-01 | Endometrium | uterine corpus endometrioid carcinoma | Female | Unknown | I/II | Unknown | Unknown | SD |
| MTPN | SNV | Missense_Mutation | c.13N>C | p.Glu5Gln | p.E5Q | P58546 | protein_coding | tolerated(0.1) | benign(0.214) | TCGA-60-2708-01 | Lung | lung squamous cell carcinoma | Female | <65 | I/II | Chemotherapy | carboplatin | SD | |
| MTPN | SNV | Missense_Mutation | novel | c.232G>A | p.Glu78Lys | p.E78K | P58546 | protein_coding | deleterious(0) | probably_damaging(0.957) | TCGA-KU-A6H7-01 | Oral cavity | head & neck squamous cell carcinoma | Female | <65 | I/II | Chemotherapy | cisplatin | CR |
| MTPN | SNV | Missense_Mutation | c.310N>A | p.Ala104Thr | p.A104T | P58546 | protein_coding | tolerated(0.34) | probably_damaging(0.934) | TCGA-HU-A4H2-01 | Stomach | stomach adenocarcinoma | Female | <65 | III/IV | Unknown | Unknown | SD |
| Page: 1 2 |
Top |
Related drugs of malignant transformation related genes |
| Identification of chemicals and drugs interact with genes involved in malignant transfromation |
| (DGIdb 4.0) |
| Entrez ID | Symbol | Category | Interaction Types | Drug Claim Name | Drug Name | PMIDs |
| Page: 1 |

Copyright 2023-Present -The University of Texas Health Science Center at Houston |