
|
|||||
|
 | |
| |
| |
| |
| |
| |
|
Gene: IGFBP5 |
Gene summary for IGFBP5 |
| Gene information | Species | Human | Gene symbol | IGFBP5 | Gene ID | 3488 |
| Gene name | insulin like growth factor binding protein 5 | |
| Gene Alias | IBP5 | |
| Cytomap | 2q35 | |
| Gene Type | protein-coding | GO ID | GO:0000003 | UniProtAcc | A0A024R433 |
Top |
Malignant transformation analysis |
| Identification of the aberrant gene expression in precancerous and cancerous lesions by comparing the gene expression of stem-like cells in diseased tissues with normal stem cells |
| Entrez ID | Symbol | Replicates | Species | Organ | Tissue | Adj P-value | Log2FC | Malignancy |
| 3488 | IGFBP5 | GSM4909281 | Human | Breast | IDC | 4.03e-15 | 5.31e-01 | 0.21 |
| 3488 | IGFBP5 | GSM4909285 | Human | Breast | IDC | 5.28e-97 | 1.57e+00 | 0.21 |
| 3488 | IGFBP5 | GSM4909293 | Human | Breast | IDC | 4.05e-142 | 2.25e+00 | 0.1581 |
| 3488 | IGFBP5 | GSM4909295 | Human | Breast | IDC | 3.24e-13 | 8.65e-01 | 0.0898 |
| 3488 | IGFBP5 | GSM4909296 | Human | Breast | IDC | 4.37e-38 | 1.22e+00 | 0.1524 |
| 3488 | IGFBP5 | GSM4909301 | Human | Breast | IDC | 6.15e-213 | 2.52e+00 | 0.1577 |
| 3488 | IGFBP5 | GSM4909311 | Human | Breast | IDC | 8.85e-22 | 7.88e-01 | 0.1534 |
| 3488 | IGFBP5 | GSM4909312 | Human | Breast | IDC | 1.17e-132 | 2.00e+00 | 0.1552 |
| 3488 | IGFBP5 | GSM4909313 | Human | Breast | IDC | 3.91e-54 | 1.74e+00 | 0.0391 |
| 3488 | IGFBP5 | GSM4909315 | Human | Breast | IDC | 5.13e-32 | 1.04e+00 | 0.21 |
| 3488 | IGFBP5 | GSM4909317 | Human | Breast | IDC | 1.73e-18 | 6.94e-01 | 0.1355 |
| 3488 | IGFBP5 | GSM4909319 | Human | Breast | IDC | 6.63e-84 | 1.81e+00 | 0.1563 |
| 3488 | IGFBP5 | GSM4909320 | Human | Breast | IDC | 1.43e-05 | 6.00e-01 | 0.1575 |
| 3488 | IGFBP5 | GSM4909321 | Human | Breast | IDC | 3.42e-08 | 5.51e-01 | 0.1559 |
| 3488 | IGFBP5 | M5 | Human | Breast | IDC | 2.90e-19 | 1.32e+00 | 0.1598 |
| 3488 | IGFBP5 | DCIS2 | Human | Breast | DCIS | 1.35e-05 | 1.69e-01 | 0.0085 |
| 3488 | IGFBP5 | CA_HPV_3 | Human | Cervix | CC | 5.04e-19 | 5.55e-01 | 0.0414 |
| 3488 | IGFBP5 | N_HPV_2 | Human | Cervix | N_HPV | 2.52e-04 | 3.22e-01 | -0.0131 |
| 3488 | IGFBP5 | AEH-subject1 | Human | Endometrium | AEH | 6.71e-21 | -8.05e-01 | -0.3059 |
| 3488 | IGFBP5 | AEH-subject2 | Human | Endometrium | AEH | 4.59e-19 | -7.97e-01 | -0.2525 |
| Page: 1 2 3 4 5 6 |
| Tissue | Expression Dynamics | Abbreviation |
| Breast | 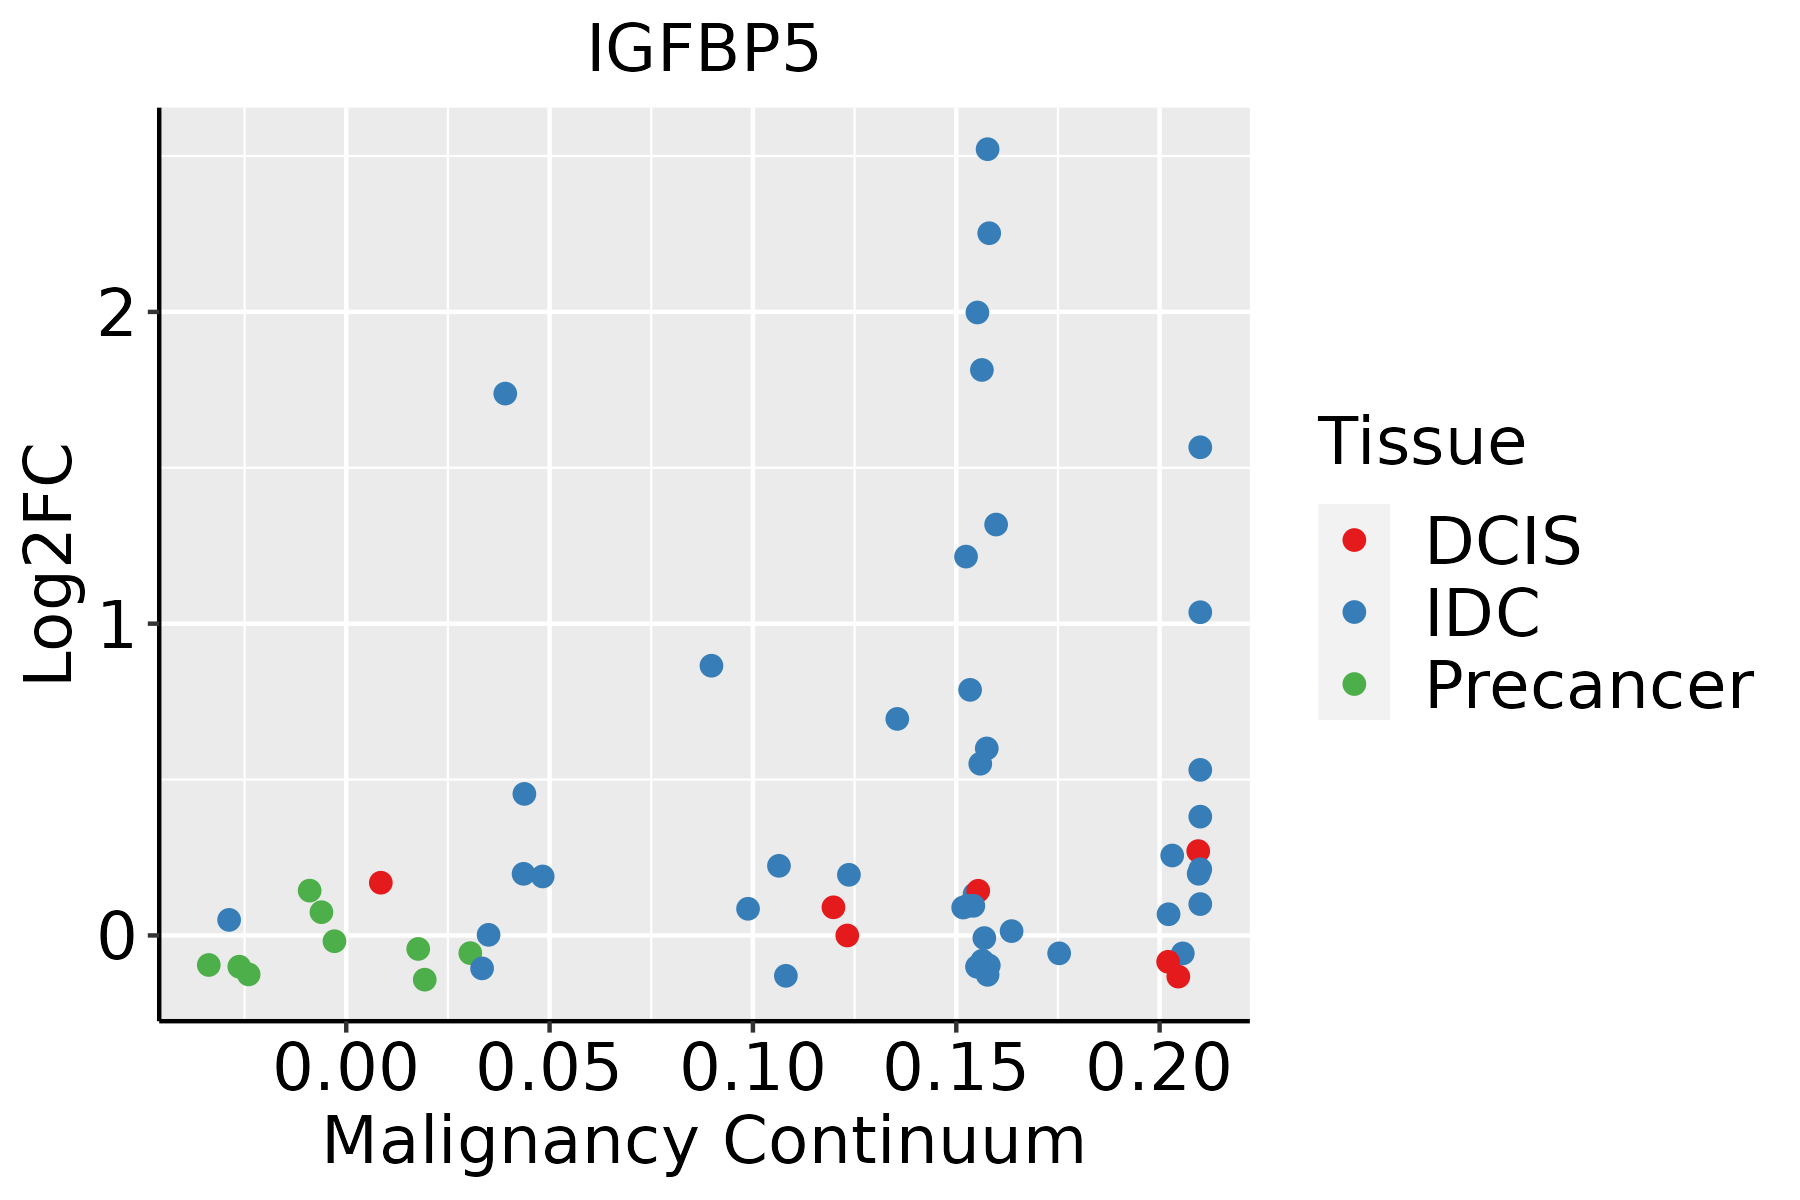 | IDC: Invasive ductal carcinoma |
| DCIS: Ductal carcinoma in situ | ||
| Precancer(BRCA1-mut): Precancerous lesion from BRCA1 mutation carriers | ||
| Cervix | 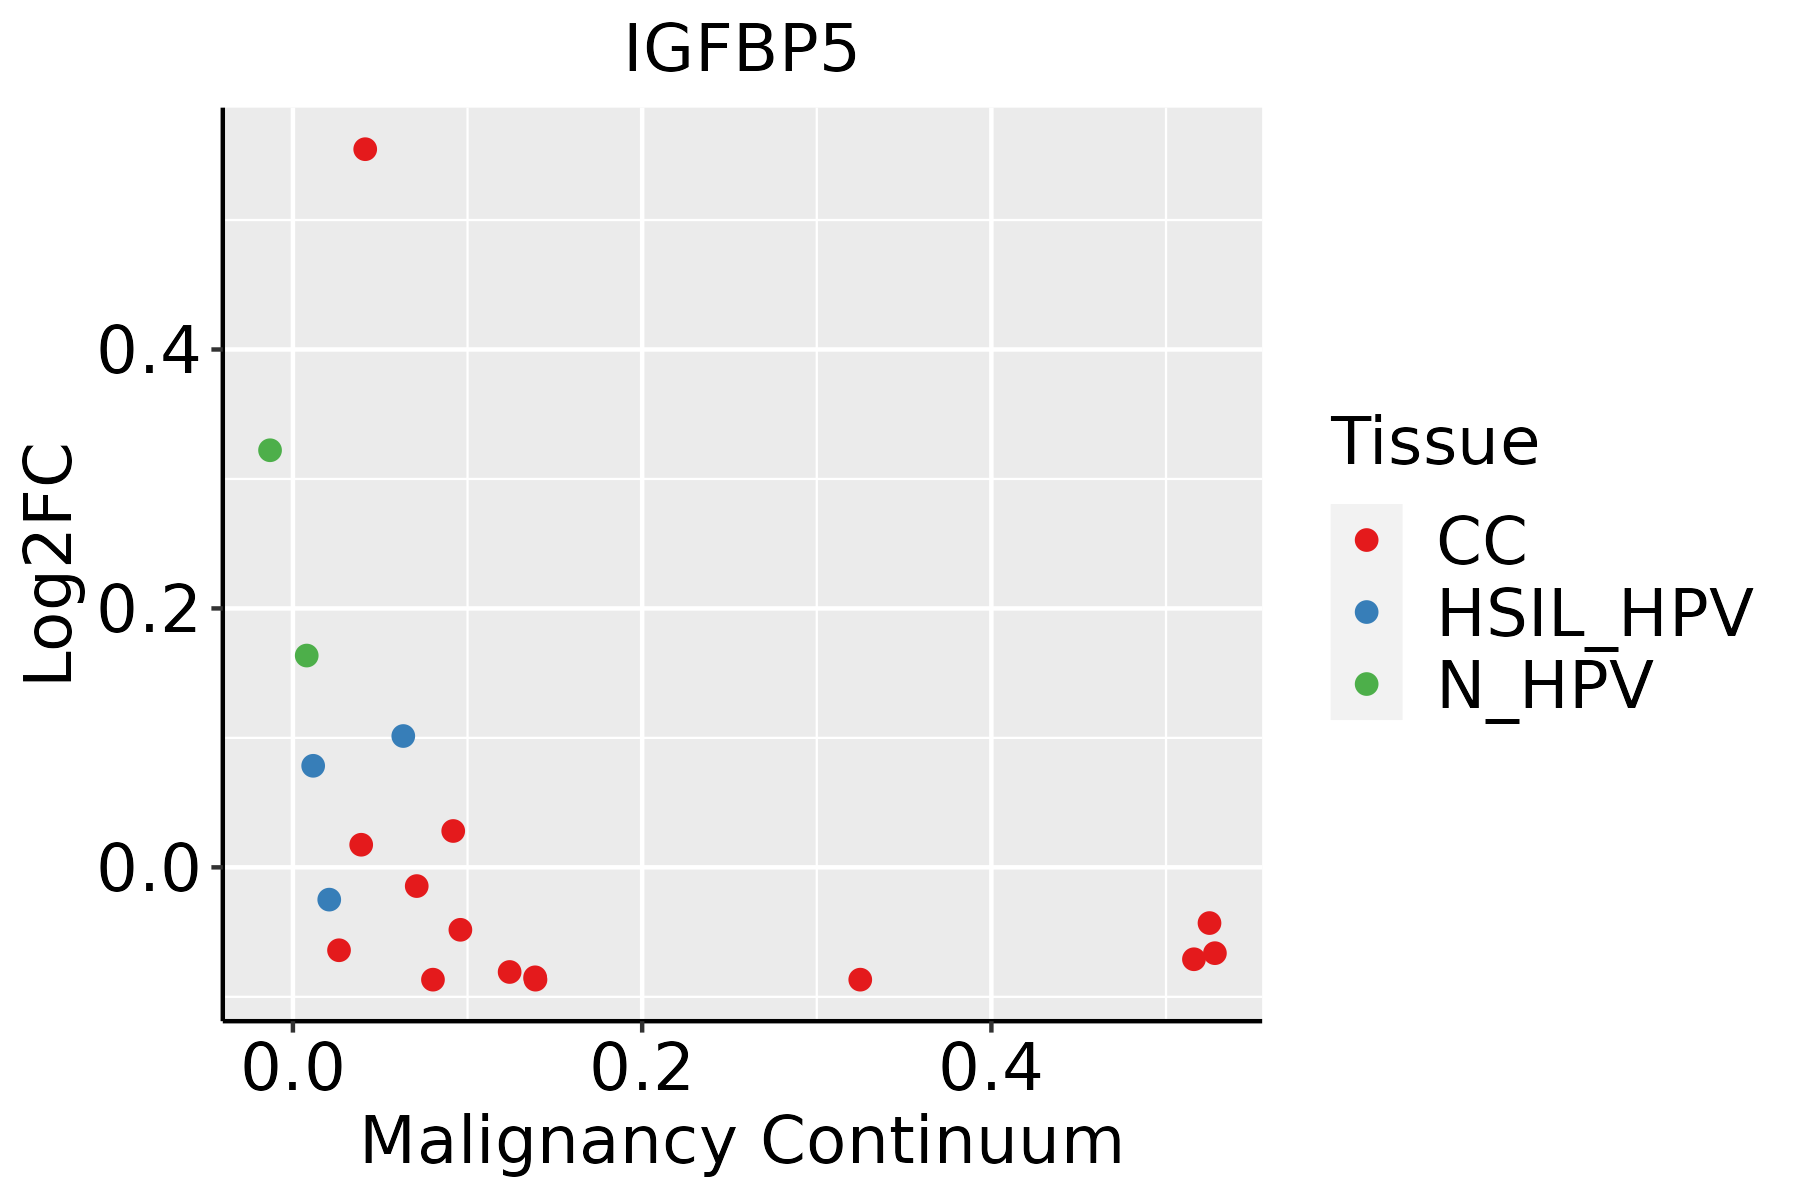 | CC: Cervix cancer |
| HSIL_HPV: HPV-infected high-grade squamous intraepithelial lesions | ||
| N_HPV: HPV-infected normal cervix | ||
| Endometrium |  | AEH: Atypical endometrial hyperplasia |
| EEC: Endometrioid Cancer | ||
| Esophagus |  | ESCC: Esophageal squamous cell carcinoma |
| HGIN: High-grade intraepithelial neoplasias | ||
| LGIN: Low-grade intraepithelial neoplasias | ||
| Oral Cavity | 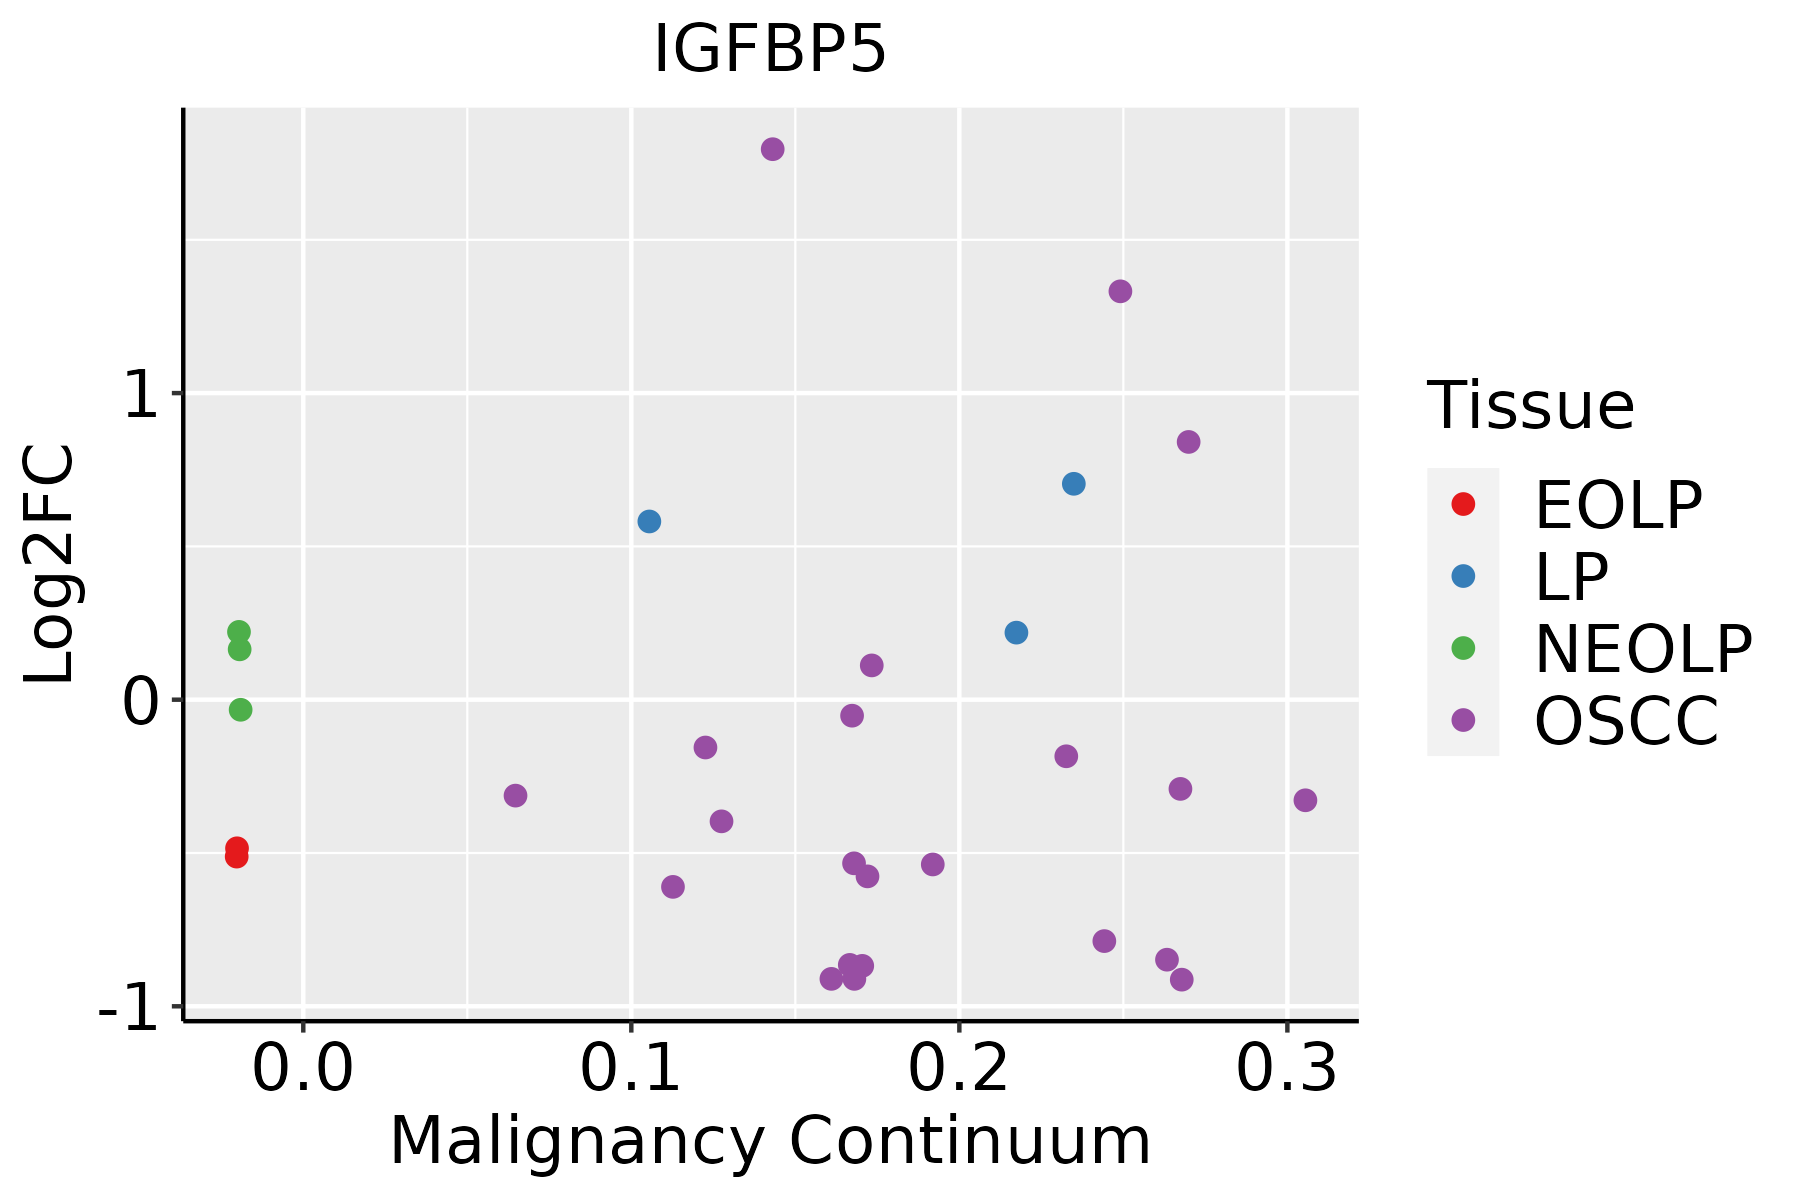 | EOLP: Erosive Oral lichen planus |
| LP: leukoplakia | ||
| NEOLP: Non-erosive oral lichen planus | ||
| OSCC: Oral squamous cell carcinoma | ||
| Prostate | 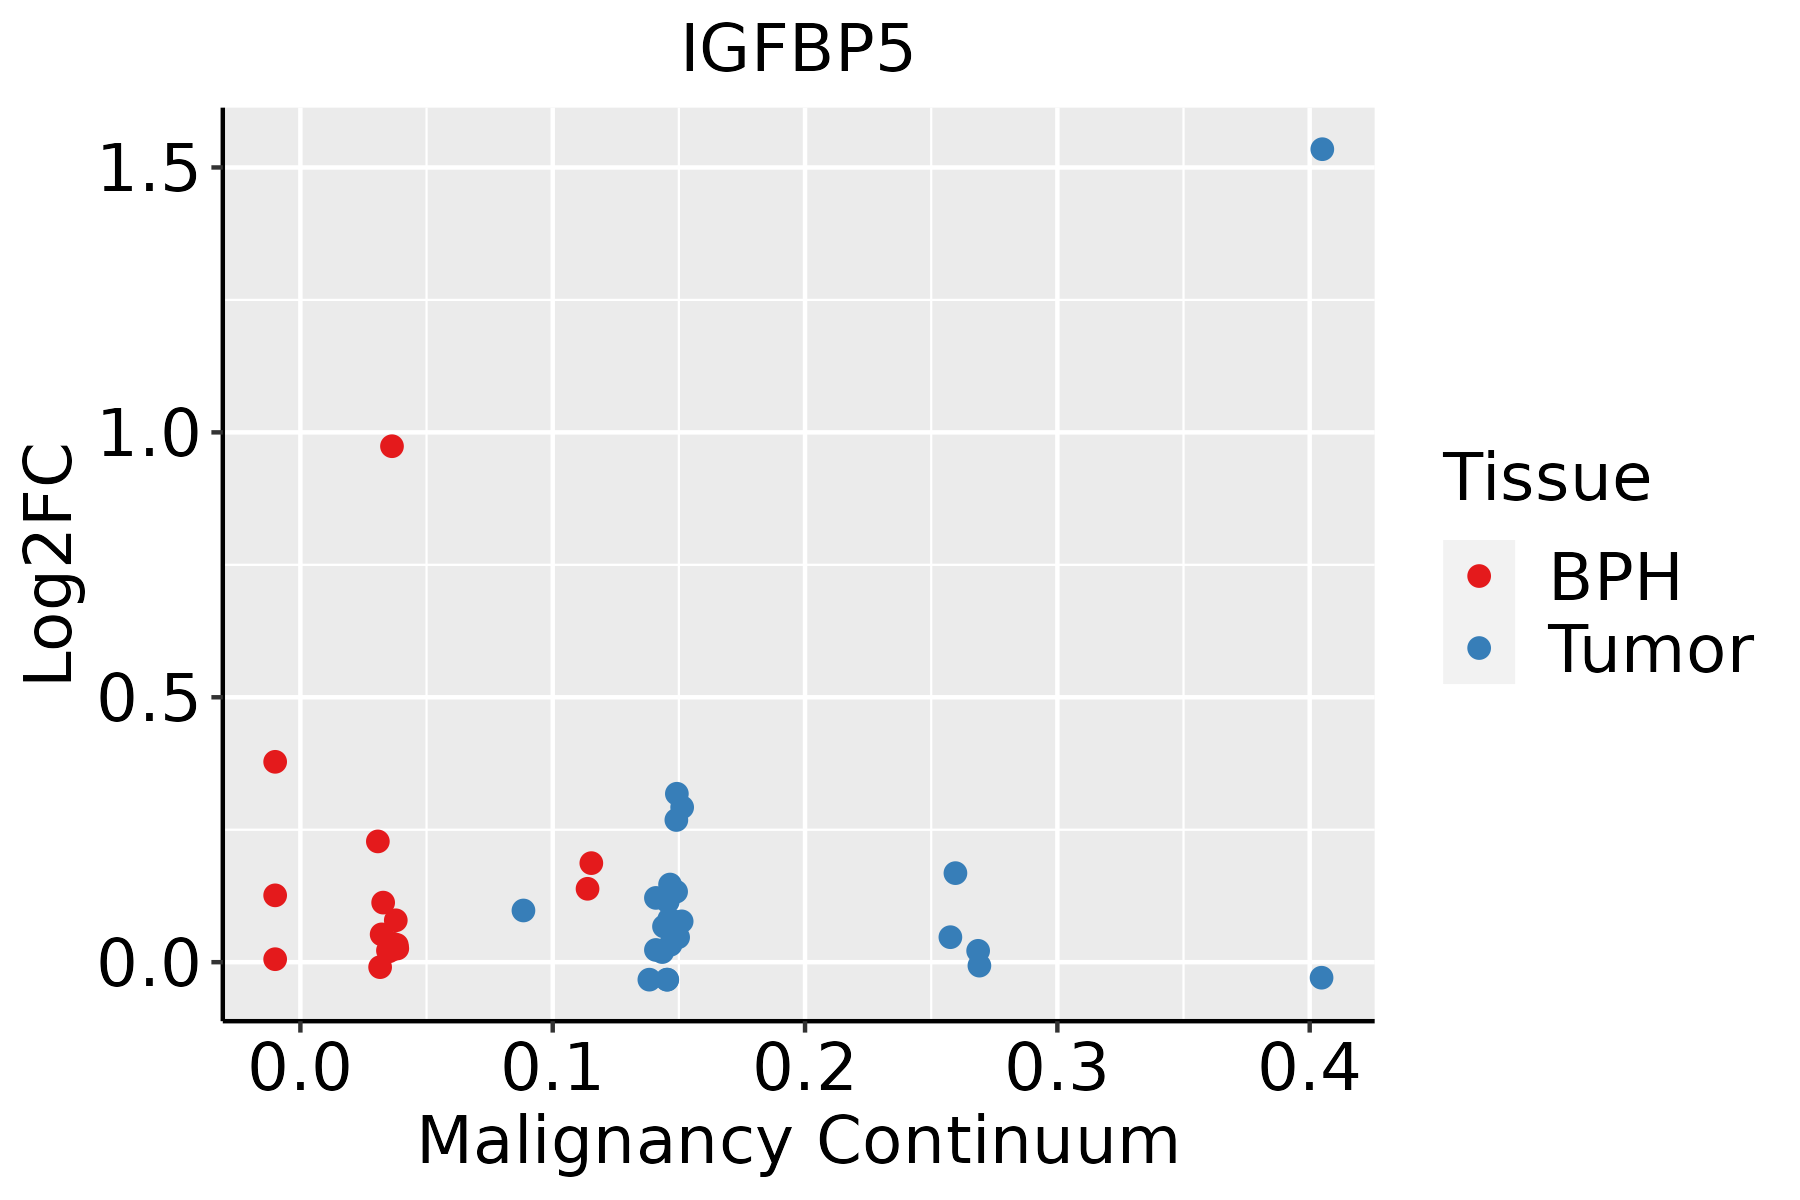 | BPH: Benign Prostatic Hyperplasia |
| Skin |  | AK: Actinic keratosis |
| cSCC: Cutaneous squamous cell carcinoma | ||
| SCCIS:squamous cell carcinoma in situ | ||
| Thyroid | 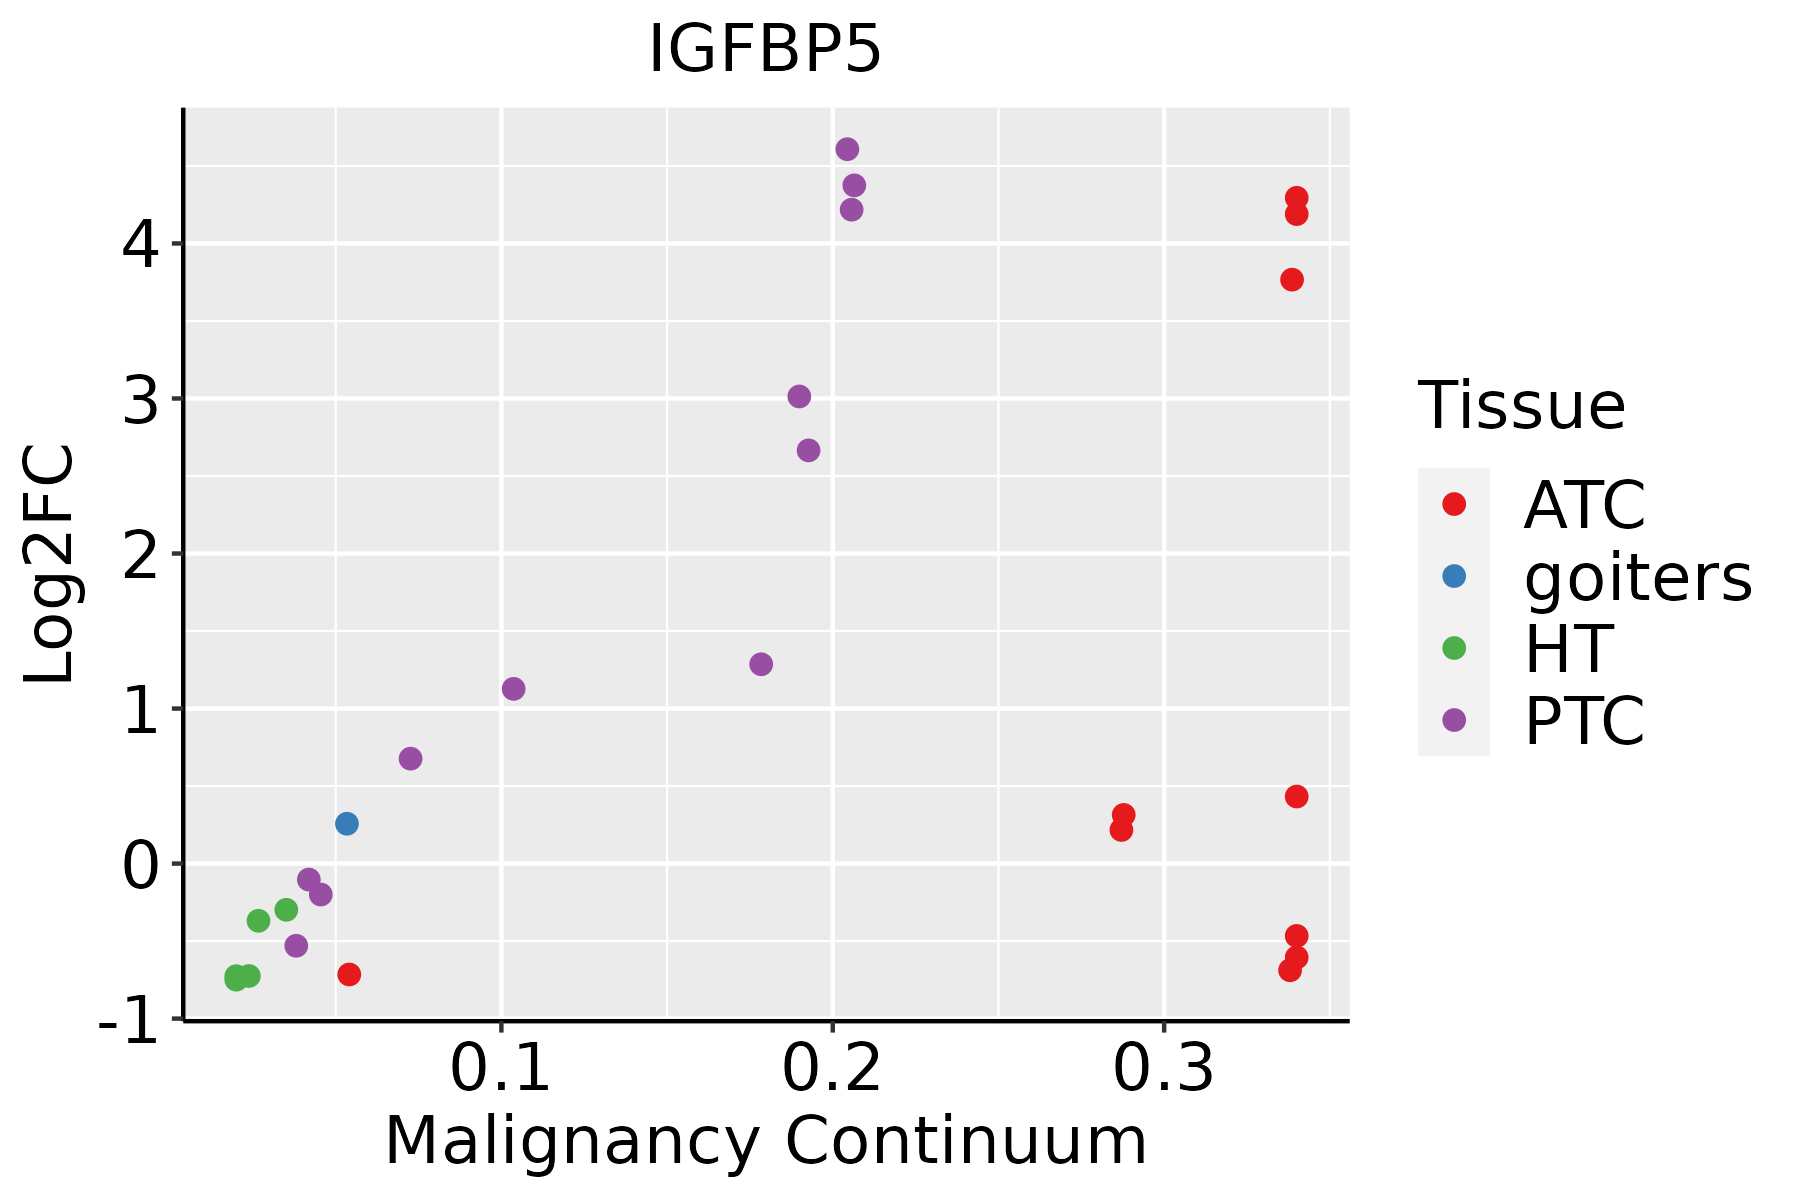 | ATC: Anaplastic thyroid cancer |
| HT: Hashimoto's thyroiditis | ||
| PTC: Papillary thyroid cancer |
| ∗log2FC in expression of this searched gene in stem-like cells from each diseased tissue sample relative to stem-like cells in normal samples in each tissue plotted against the malignancy continuum. Samples are colored based on if they are from different disease stage. |
Top |
Malignant transformation related pathway analysis |
| Find out the enriched GO biological processes and KEGG pathways involved in transition from healthy to precancer to cancer |
| Tissue | Disease Stage | Enriched GO biological Processes |
| Colorectum | AD |  |
| Colorectum | SER |  |
| Colorectum | MSS |  |
| Colorectum | MSI-H |  |
| Colorectum | FAP |  |
| ∗Top 15 enriched GO BP terms are showed in the bar plot of each disease state in each tissue. Each row represents a significant GO biological process which is colored according to the -log10(p.adjust). |
| Page: 1 2 3 4 5 6 7 8 9 |
| GO ID | Tissue | Disease Stage | Description | Gene Ratio | Bg Ratio | pvalue | p.adjust | Count |
| GO:00435025 | Prostate | BPH | regulation of muscle adaptation | 31/3107 | 98/18723 | 1.75e-04 | 1.50e-03 | 31 |
| GO:009025710 | Prostate | BPH | regulation of muscle system process | 64/3107 | 252/18723 | 2.26e-04 | 1.81e-03 | 64 |
| GO:00147452 | Prostate | BPH | negative regulation of muscle adaptation | 8/3107 | 13/18723 | 3.33e-04 | 2.52e-03 | 8 |
| GO:00030127 | Prostate | BPH | muscle system process | 103/3107 | 452/18723 | 3.54e-04 | 2.62e-03 | 103 |
| GO:005159118 | Prostate | BPH | response to cAMP | 29/3107 | 93/18723 | 3.66e-04 | 2.71e-03 | 29 |
| GO:00303237 | Prostate | BPH | respiratory tube development | 48/3107 | 181/18723 | 4.65e-04 | 3.33e-03 | 48 |
| GO:00303247 | Prostate | BPH | lung development | 47/3107 | 177/18723 | 5.13e-04 | 3.63e-03 | 47 |
| GO:00426926 | Prostate | BPH | muscle cell differentiation | 88/3107 | 384/18723 | 7.59e-04 | 5.01e-03 | 88 |
| GO:00330023 | Prostate | BPH | muscle cell proliferation | 61/3107 | 248/18723 | 7.61e-04 | 5.02e-03 | 61 |
| GO:00486605 | Prostate | BPH | regulation of smooth muscle cell proliferation | 47/3107 | 180/18723 | 7.63e-04 | 5.03e-03 | 47 |
| GO:00486595 | Prostate | BPH | smooth muscle cell proliferation | 47/3107 | 184/18723 | 1.26e-03 | 7.62e-03 | 47 |
| GO:00148122 | Prostate | BPH | muscle cell migration | 31/3107 | 110/18723 | 1.56e-03 | 9.16e-03 | 31 |
| GO:001407416 | Prostate | BPH | response to purine-containing compound | 39/3107 | 148/18723 | 1.71e-03 | 9.84e-03 | 39 |
| GO:00435002 | Prostate | BPH | muscle adaptation | 33/3107 | 121/18723 | 2.04e-03 | 1.15e-02 | 33 |
| GO:00605415 | Prostate | BPH | respiratory system development | 50/3107 | 203/18723 | 2.09e-03 | 1.17e-02 | 50 |
| GO:004668316 | Prostate | BPH | response to organophosphorus | 35/3107 | 131/18723 | 2.23e-03 | 1.23e-02 | 35 |
| GO:00149093 | Prostate | BPH | smooth muscle cell migration | 27/3107 | 97/18723 | 3.65e-03 | 1.85e-02 | 27 |
| GO:004259315 | Prostate | BPH | glucose homeostasis | 59/3107 | 258/18723 | 5.38e-03 | 2.50e-02 | 59 |
| GO:003350015 | Prostate | BPH | carbohydrate homeostasis | 59/3107 | 259/18723 | 5.86e-03 | 2.72e-02 | 59 |
| GO:00423032 | Prostate | BPH | molting cycle | 28/3107 | 107/18723 | 7.85e-03 | 3.43e-02 | 28 |
| Page: 1 2 3 4 5 6 7 8 9 10 11 12 13 14 15 16 17 18 19 20 21 22 23 24 25 26 27 28 29 30 31 32 33 34 |
| Pathway ID | Tissue | Disease Stage | Description | Gene Ratio | Bg Ratio | pvalue | p.adjust | qvalue | Count |
| Page: 1 |
Top |
Cell-cell communication analysis |
| Identification of potential cell-cell interactions between two cell types and their ligand-receptor pairs for different disease states |
| Ligand | Receptor | LRpair | Pathway | Tissue | Disease Stage |
| Page: 1 |
Top |
Single-cell gene regulatory network inference analysis |
| Find out the significant the regulons (TFs) and the target genes of each regulon across cell types for different disease states |
| TF | Cell Type | Tissue | Disease Stage | Target Gene | RSS | Regulon Activity |
| ∗The dot plots of a searched regulon are shown for all cell subpopulations in each disease state of each tissue based on the regulon specific score inferred using pySCENIC and by calculating the average expression. |
| Page: 1 |
Top |
Somatic mutation of malignant transformation related genes |
| Annotation of somatic variants for genes involved in malignant transformation |
| Hugo Symbol | Variant Class | Variant Classification | dbSNP RS | HGVSc | HGVSp | HGVSp Short | SWISSPROT | BIOTYPE | SIFT | PolyPhen | Tumor Sample Barcode | Tissue | Histology | Sex | Age | Stage | Therapy Types | Drugs | Outcome |
| IGFBP5 | SNV | Missense_Mutation | novel | c.388N>A | p.Glu130Lys | p.E130K | P24593 | protein_coding | tolerated(0.46) | benign(0.109) | TCGA-OL-A5DA-01 | Breast | breast invasive carcinoma | Female | <65 | I/II | Unknown | Unknown | SD |
| IGFBP5 | SNV | Missense_Mutation | novel | c.337G>C | p.Glu113Gln | p.E113Q | P24593 | protein_coding | tolerated(0.4) | benign(0.29) | TCGA-PN-A8MA-01 | Cervix | cervical & endocervical cancer | Female | <65 | I/II | Chemotherapy | cisplatin | SD |
| IGFBP5 | SNV | Missense_Mutation | novel | c.503G>A | p.Gly168Glu | p.G168E | P24593 | protein_coding | tolerated(0.52) | benign(0.031) | TCGA-VS-A9UH-01 | Cervix | cervical & endocervical cancer | Female | <65 | I/II | Chemotherapy | cisplatin | CR |
| IGFBP5 | SNV | Missense_Mutation | novel | c.319N>T | p.Arg107Cys | p.R107C | P24593 | protein_coding | deleterious(0) | benign(0.001) | TCGA-AG-3575-01 | Colorectum | rectum adenocarcinoma | Male | <65 | I/II | Unknown | Unknown | SD |
| IGFBP5 | SNV | Missense_Mutation | novel | c.724N>G | p.Trp242Gly | p.W242G | P24593 | protein_coding | deleterious(0) | probably_damaging(0.992) | TCGA-F5-6814-01 | Colorectum | rectum adenocarcinoma | Male | <65 | I/II | Unknown | Unknown | SD |
| IGFBP5 | SNV | Missense_Mutation | novel | c.577C>T | p.Arg193Cys | p.R193C | P24593 | protein_coding | deleterious(0) | probably_damaging(0.998) | TCGA-A5-A1OF-01 | Endometrium | uterine corpus endometrioid carcinoma | Female | <65 | I/II | Unknown | Unknown | SD |
| IGFBP5 | SNV | Missense_Mutation | rs780625278 | c.661N>T | p.Arg221Cys | p.R221C | P24593 | protein_coding | deleterious(0) | probably_damaging(0.998) | TCGA-AP-A051-01 | Endometrium | uterine corpus endometrioid carcinoma | Female | >=65 | I/II | Unknown | Unknown | SD |
| IGFBP5 | SNV | Missense_Mutation | c.538N>T | p.Ala180Ser | p.A180S | P24593 | protein_coding | tolerated(0.86) | benign(0.021) | TCGA-BS-A0VI-01 | Endometrium | uterine corpus endometrioid carcinoma | Female | <65 | I/II | Unknown | Unknown | SD | |
| IGFBP5 | SNV | Missense_Mutation | rs763073487 | c.526C>T | p.Arg176Trp | p.R176W | P24593 | protein_coding | tolerated(0.06) | possibly_damaging(0.551) | TCGA-D1-A16X-01 | Endometrium | uterine corpus endometrioid carcinoma | Female | <65 | I/II | Unknown | Unknown | SD |
| IGFBP5 | SNV | Missense_Mutation | c.603G>T | p.Gln201His | p.Q201H | P24593 | protein_coding | tolerated(0.07) | possibly_damaging(0.683) | TCGA-D1-A174-01 | Endometrium | uterine corpus endometrioid carcinoma | Female | <65 | I/II | Unknown | Unknown | SD |
| Page: 1 2 3 |
Top |
Related drugs of malignant transformation related genes |
| Identification of chemicals and drugs interact with genes involved in malignant transfromation |
| (DGIdb 4.0) |
| Entrez ID | Symbol | Category | Interaction Types | Drug Claim Name | Drug Name | PMIDs |
| 3488 | IGFBP5 | DRUGGABLE GENOME | TGFBETA1 | 16214131 | ||
| 3488 | IGFBP5 | DRUGGABLE GENOME | DHT | ANDROSTANOLONE | 16368782 |
| Page: 1 |

Copyright 2023-Present -The University of Texas Health Science Center at Houston |