
|
|||||
|
 | |
| |
| |
| |
| |
| |
|
Gene: ERO1A |
Gene summary for ERO1A |
| Gene information | Species | Human | Gene symbol | ERO1A | Gene ID | 30001 |
| Gene name | endoplasmic reticulum oxidoreductase 1 alpha | |
| Gene Alias | ERO1-L | |
| Cytomap | 14q22.1 | |
| Gene Type | protein-coding | GO ID | GO:0001666 | UniProtAcc | Q96HE7 |
Top |
Malignant transformation analysis |
| Identification of the aberrant gene expression in precancerous and cancerous lesions by comparing the gene expression of stem-like cells in diseased tissues with normal stem cells |
| Entrez ID | Symbol | Replicates | Species | Organ | Tissue | Adj P-value | Log2FC | Malignancy |
| 30001 | ERO1A | GSM4909286 | Human | Breast | IDC | 5.54e-12 | -3.59e-01 | 0.1081 |
| 30001 | ERO1A | GSM4909291 | Human | Breast | IDC | 7.33e-03 | -3.24e-01 | 0.1753 |
| 30001 | ERO1A | GSM4909292 | Human | Breast | IDC | 2.27e-12 | 1.06e+00 | 0.1236 |
| 30001 | ERO1A | GSM4909293 | Human | Breast | IDC | 2.64e-03 | -2.52e-01 | 0.1581 |
| 30001 | ERO1A | GSM4909294 | Human | Breast | IDC | 1.38e-06 | -3.34e-01 | 0.2022 |
| 30001 | ERO1A | GSM4909296 | Human | Breast | IDC | 1.04e-14 | -3.57e-01 | 0.1524 |
| 30001 | ERO1A | GSM4909297 | Human | Breast | IDC | 7.23e-10 | -3.15e-01 | 0.1517 |
| 30001 | ERO1A | GSM4909298 | Human | Breast | IDC | 3.38e-11 | -3.64e-01 | 0.1551 |
| 30001 | ERO1A | GSM4909299 | Human | Breast | IDC | 3.27e-07 | -3.18e-01 | 0.035 |
| 30001 | ERO1A | GSM4909301 | Human | Breast | IDC | 7.09e-10 | -3.24e-01 | 0.1577 |
| 30001 | ERO1A | GSM4909306 | Human | Breast | IDC | 3.23e-07 | -3.35e-01 | 0.1564 |
| 30001 | ERO1A | GSM4909307 | Human | Breast | IDC | 1.11e-05 | -3.14e-01 | 0.1569 |
| 30001 | ERO1A | GSM4909308 | Human | Breast | IDC | 2.09e-02 | -2.80e-01 | 0.158 |
| 30001 | ERO1A | GSM4909309 | Human | Breast | IDC | 1.91e-07 | -3.33e-01 | 0.0483 |
| 30001 | ERO1A | GSM4909311 | Human | Breast | IDC | 1.76e-13 | -3.38e-01 | 0.1534 |
| 30001 | ERO1A | GSM4909312 | Human | Breast | IDC | 2.77e-09 | -3.17e-01 | 0.1552 |
| 30001 | ERO1A | GSM4909313 | Human | Breast | IDC | 9.28e-05 | -2.95e-01 | 0.0391 |
| 30001 | ERO1A | GSM4909315 | Human | Breast | IDC | 1.20e-07 | 4.10e-01 | 0.21 |
| 30001 | ERO1A | GSM4909319 | Human | Breast | IDC | 6.58e-19 | -3.80e-01 | 0.1563 |
| 30001 | ERO1A | GSM4909320 | Human | Breast | IDC | 1.86e-02 | -3.35e-01 | 0.1575 |
| Page: 1 2 3 4 5 6 7 8 9 10 |
| Tissue | Expression Dynamics | Abbreviation |
| Breast |  | IDC: Invasive ductal carcinoma |
| DCIS: Ductal carcinoma in situ | ||
| Precancer(BRCA1-mut): Precancerous lesion from BRCA1 mutation carriers | ||
| Cervix | 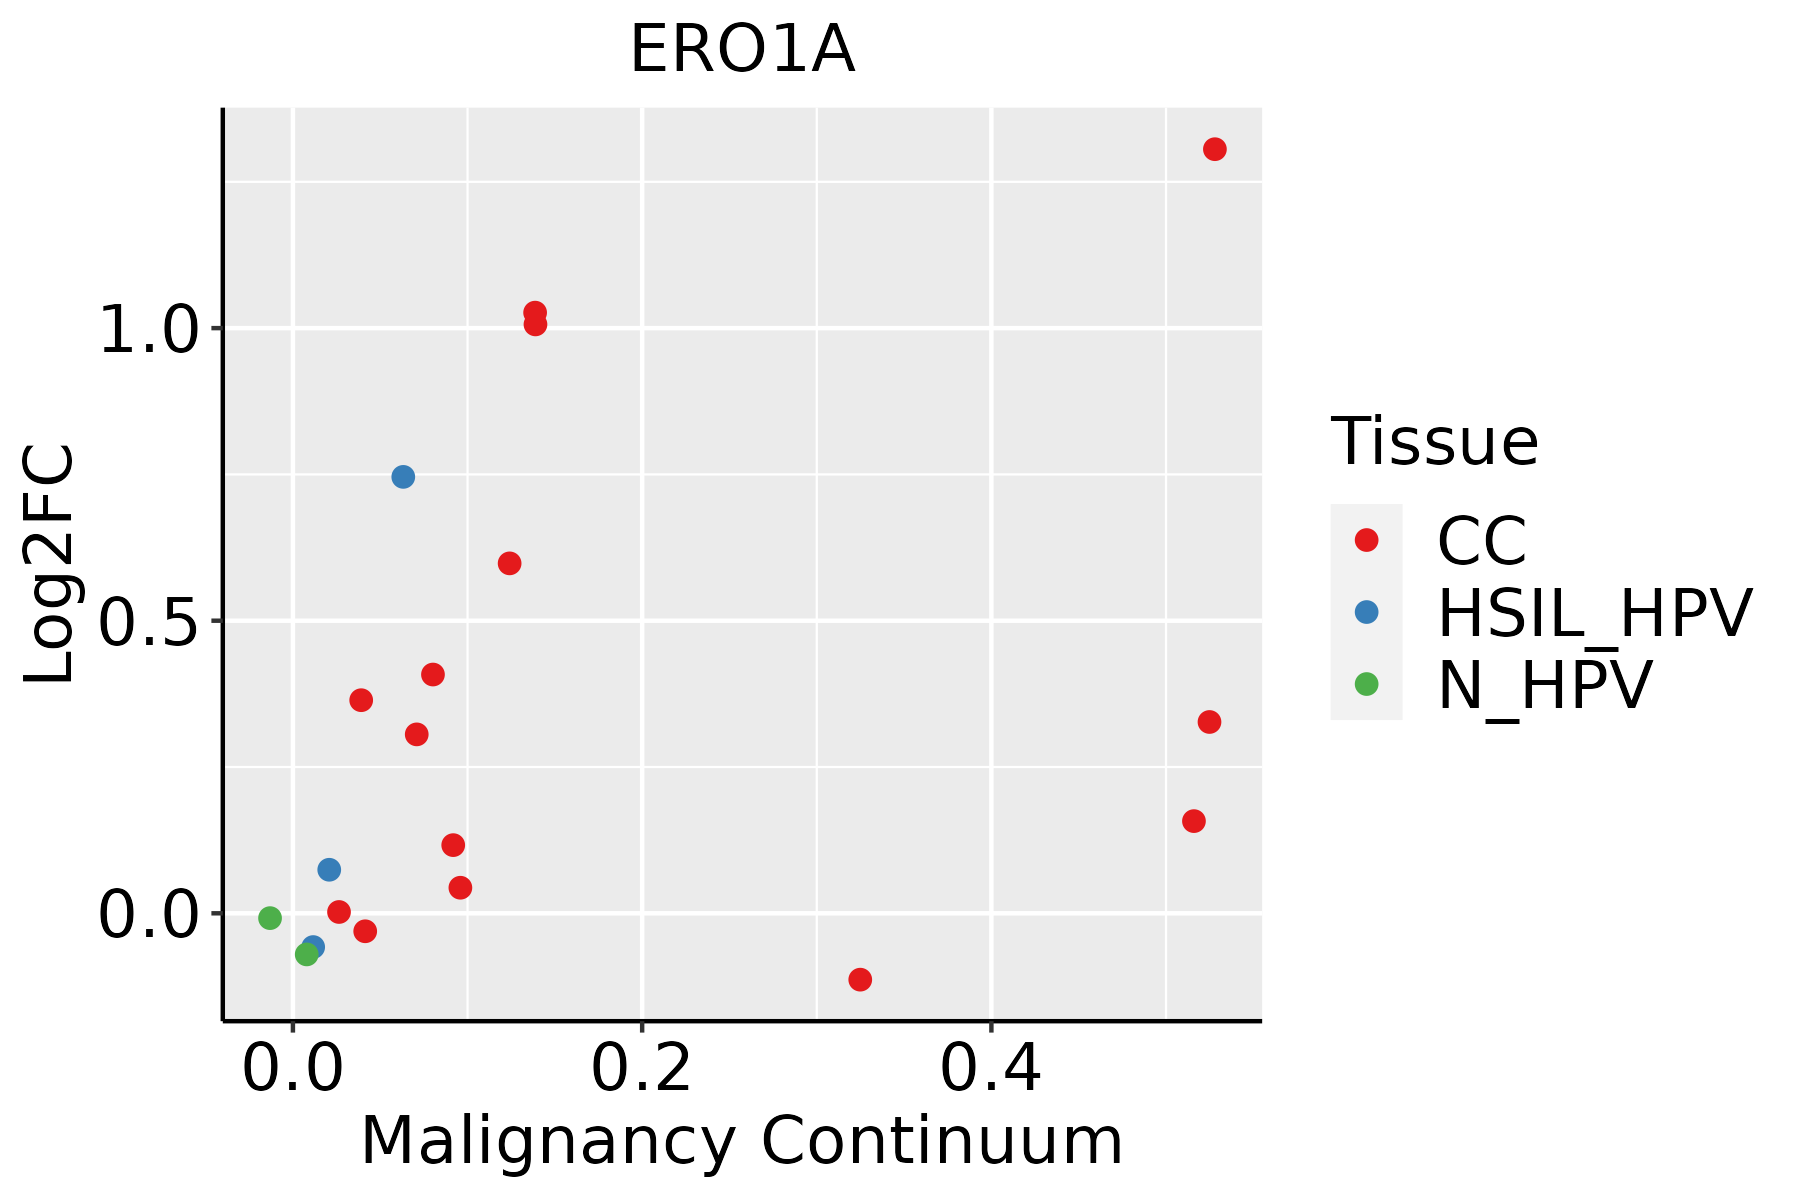 | CC: Cervix cancer |
| HSIL_HPV: HPV-infected high-grade squamous intraepithelial lesions | ||
| N_HPV: HPV-infected normal cervix | ||
| Esophagus |  | ESCC: Esophageal squamous cell carcinoma |
| HGIN: High-grade intraepithelial neoplasias | ||
| LGIN: Low-grade intraepithelial neoplasias | ||
| GC |  | CAG: Chronic atrophic gastritis |
| CAG with IM: Chronic atrophic gastritis with intestinal metaplasia | ||
| CSG: Chronic superficial gastritis | ||
| GC: Gastric cancer | ||
| SIM: Severe intestinal metaplasia | ||
| WIM: Wild intestinal metaplasia | ||
| Liver |  | HCC: Hepatocellular carcinoma |
| NAFLD: Non-alcoholic fatty liver disease | ||
| Lung | 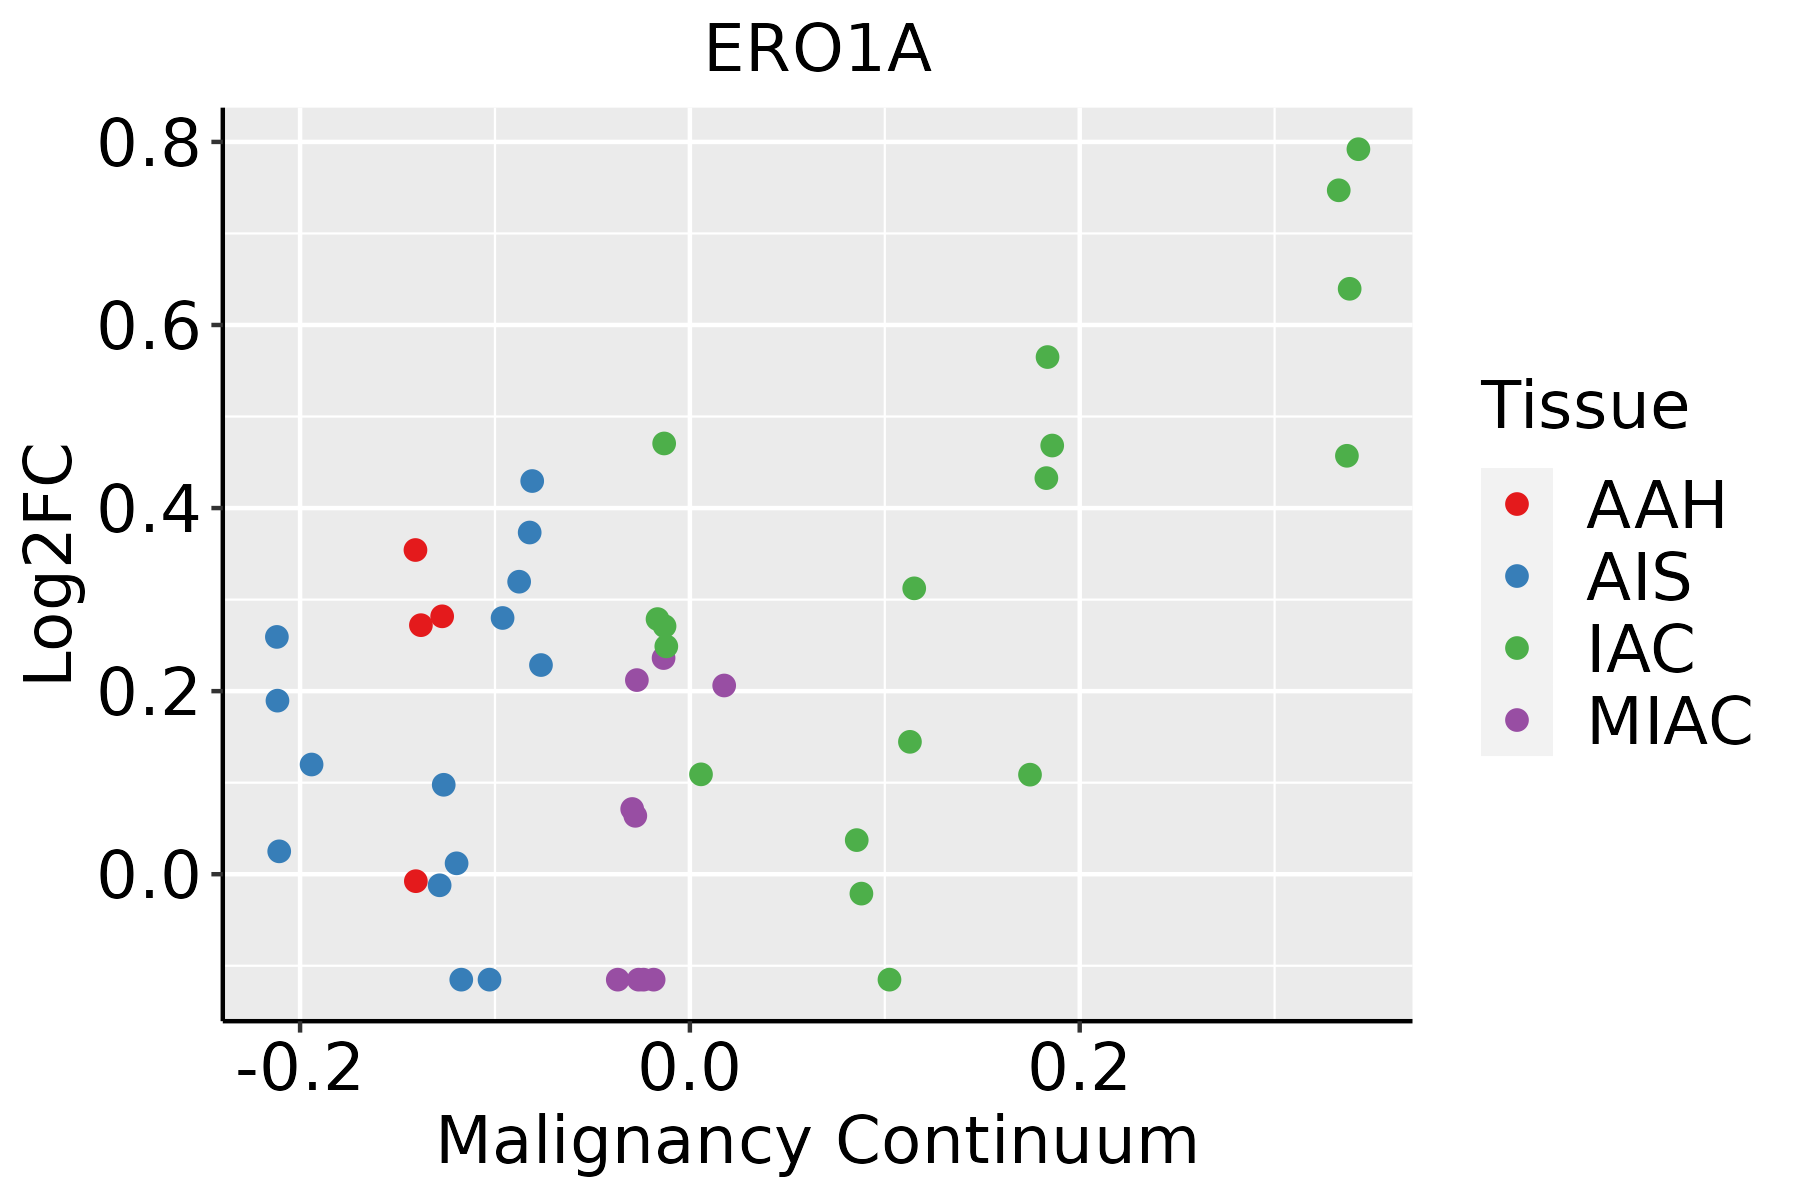 | AAH: Atypical adenomatous hyperplasia |
| AIS: Adenocarcinoma in situ | ||
| IAC: Invasive lung adenocarcinoma | ||
| MIA: Minimally invasive adenocarcinoma | ||
| Oral Cavity | 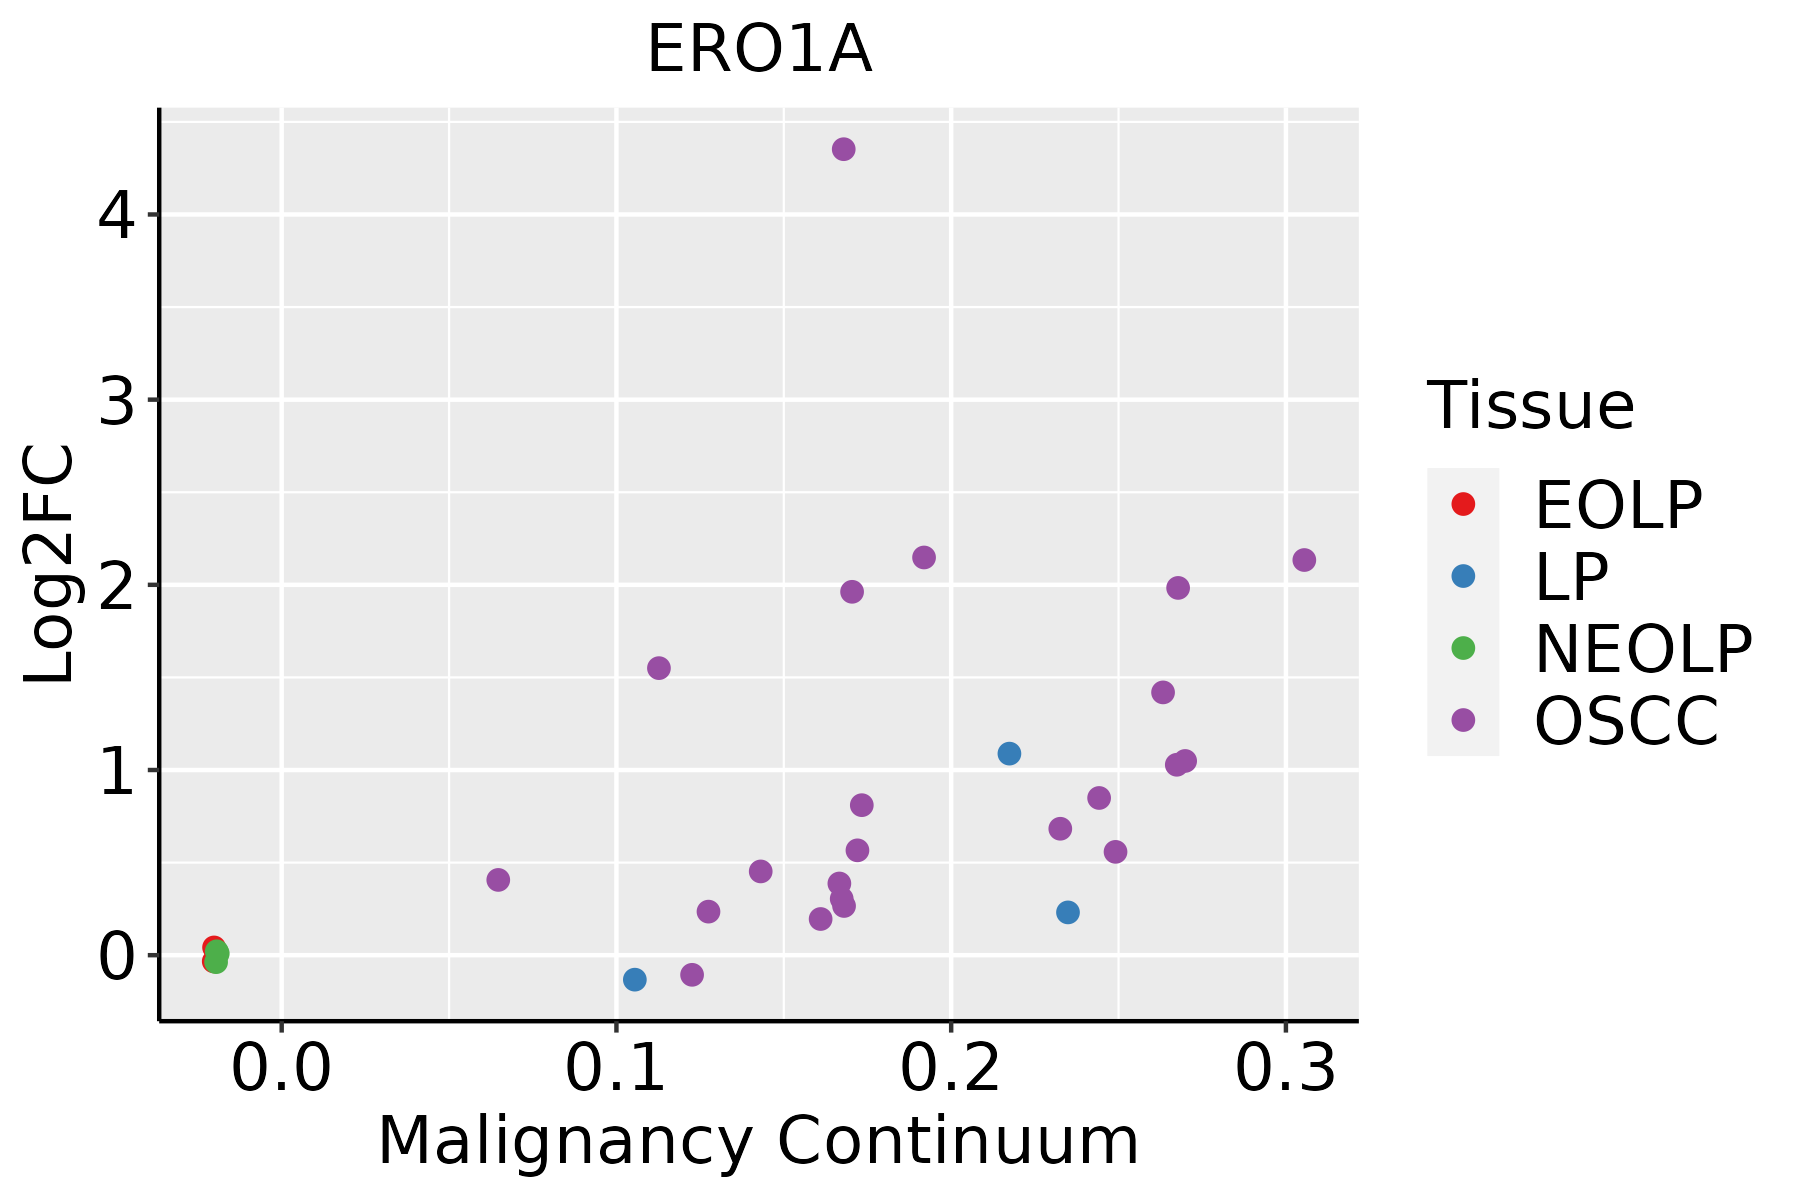 | EOLP: Erosive Oral lichen planus |
| LP: leukoplakia | ||
| NEOLP: Non-erosive oral lichen planus | ||
| OSCC: Oral squamous cell carcinoma | ||
| Thyroid | 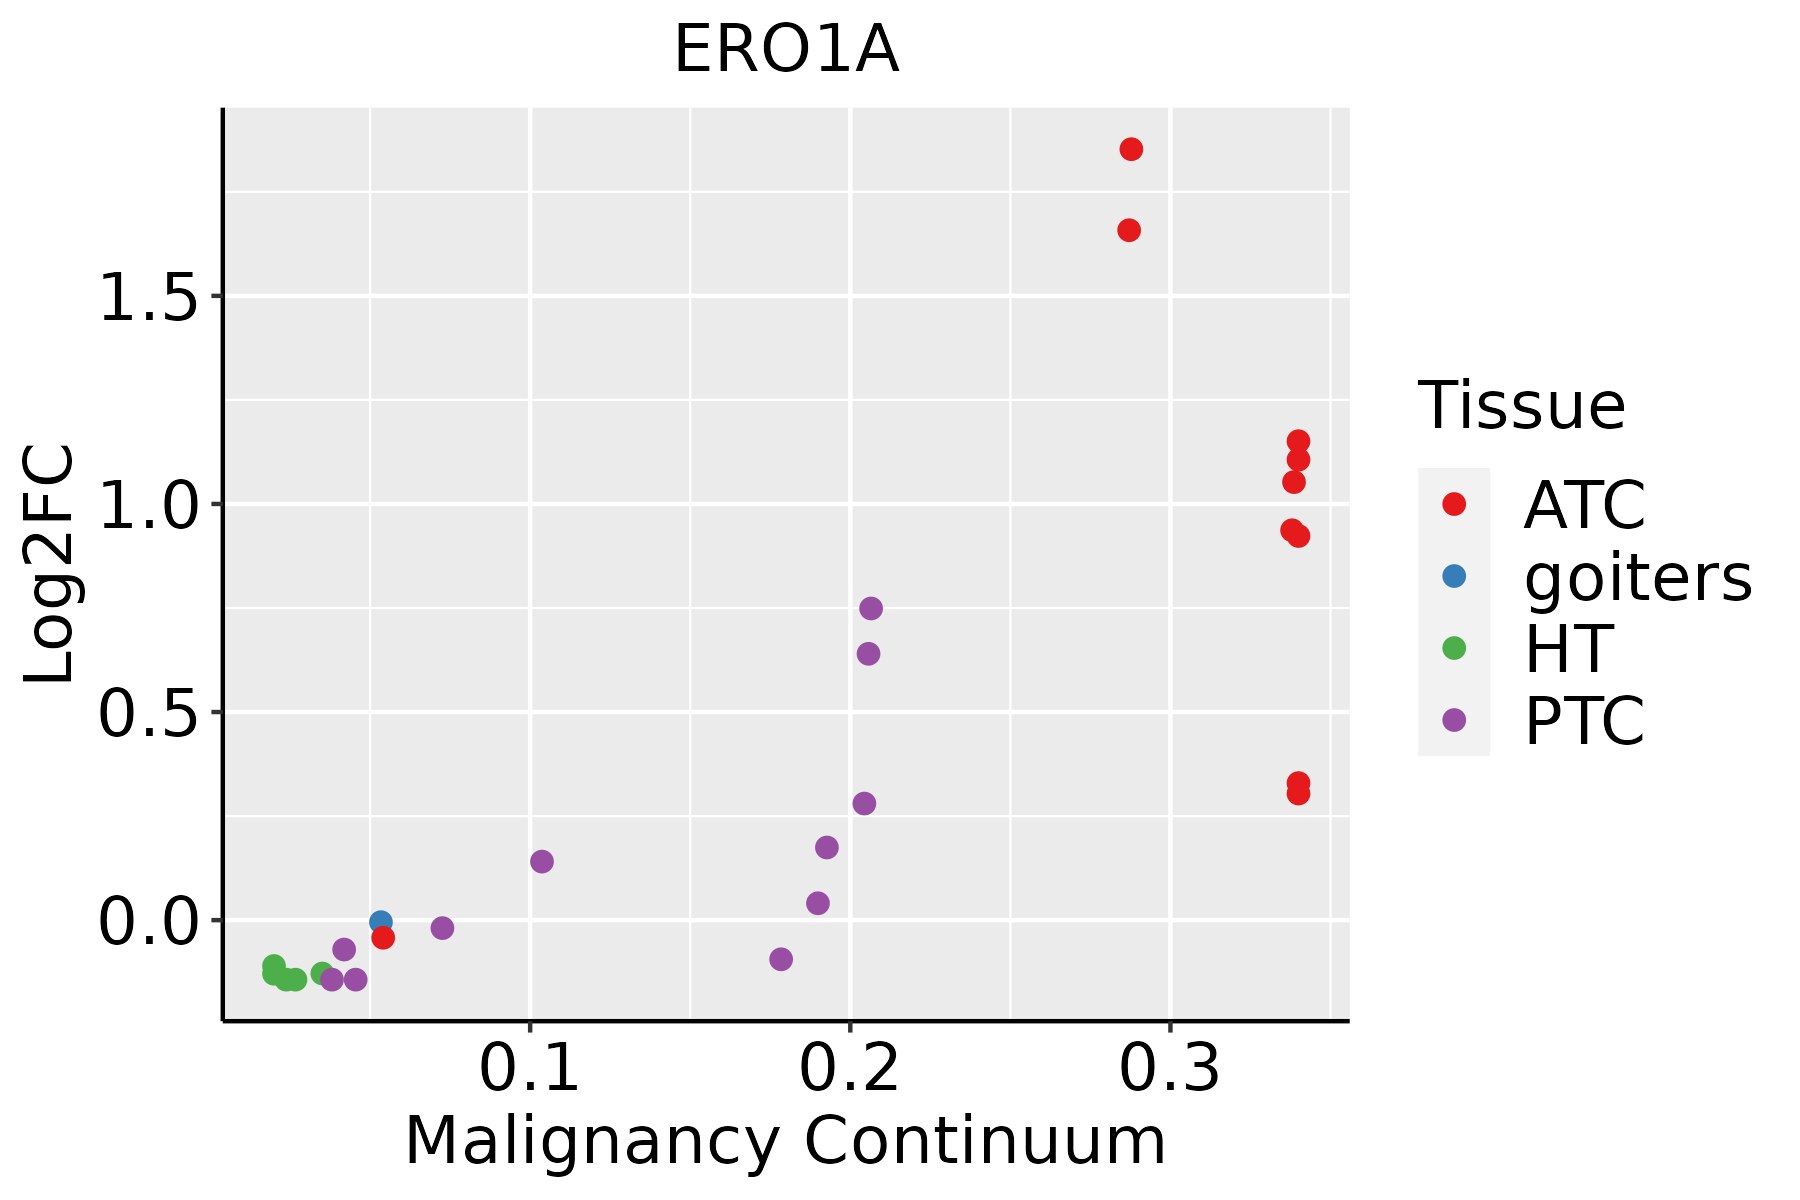 | ATC: Anaplastic thyroid cancer |
| HT: Hashimoto's thyroiditis | ||
| PTC: Papillary thyroid cancer |
| ∗log2FC in expression of this searched gene in stem-like cells from each diseased tissue sample relative to stem-like cells in normal samples in each tissue plotted against the malignancy continuum. Samples are colored based on if they are from different disease stage. |
Top |
Malignant transformation related pathway analysis |
| Find out the enriched GO biological processes and KEGG pathways involved in transition from healthy to precancer to cancer |
| Tissue | Disease Stage | Enriched GO biological Processes |
| Colorectum | AD |  |
| Colorectum | SER |  |
| Colorectum | MSS |  |
| Colorectum | MSI-H |  |
| Colorectum | FAP |  |
| ∗Top 15 enriched GO BP terms are showed in the bar plot of each disease state in each tissue. Each row represents a significant GO biological process which is colored according to the -log10(p.adjust). |
| Page: 1 2 3 4 5 6 7 8 9 |
| GO ID | Tissue | Disease Stage | Description | Gene Ratio | Bg Ratio | pvalue | p.adjust | Count |
| GO:009719331 | Stomach | CAG | intrinsic apoptotic signaling pathway | 31/552 | 288/18723 | 5.37e-10 | 1.47e-07 | 31 |
| GO:005108531 | Stomach | CAG | chaperone cofactor-dependent protein refolding | 11/552 | 34/18723 | 2.05e-09 | 3.66e-07 | 11 |
| GO:00349753 | Stomach | CAG | protein folding in endoplasmic reticulum | 7/552 | 11/18723 | 5.55e-09 | 7.99e-07 | 7 |
| GO:005108431 | Stomach | CAG | 'de novo' posttranslational protein folding | 11/552 | 39/18723 | 1.05e-08 | 1.38e-06 | 11 |
| GO:003462031 | Stomach | CAG | cellular response to unfolded protein | 15/552 | 96/18723 | 1.33e-07 | 1.18e-05 | 15 |
| GO:000697931 | Stomach | CAG | response to oxidative stress | 33/552 | 446/18723 | 1.33e-06 | 8.49e-05 | 33 |
| GO:00092663 | Stomach | CAG | response to temperature stimulus | 19/552 | 178/18723 | 1.38e-06 | 8.67e-05 | 19 |
| GO:003596731 | Stomach | CAG | cellular response to topologically incorrect protein | 15/552 | 116/18723 | 1.62e-06 | 9.65e-05 | 15 |
| GO:003497631 | Stomach | CAG | response to endoplasmic reticulum stress | 21/552 | 256/18723 | 2.51e-05 | 9.03e-04 | 21 |
| GO:003629331 | Stomach | CAG | response to decreased oxygen levels | 24/552 | 322/18723 | 3.28e-05 | 1.09e-03 | 24 |
| GO:007048231 | Stomach | CAG | response to oxygen levels | 25/552 | 347/18723 | 3.97e-05 | 1.28e-03 | 25 |
| GO:005165131 | Stomach | CAG | maintenance of location in cell | 18/552 | 214/18723 | 6.79e-05 | 1.89e-03 | 18 |
| GO:00512353 | Stomach | CAG | maintenance of location | 23/552 | 327/18723 | 1.15e-04 | 2.85e-03 | 23 |
| GO:000166631 | Stomach | CAG | response to hypoxia | 22/552 | 307/18723 | 1.23e-04 | 3.03e-03 | 22 |
| GO:00075683 | Stomach | CAG | aging | 23/552 | 339/18723 | 1.95e-04 | 4.23e-03 | 23 |
| GO:00454543 | Stomach | CAG | cell redox homeostasis | 6/552 | 35/18723 | 5.01e-04 | 8.50e-03 | 6 |
| GO:00309683 | Stomach | CAG | endoplasmic reticulum unfolded protein response | 8/552 | 74/18723 | 1.48e-03 | 1.83e-02 | 8 |
| GO:00182082 | Stomach | CAG | peptidyl-proline modification | 7/552 | 58/18723 | 1.52e-03 | 1.86e-02 | 7 |
| GO:007005931 | Stomach | CAG | intrinsic apoptotic signaling pathway in response to endoplasmic reticulum stress | 7/552 | 63/18723 | 2.47e-03 | 2.62e-02 | 7 |
| GO:00362942 | Stomach | CAG | cellular response to decreased oxygen levels | 12/552 | 161/18723 | 2.99e-03 | 3.00e-02 | 12 |
| Page: 1 2 3 4 5 6 7 8 9 10 11 12 13 14 15 16 17 18 19 20 21 22 23 24 25 |
| Pathway ID | Tissue | Disease Stage | Description | Gene Ratio | Bg Ratio | pvalue | p.adjust | qvalue | Count |
| hsa0414118 | Breast | Precancer | Protein processing in endoplasmic reticulum | 33/684 | 174/8465 | 2.78e-06 | 3.83e-05 | 2.94e-05 | 33 |
| hsa0541718 | Breast | Precancer | Lipid and atherosclerosis | 37/684 | 215/8465 | 7.64e-06 | 9.29e-05 | 7.12e-05 | 37 |
| hsa0511014 | Breast | Precancer | Vibrio cholerae infection | 14/684 | 50/8465 | 2.67e-05 | 2.64e-04 | 2.02e-04 | 14 |
| hsa0414119 | Breast | Precancer | Protein processing in endoplasmic reticulum | 33/684 | 174/8465 | 2.78e-06 | 3.83e-05 | 2.94e-05 | 33 |
| hsa0541719 | Breast | Precancer | Lipid and atherosclerosis | 37/684 | 215/8465 | 7.64e-06 | 9.29e-05 | 7.12e-05 | 37 |
| hsa0511015 | Breast | Precancer | Vibrio cholerae infection | 14/684 | 50/8465 | 2.67e-05 | 2.64e-04 | 2.02e-04 | 14 |
| hsa0511022 | Breast | IDC | Vibrio cholerae infection | 17/867 | 50/8465 | 4.82e-06 | 6.82e-05 | 5.10e-05 | 17 |
| hsa0414124 | Breast | IDC | Protein processing in endoplasmic reticulum | 36/867 | 174/8465 | 2.73e-05 | 2.86e-04 | 2.14e-04 | 36 |
| hsa0541724 | Breast | IDC | Lipid and atherosclerosis | 35/867 | 215/8465 | 3.67e-03 | 2.29e-02 | 1.71e-02 | 35 |
| hsa0511032 | Breast | IDC | Vibrio cholerae infection | 17/867 | 50/8465 | 4.82e-06 | 6.82e-05 | 5.10e-05 | 17 |
| hsa0414134 | Breast | IDC | Protein processing in endoplasmic reticulum | 36/867 | 174/8465 | 2.73e-05 | 2.86e-04 | 2.14e-04 | 36 |
| hsa0541734 | Breast | IDC | Lipid and atherosclerosis | 35/867 | 215/8465 | 3.67e-03 | 2.29e-02 | 1.71e-02 | 35 |
| hsa0511041 | Breast | DCIS | Vibrio cholerae infection | 17/846 | 50/8465 | 3.45e-06 | 4.45e-05 | 3.28e-05 | 17 |
| hsa0414143 | Breast | DCIS | Protein processing in endoplasmic reticulum | 36/846 | 174/8465 | 1.60e-05 | 1.91e-04 | 1.41e-04 | 36 |
| hsa0541744 | Breast | DCIS | Lipid and atherosclerosis | 34/846 | 215/8465 | 4.50e-03 | 2.46e-02 | 1.82e-02 | 34 |
| hsa0511051 | Breast | DCIS | Vibrio cholerae infection | 17/846 | 50/8465 | 3.45e-06 | 4.45e-05 | 3.28e-05 | 17 |
| hsa0414153 | Breast | DCIS | Protein processing in endoplasmic reticulum | 36/846 | 174/8465 | 1.60e-05 | 1.91e-04 | 1.41e-04 | 36 |
| hsa0541754 | Breast | DCIS | Lipid and atherosclerosis | 34/846 | 215/8465 | 4.50e-03 | 2.46e-02 | 1.82e-02 | 34 |
| hsa0541720 | Cervix | CC | Lipid and atherosclerosis | 65/1267 | 215/8465 | 6.47e-09 | 1.10e-07 | 6.52e-08 | 65 |
| hsa0414120 | Cervix | CC | Protein processing in endoplasmic reticulum | 55/1267 | 174/8465 | 1.74e-08 | 2.68e-07 | 1.58e-07 | 55 |
| Page: 1 2 3 4 |
Top |
Cell-cell communication analysis |
| Identification of potential cell-cell interactions between two cell types and their ligand-receptor pairs for different disease states |
| Ligand | Receptor | LRpair | Pathway | Tissue | Disease Stage |
| Page: 1 |
Top |
Single-cell gene regulatory network inference analysis |
| Find out the significant the regulons (TFs) and the target genes of each regulon across cell types for different disease states |
| TF | Cell Type | Tissue | Disease Stage | Target Gene | RSS | Regulon Activity |
| ∗The dot plots of a searched regulon are shown for all cell subpopulations in each disease state of each tissue based on the regulon specific score inferred using pySCENIC and by calculating the average expression. |
| Page: 1 |
Top |
Somatic mutation of malignant transformation related genes |
| Annotation of somatic variants for genes involved in malignant transformation |
| Hugo Symbol | Variant Class | Variant Classification | dbSNP RS | HGVSc | HGVSp | HGVSp Short | SWISSPROT | BIOTYPE | SIFT | PolyPhen | Tumor Sample Barcode | Tissue | Histology | Sex | Age | Stage | Therapy Types | Drugs | Outcome |
| ERO1A | SNV | Missense_Mutation | novel | c.1206G>C | p.Lys402Asn | p.K402N | Q96HE7 | protein_coding | deleterious(0) | probably_damaging(0.996) | TCGA-A8-A08F-01 | Breast | breast invasive carcinoma | Female | <65 | III/IV | Chemotherapy | 5-fluorouracil | CR |
| ERO1A | SNV | Missense_Mutation | rs773034970 | c.157N>G | p.Ile53Val | p.I53V | Q96HE7 | protein_coding | tolerated(0.63) | benign(0.124) | TCGA-A8-A08L-01 | Breast | breast invasive carcinoma | Female | >=65 | III/IV | Unknown | Unknown | SD |
| ERO1A | SNV | Missense_Mutation | novel | c.661N>G | p.Leu221Val | p.L221V | Q96HE7 | protein_coding | tolerated(0.06) | benign(0.34) | TCGA-AN-A0AM-01 | Breast | breast invasive carcinoma | Female | <65 | I/II | Unknown | Unknown | SD |
| ERO1A | SNV | Missense_Mutation | c.325N>A | p.Val109Ile | p.V109I | Q96HE7 | protein_coding | tolerated(0.81) | benign(0.173) | TCGA-B6-A0WV-01 | Breast | breast invasive carcinoma | Female | >=65 | I/II | Unknown | Unknown | SD | |
| ERO1A | SNV | Missense_Mutation | c.1081A>G | p.Asn361Asp | p.N361D | Q96HE7 | protein_coding | tolerated(0.22) | benign(0.348) | TCGA-BH-A0C0-01 | Breast | breast invasive carcinoma | Female | <65 | I/II | Chemotherapy | carboplatin | SD | |
| ERO1A | SNV | Missense_Mutation | novel | c.1315G>A | p.Glu439Lys | p.E439K | Q96HE7 | protein_coding | deleterious(0) | probably_damaging(0.997) | TCGA-DS-A1OB-01 | Cervix | cervical & endocervical cancer | Female | <65 | I/II | Chemotherapy | carboplatin | PD |
| ERO1A | SNV | Missense_Mutation | c.200N>C | p.Lys67Thr | p.K67T | Q96HE7 | protein_coding | tolerated(0.18) | benign(0.055) | TCGA-AA-3510-01 | Colorectum | colon adenocarcinoma | Male | >=65 | I/II | Unknown | Unknown | SD | |
| ERO1A | SNV | Missense_Mutation | c.734G>T | p.Arg245Ile | p.R245I | Q96HE7 | protein_coding | deleterious(0) | probably_damaging(0.999) | TCGA-AA-3977-01 | Colorectum | colon adenocarcinoma | Male | >=65 | I/II | Unknown | Unknown | SD | |
| ERO1A | SNV | Missense_Mutation | novel | c.1163N>C | p.Ile388Thr | p.I388T | Q96HE7 | protein_coding | deleterious(0) | probably_damaging(0.996) | TCGA-AZ-4315-01 | Colorectum | colon adenocarcinoma | Male | <65 | I/II | Unknown | Unknown | SD |
| ERO1A | SNV | Missense_Mutation | novel | c.825G>T | p.Lys275Asn | p.K275N | Q96HE7 | protein_coding | tolerated(0.23) | benign(0.035) | TCGA-CA-6717-01 | Colorectum | colon adenocarcinoma | Male | <65 | I/II | Chemotherapy | oxaliplatin | CR |
| Page: 1 2 3 4 5 |
Top |
Related drugs of malignant transformation related genes |
| Identification of chemicals and drugs interact with genes involved in malignant transfromation |
| (DGIdb 4.0) |
| Entrez ID | Symbol | Category | Interaction Types | Drug Claim Name | Drug Name | PMIDs |
| Page: 1 |

Copyright 2023-Present -The University of Texas Health Science Center at Houston |