
|
|||||
|
 | |
| |
| |
| |
| |
| |
|
Gene: EIF4E |
Gene summary for EIF4E |
| Gene information | Species | Human | Gene symbol | EIF4E | Gene ID | 1977 |
| Gene name | eukaryotic translation initiation factor 4E | |
| Gene Alias | AUTS19 | |
| Cytomap | 4q23 | |
| Gene Type | protein-coding | GO ID | GO:0000082 | UniProtAcc | P06730 |
Top |
Malignant transformation analysis |
| Identification of the aberrant gene expression in precancerous and cancerous lesions by comparing the gene expression of stem-like cells in diseased tissues with normal stem cells |
| Entrez ID | Symbol | Replicates | Species | Organ | Tissue | Adj P-value | Log2FC | Malignancy |
| 1977 | EIF4E | LZE2T | Human | Esophagus | ESCC | 1.23e-03 | 4.59e-01 | 0.082 |
| 1977 | EIF4E | LZE4T | Human | Esophagus | ESCC | 4.05e-14 | 5.47e-01 | 0.0811 |
| 1977 | EIF4E | LZE5T | Human | Esophagus | ESCC | 3.39e-08 | 2.26e-01 | 0.0514 |
| 1977 | EIF4E | LZE7T | Human | Esophagus | ESCC | 3.67e-04 | 4.52e-01 | 0.0667 |
| 1977 | EIF4E | LZE8T | Human | Esophagus | ESCC | 2.20e-09 | 5.09e-01 | 0.067 |
| 1977 | EIF4E | LZE20T | Human | Esophagus | ESCC | 1.73e-05 | 1.76e-01 | 0.0662 |
| 1977 | EIF4E | LZE22T | Human | Esophagus | ESCC | 5.18e-04 | 3.37e-01 | 0.068 |
| 1977 | EIF4E | LZE24T | Human | Esophagus | ESCC | 5.04e-14 | 3.21e-01 | 0.0596 |
| 1977 | EIF4E | LZE6T | Human | Esophagus | ESCC | 7.24e-06 | 4.77e-01 | 0.0845 |
| 1977 | EIF4E | P1T-E | Human | Esophagus | ESCC | 4.08e-06 | 3.92e-01 | 0.0875 |
| 1977 | EIF4E | P2T-E | Human | Esophagus | ESCC | 1.05e-29 | 6.89e-01 | 0.1177 |
| 1977 | EIF4E | P4T-E | Human | Esophagus | ESCC | 1.42e-40 | 1.19e+00 | 0.1323 |
| 1977 | EIF4E | P5T-E | Human | Esophagus | ESCC | 2.50e-14 | 5.14e-01 | 0.1327 |
| 1977 | EIF4E | P8T-E | Human | Esophagus | ESCC | 1.76e-17 | 3.62e-01 | 0.0889 |
| 1977 | EIF4E | P9T-E | Human | Esophagus | ESCC | 8.47e-19 | 4.50e-01 | 0.1131 |
| 1977 | EIF4E | P10T-E | Human | Esophagus | ESCC | 1.84e-22 | 3.89e-01 | 0.116 |
| 1977 | EIF4E | P11T-E | Human | Esophagus | ESCC | 2.46e-21 | 1.08e+00 | 0.1426 |
| 1977 | EIF4E | P12T-E | Human | Esophagus | ESCC | 1.62e-30 | 6.71e-01 | 0.1122 |
| 1977 | EIF4E | P15T-E | Human | Esophagus | ESCC | 1.53e-34 | 8.67e-01 | 0.1149 |
| 1977 | EIF4E | P16T-E | Human | Esophagus | ESCC | 5.33e-39 | 7.34e-01 | 0.1153 |
| Page: 1 2 3 4 5 6 7 8 9 |
| Tissue | Expression Dynamics | Abbreviation |
| Esophagus |  | ESCC: Esophageal squamous cell carcinoma |
| HGIN: High-grade intraepithelial neoplasias | ||
| LGIN: Low-grade intraepithelial neoplasias | ||
| GC |  | CAG: Chronic atrophic gastritis |
| CAG with IM: Chronic atrophic gastritis with intestinal metaplasia | ||
| CSG: Chronic superficial gastritis | ||
| GC: Gastric cancer | ||
| SIM: Severe intestinal metaplasia | ||
| WIM: Wild intestinal metaplasia | ||
| Liver |  | HCC: Hepatocellular carcinoma |
| NAFLD: Non-alcoholic fatty liver disease | ||
| Oral Cavity | 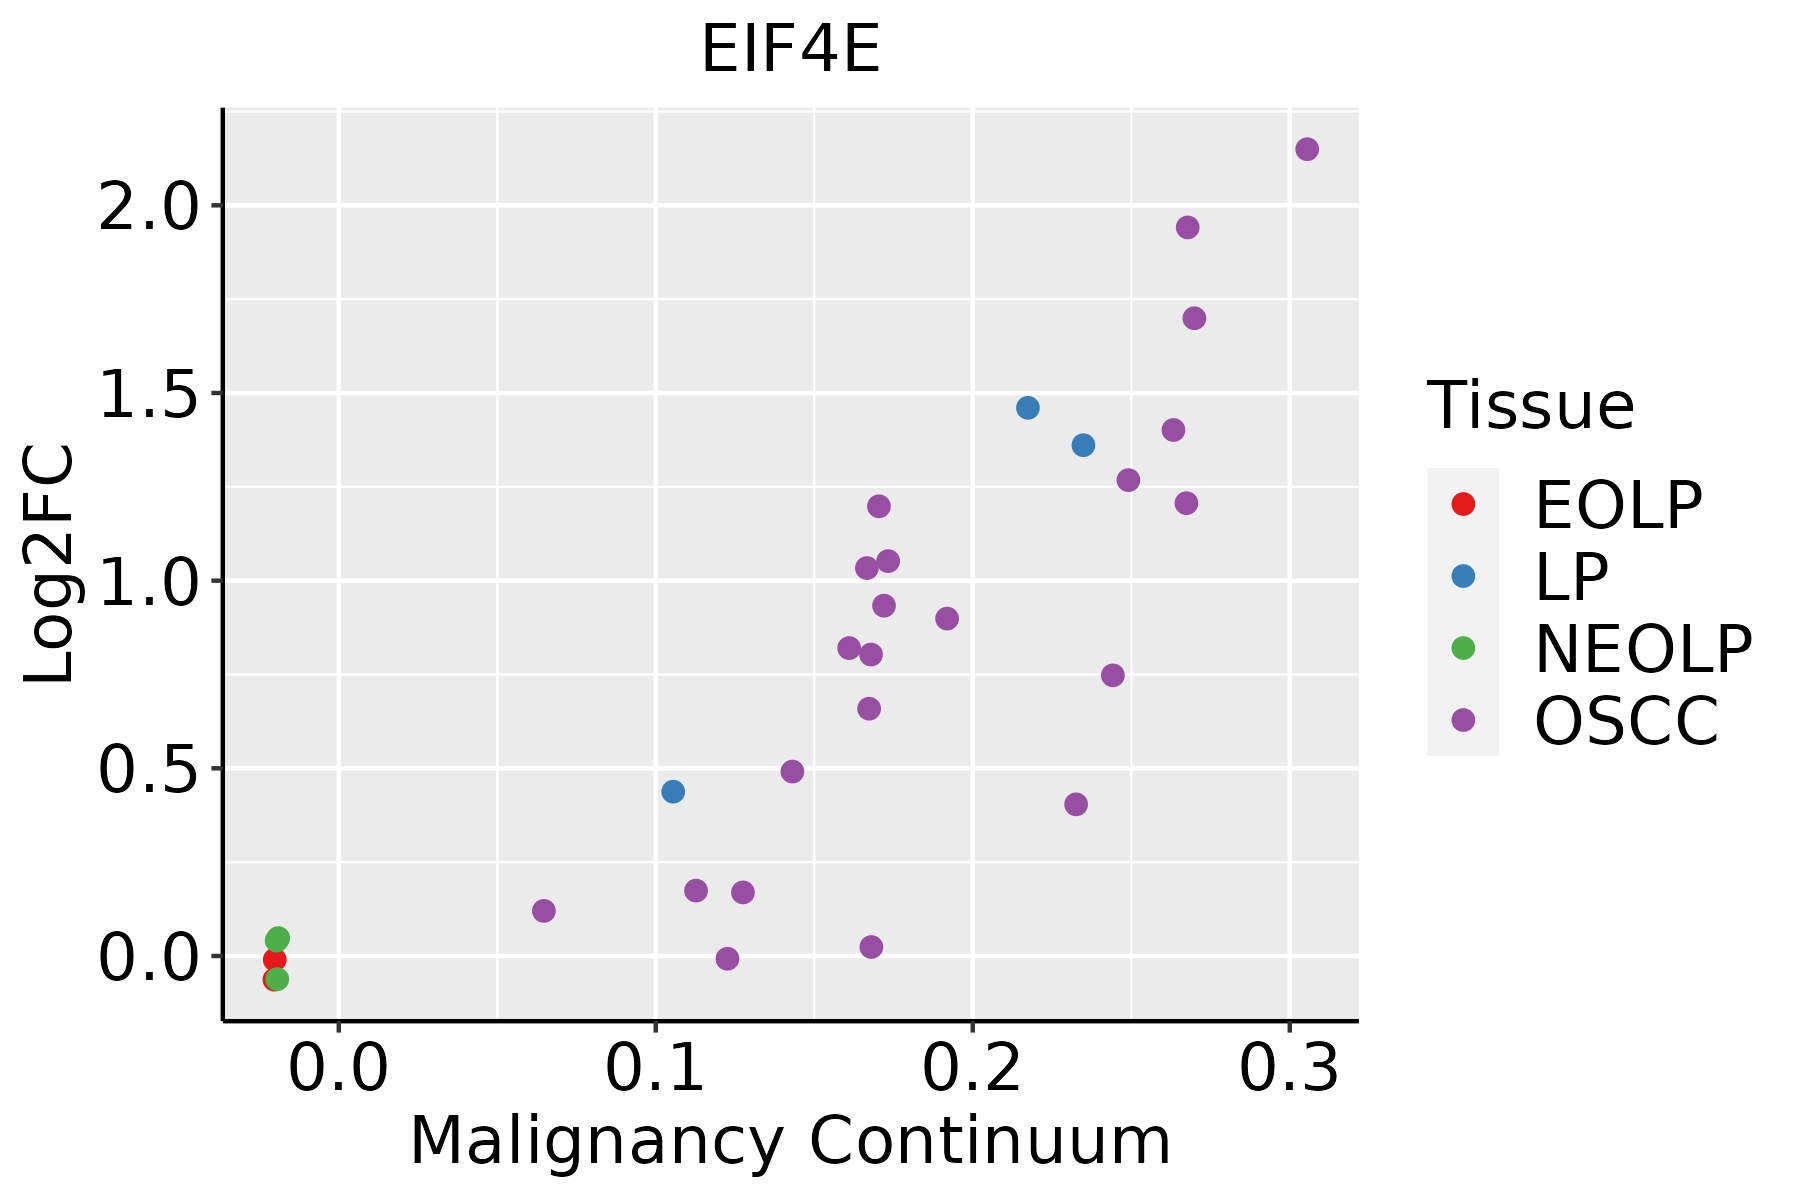 | EOLP: Erosive Oral lichen planus |
| LP: leukoplakia | ||
| NEOLP: Non-erosive oral lichen planus | ||
| OSCC: Oral squamous cell carcinoma | ||
| Prostate | 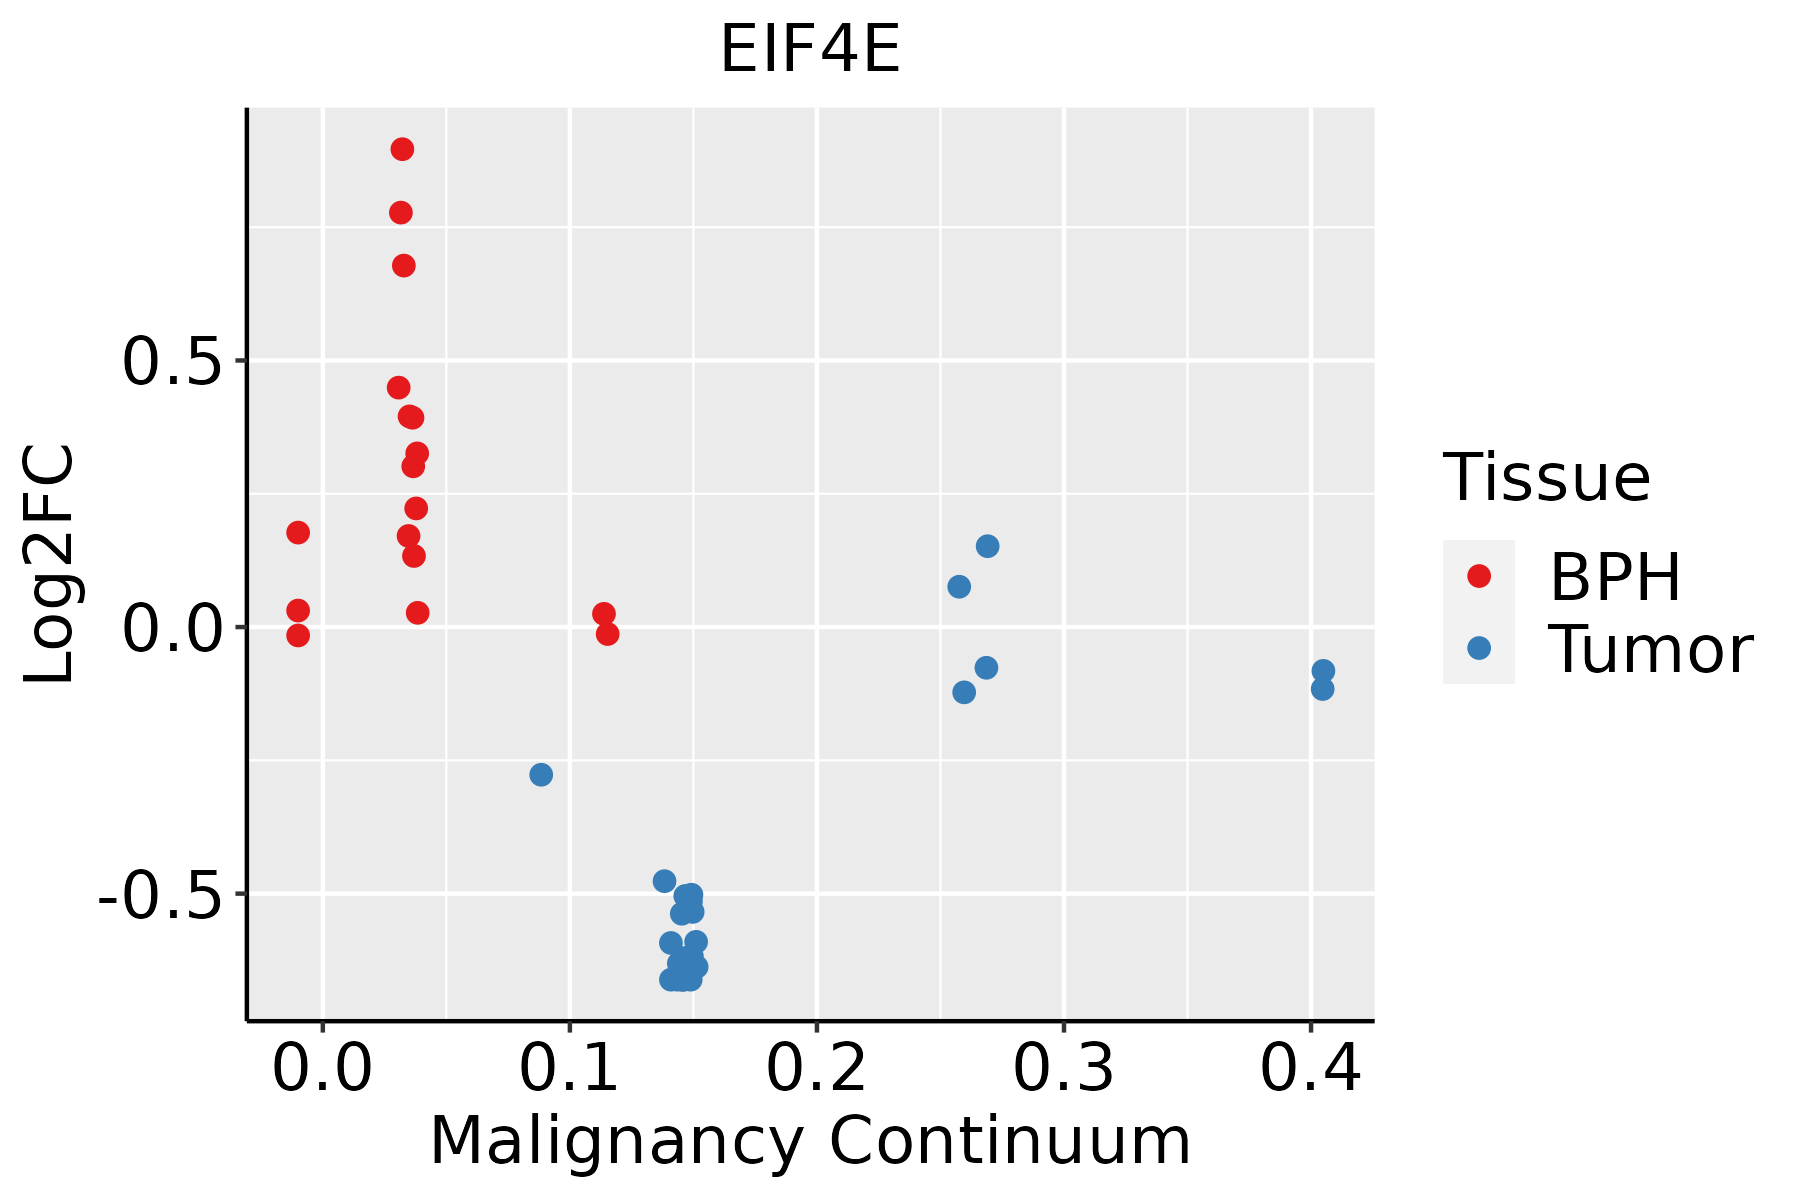 | BPH: Benign Prostatic Hyperplasia |
| Skin |  | AK: Actinic keratosis |
| cSCC: Cutaneous squamous cell carcinoma | ||
| SCCIS:squamous cell carcinoma in situ | ||
| Thyroid |  | ATC: Anaplastic thyroid cancer |
| HT: Hashimoto's thyroiditis | ||
| PTC: Papillary thyroid cancer |
| ∗log2FC in expression of this searched gene in stem-like cells from each diseased tissue sample relative to stem-like cells in normal samples in each tissue plotted against the malignancy continuum. Samples are colored based on if they are from different disease stage. |
Top |
Malignant transformation related pathway analysis |
| Find out the enriched GO biological processes and KEGG pathways involved in transition from healthy to precancer to cancer |
| Tissue | Disease Stage | Enriched GO biological Processes |
| Colorectum | AD |  |
| Colorectum | SER |  |
| Colorectum | MSS |  |
| Colorectum | MSI-H |  |
| Colorectum | FAP |  |
| ∗Top 15 enriched GO BP terms are showed in the bar plot of each disease state in each tissue. Each row represents a significant GO biological process which is colored according to the -log10(p.adjust). |
| Page: 1 2 3 4 5 6 7 8 9 |
| GO ID | Tissue | Disease Stage | Description | Gene Ratio | Bg Ratio | pvalue | p.adjust | Count |
| GO:00342495 | Oral cavity | OSCC | negative regulation of cellular amide metabolic process | 130/7305 | 273/18723 | 2.20e-03 | 1.00e-02 | 130 |
| GO:00459474 | Oral cavity | OSCC | negative regulation of translational initiation | 14/7305 | 19/18723 | 2.31e-03 | 1.02e-02 | 14 |
| GO:00029313 | Oral cavity | OSCC | response to ischemia | 32/7305 | 58/18723 | 9.08e-03 | 3.26e-02 | 32 |
| GO:00715486 | Oral cavity | OSCC | response to dexamethasone | 23/7305 | 39/18723 | 9.09e-03 | 3.26e-02 | 23 |
| GO:00713848 | Oral cavity | OSCC | cellular response to corticosteroid stimulus | 33/7305 | 61/18723 | 1.19e-02 | 4.02e-02 | 33 |
| GO:00171485 | Oral cavity | OSCC | negative regulation of translation | 113/7305 | 245/18723 | 1.34e-02 | 4.45e-02 | 113 |
| GO:000641319 | Oral cavity | LP | translational initiation | 75/4623 | 118/18723 | 3.96e-19 | 7.52e-17 | 75 |
| GO:000644616 | Oral cavity | LP | regulation of translational initiation | 48/4623 | 79/18723 | 1.04e-11 | 7.66e-10 | 48 |
| GO:0043254110 | Oral cavity | LP | regulation of protein-containing complex assembly | 163/4623 | 428/18723 | 3.72e-10 | 1.92e-08 | 163 |
| GO:0006417110 | Oral cavity | LP | regulation of translation | 175/4623 | 468/18723 | 4.49e-10 | 2.22e-08 | 175 |
| GO:000734614 | Oral cavity | LP | regulation of mitotic cell cycle | 163/4623 | 457/18723 | 7.64e-08 | 2.56e-06 | 163 |
| GO:0031667110 | Oral cavity | LP | response to nutrient levels | 165/4623 | 474/18723 | 3.87e-07 | 1.12e-05 | 165 |
| GO:004477215 | Oral cavity | LP | mitotic cell cycle phase transition | 150/4623 | 424/18723 | 4.38e-07 | 1.23e-05 | 150 |
| GO:1901654110 | Oral cavity | LP | response to ketone | 78/4623 | 194/18723 | 1.24e-06 | 3.03e-05 | 78 |
| GO:0048545110 | Oral cavity | LP | response to steroid hormone | 122/4623 | 339/18723 | 1.91e-06 | 4.39e-05 | 122 |
| GO:0070482110 | Oral cavity | LP | response to oxygen levels | 122/4623 | 347/18723 | 7.10e-06 | 1.37e-04 | 122 |
| GO:000008213 | Oral cavity | LP | G1/S transition of mitotic cell cycle | 80/4623 | 214/18723 | 2.30e-05 | 3.74e-04 | 80 |
| GO:004484313 | Oral cavity | LP | cell cycle G1/S phase transition | 88/4623 | 241/18723 | 2.62e-05 | 4.21e-04 | 88 |
| GO:0043434110 | Oral cavity | LP | response to peptide hormone | 138/4623 | 414/18723 | 4.00e-05 | 5.87e-04 | 138 |
| GO:190165317 | Oral cavity | LP | cellular response to peptide | 122/4623 | 359/18723 | 4.22e-05 | 6.10e-04 | 122 |
| Page: 1 2 3 4 5 6 7 8 9 10 11 12 13 14 15 16 17 18 19 20 21 22 23 24 25 26 27 28 29 30 31 32 33 34 35 |
| Pathway ID | Tissue | Disease Stage | Description | Gene Ratio | Bg Ratio | pvalue | p.adjust | qvalue | Count |
| hsa0406629 | Esophagus | ESCC | HIF-1 signaling pathway | 75/4205 | 109/8465 | 3.66e-05 | 1.68e-04 | 8.60e-05 | 75 |
| hsa049109 | Esophagus | ESCC | Insulin signaling pathway | 89/4205 | 137/8465 | 1.97e-04 | 7.32e-04 | 3.75e-04 | 89 |
| hsa0152110 | Esophagus | ESCC | EGFR tyrosine kinase inhibitor resistance | 55/4205 | 79/8465 | 2.44e-04 | 8.78e-04 | 4.50e-04 | 55 |
| hsa041505 | Esophagus | ESCC | mTOR signaling pathway | 98/4205 | 156/8465 | 5.81e-04 | 1.95e-03 | 9.97e-04 | 98 |
| hsa0421114 | Esophagus | ESCC | Longevity regulating pathway | 58/4205 | 89/8465 | 2.19e-03 | 6.16e-03 | 3.16e-03 | 58 |
| hsa041517 | Esophagus | ESCC | PI3K-Akt signaling pathway | 197/4205 | 354/8465 | 1.24e-02 | 2.83e-02 | 1.45e-02 | 197 |
| hsa04066113 | Esophagus | ESCC | HIF-1 signaling pathway | 75/4205 | 109/8465 | 3.66e-05 | 1.68e-04 | 8.60e-05 | 75 |
| hsa0491014 | Esophagus | ESCC | Insulin signaling pathway | 89/4205 | 137/8465 | 1.97e-04 | 7.32e-04 | 3.75e-04 | 89 |
| hsa0152115 | Esophagus | ESCC | EGFR tyrosine kinase inhibitor resistance | 55/4205 | 79/8465 | 2.44e-04 | 8.78e-04 | 4.50e-04 | 55 |
| hsa0415013 | Esophagus | ESCC | mTOR signaling pathway | 98/4205 | 156/8465 | 5.81e-04 | 1.95e-03 | 9.97e-04 | 98 |
| hsa0421115 | Esophagus | ESCC | Longevity regulating pathway | 58/4205 | 89/8465 | 2.19e-03 | 6.16e-03 | 3.16e-03 | 58 |
| hsa0415114 | Esophagus | ESCC | PI3K-Akt signaling pathway | 197/4205 | 354/8465 | 1.24e-02 | 2.83e-02 | 1.45e-02 | 197 |
| hsa0491021 | Liver | Cirrhotic | Insulin signaling pathway | 56/2530 | 137/8465 | 3.74e-03 | 1.50e-02 | 9.26e-03 | 56 |
| hsa0406612 | Liver | Cirrhotic | HIF-1 signaling pathway | 46/2530 | 109/8465 | 4.00e-03 | 1.59e-02 | 9.78e-03 | 46 |
| hsa015216 | Liver | Cirrhotic | EGFR tyrosine kinase inhibitor resistance | 35/2530 | 79/8465 | 4.50e-03 | 1.70e-02 | 1.05e-02 | 35 |
| hsa042118 | Liver | Cirrhotic | Longevity regulating pathway | 37/2530 | 89/8465 | 1.22e-02 | 3.89e-02 | 2.40e-02 | 37 |
| hsa0491031 | Liver | Cirrhotic | Insulin signaling pathway | 56/2530 | 137/8465 | 3.74e-03 | 1.50e-02 | 9.26e-03 | 56 |
| hsa0406613 | Liver | Cirrhotic | HIF-1 signaling pathway | 46/2530 | 109/8465 | 4.00e-03 | 1.59e-02 | 9.78e-03 | 46 |
| hsa0152111 | Liver | Cirrhotic | EGFR tyrosine kinase inhibitor resistance | 35/2530 | 79/8465 | 4.50e-03 | 1.70e-02 | 1.05e-02 | 35 |
| hsa0421111 | Liver | Cirrhotic | Longevity regulating pathway | 37/2530 | 89/8465 | 1.22e-02 | 3.89e-02 | 2.40e-02 | 37 |
| Page: 1 2 3 4 |
Top |
Cell-cell communication analysis |
| Identification of potential cell-cell interactions between two cell types and their ligand-receptor pairs for different disease states |
| Ligand | Receptor | LRpair | Pathway | Tissue | Disease Stage |
| Page: 1 |
Top |
Single-cell gene regulatory network inference analysis |
| Find out the significant the regulons (TFs) and the target genes of each regulon across cell types for different disease states |
| TF | Cell Type | Tissue | Disease Stage | Target Gene | RSS | Regulon Activity |
| ∗The dot plots of a searched regulon are shown for all cell subpopulations in each disease state of each tissue based on the regulon specific score inferred using pySCENIC and by calculating the average expression. |
| Page: 1 |
Top |
Somatic mutation of malignant transformation related genes |
| Annotation of somatic variants for genes involved in malignant transformation |
| Hugo Symbol | Variant Class | Variant Classification | dbSNP RS | HGVSc | HGVSp | HGVSp Short | SWISSPROT | BIOTYPE | SIFT | PolyPhen | Tumor Sample Barcode | Tissue | Histology | Sex | Age | Stage | Therapy Types | Drugs | Outcome |
| EIF4E | SNV | Missense_Mutation | rs776434815 | c.383G>A | p.Arg128His | p.R128H | P06730 | protein_coding | tolerated(0.15) | benign(0.02) | TCGA-2W-A8YY-01 | Cervix | cervical & endocervical cancer | Female | <65 | I/II | Chemotherapy | cisplatin | CR |
| EIF4E | SNV | Missense_Mutation | novel | c.182N>A | p.Arg61Gln | p.R61Q | P06730 | protein_coding | tolerated(0.25) | benign(0.058) | TCGA-EA-A3HS-01 | Cervix | cervical & endocervical cancer | Female | <65 | I/II | Unknown | Unknown | SD |
| EIF4E | SNV | Missense_Mutation | novel | c.21N>C | p.Glu7Asp | p.E7D | P06730 | protein_coding | tolerated_low_confidence(0.24) | probably_damaging(0.979) | TCGA-AA-A00N-01 | Colorectum | colon adenocarcinoma | Male | >=65 | I/II | Unknown | Unknown | PD |
| EIF4E | SNV | Missense_Mutation | rs772918368 | c.65C>T | p.Thr22Met | p.T22M | P06730 | protein_coding | tolerated(0.07) | possibly_damaging(0.847) | TCGA-CK-6746-01 | Colorectum | colon adenocarcinoma | Female | >=65 | I/II | Unknown | Unknown | SD |
| EIF4E | SNV | Missense_Mutation | rs17850950 | c.379G>A | p.Asp127Asn | p.D127N | P06730 | protein_coding | deleterious(0.03) | possibly_damaging(0.636) | TCGA-F5-6814-01 | Colorectum | rectum adenocarcinoma | Male | <65 | I/II | Unknown | Unknown | SD |
| EIF4E | SNV | Missense_Mutation | rs776434815 | c.383N>A | p.Arg128His | p.R128H | P06730 | protein_coding | tolerated(0.15) | benign(0.02) | TCGA-AX-A0J1-01 | Endometrium | uterine corpus endometrioid carcinoma | Female | >=65 | I/II | Unknown | Unknown | SD |
| EIF4E | SNV | Missense_Mutation | novel | c.547G>A | p.Ala183Thr | p.A183T | P06730 | protein_coding | deleterious(0) | probably_damaging(0.991) | TCGA-E6-A1LX-01 | Endometrium | uterine corpus endometrioid carcinoma | Female | <65 | I/II | Unknown | Unknown | SD |
| EIF4E | SNV | Missense_Mutation | novel | c.539N>C | p.Val180Ala | p.V180A | P06730 | protein_coding | deleterious(0.01) | probably_damaging(0.947) | TCGA-FI-A2D0-01 | Endometrium | uterine corpus endometrioid carcinoma | Female | <65 | I/II | Unknown | Unknown | SD |
| EIF4E | SNV | Missense_Mutation | rs200243582 | c.694N>A | p.Ala232Thr | p.A232T | P06730 | protein_coding | tolerated(0.18) | benign(0.031) | TCGA-BC-A69I-01 | Liver | liver hepatocellular carcinoma | Male | >=65 | I/II | Unknown | Unknown | SD |
| EIF4E | SNV | Missense_Mutation | c.661C>T | p.Pro221Ser | p.P221S | P06730 | protein_coding | tolerated(0.98) | benign(0.061) | TCGA-49-4510-01 | Lung | lung adenocarcinoma | Female | <65 | I/II | Unknown | Unknown | PD |
| Page: 1 2 |
Top |
Related drugs of malignant transformation related genes |
| Identification of chemicals and drugs interact with genes involved in malignant transfromation |
| (DGIdb 4.0) |
| Entrez ID | Symbol | Category | Interaction Types | Drug Claim Name | Drug Name | PMIDs |
| 1977 | EIF4E | DRUGGABLE GENOME | ETOPOSIDE | ETOPOSIDE | 11956083 | |
| 1977 | EIF4E | DRUGGABLE GENOME | H2O2 | 12151318 | ||
| 1977 | EIF4E | DRUGGABLE GENOME | LY2275796 | |||
| 1977 | EIF4E | DRUGGABLE GENOME | MTOR INHIBITOR | 15190216 | ||
| 1977 | EIF4E | DRUGGABLE GENOME | inhibitor | ISIS-EIF4ERX | ||
| 1977 | EIF4E | DRUGGABLE GENOME | RAPAMYCIN | SIROLIMUS | 10516161,8816458,10477262,15292274,14581487,9867830 | |
| 1977 | EIF4E | DRUGGABLE GENOME | HYDROXYUREA | HYDROXYUREA | 10585489 |
| Page: 1 |

Copyright 2023-Present -The University of Texas Health Science Center at Houston |