| Tissue | Expression Dynamics | Abbreviation |
| Breast |  | IDC: Invasive ductal carcinoma |
| DCIS: Ductal carcinoma in situ |
| Precancer(BRCA1-mut): Precancerous lesion from BRCA1 mutation carriers |
| Cervix | 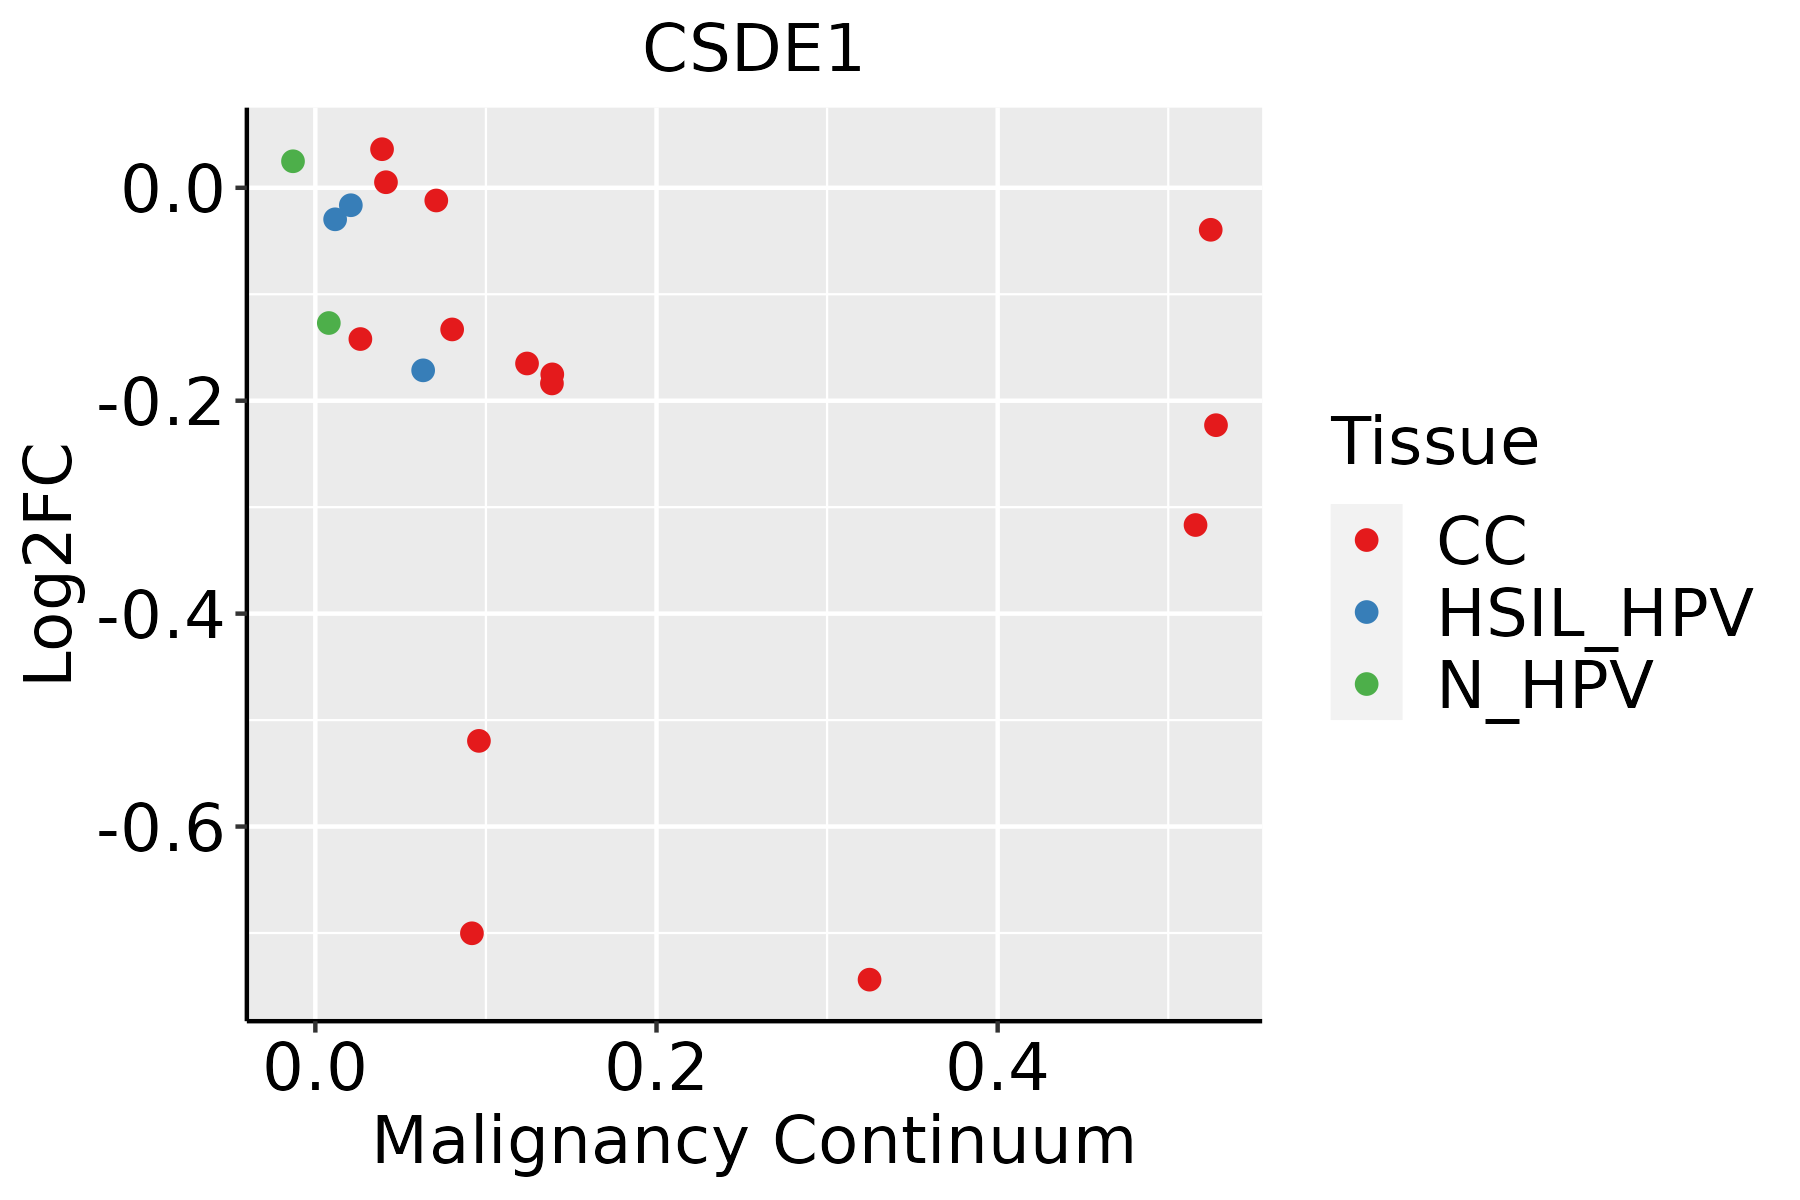 | CC: Cervix cancer |
| HSIL_HPV: HPV-infected high-grade squamous intraepithelial lesions |
| N_HPV: HPV-infected normal cervix |
| Colorectum (GSE201348) |  | FAP: Familial adenomatous polyposis |
| CRC: Colorectal cancer |
| Colorectum (HTA11) |  | AD: Adenomas |
| SER: Sessile serrated lesions |
| MSI-H: Microsatellite-high colorectal cancer |
| MSS: Microsatellite stable colorectal cancer |
| Endometrium | 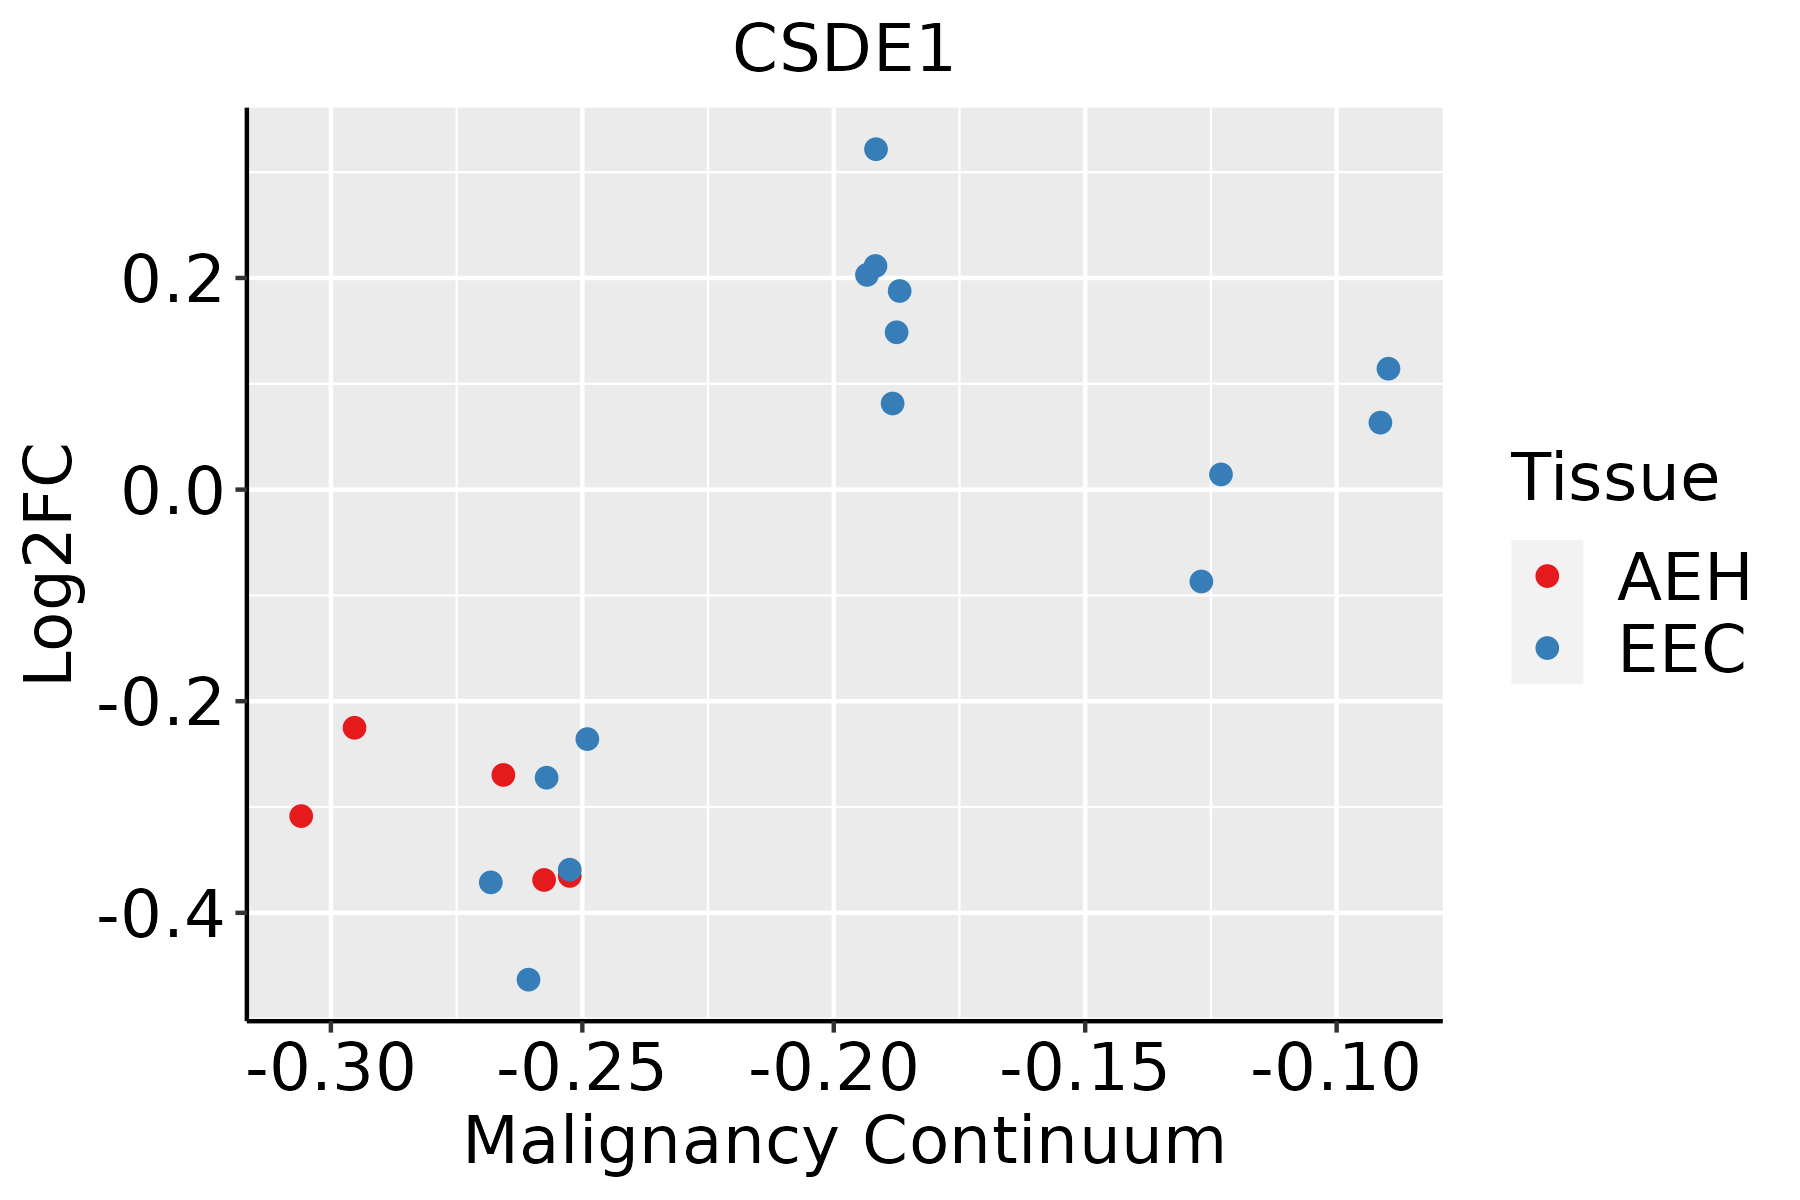 | AEH: Atypical endometrial hyperplasia |
| EEC: Endometrioid Cancer |
| Esophagus |  | ESCC: Esophageal squamous cell carcinoma |
| HGIN: High-grade intraepithelial neoplasias |
| LGIN: Low-grade intraepithelial neoplasias |
| Liver |  | HCC: Hepatocellular carcinoma |
| NAFLD: Non-alcoholic fatty liver disease |
| Oral Cavity | 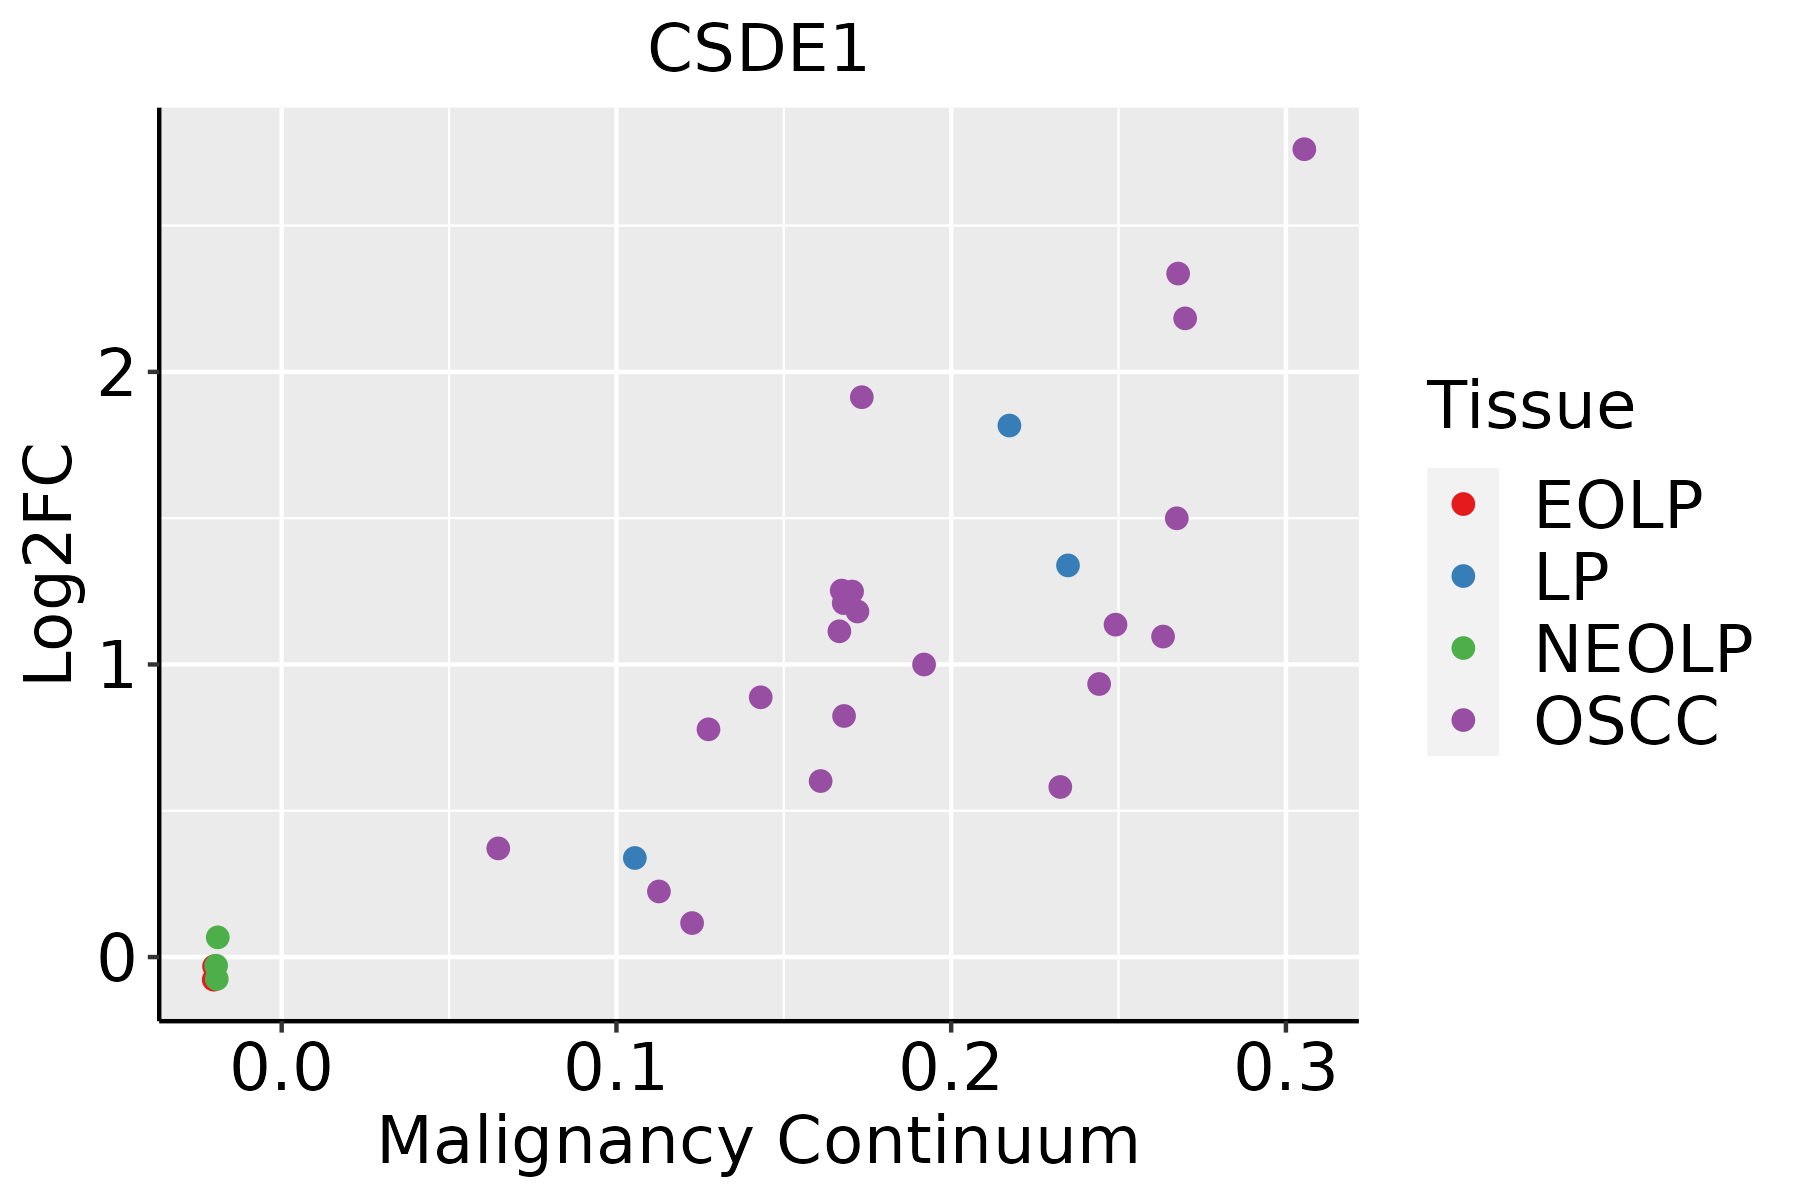 | EOLP: Erosive Oral lichen planus |
| LP: leukoplakia |
| NEOLP: Non-erosive oral lichen planus |
| OSCC: Oral squamous cell carcinoma |
| Prostate | 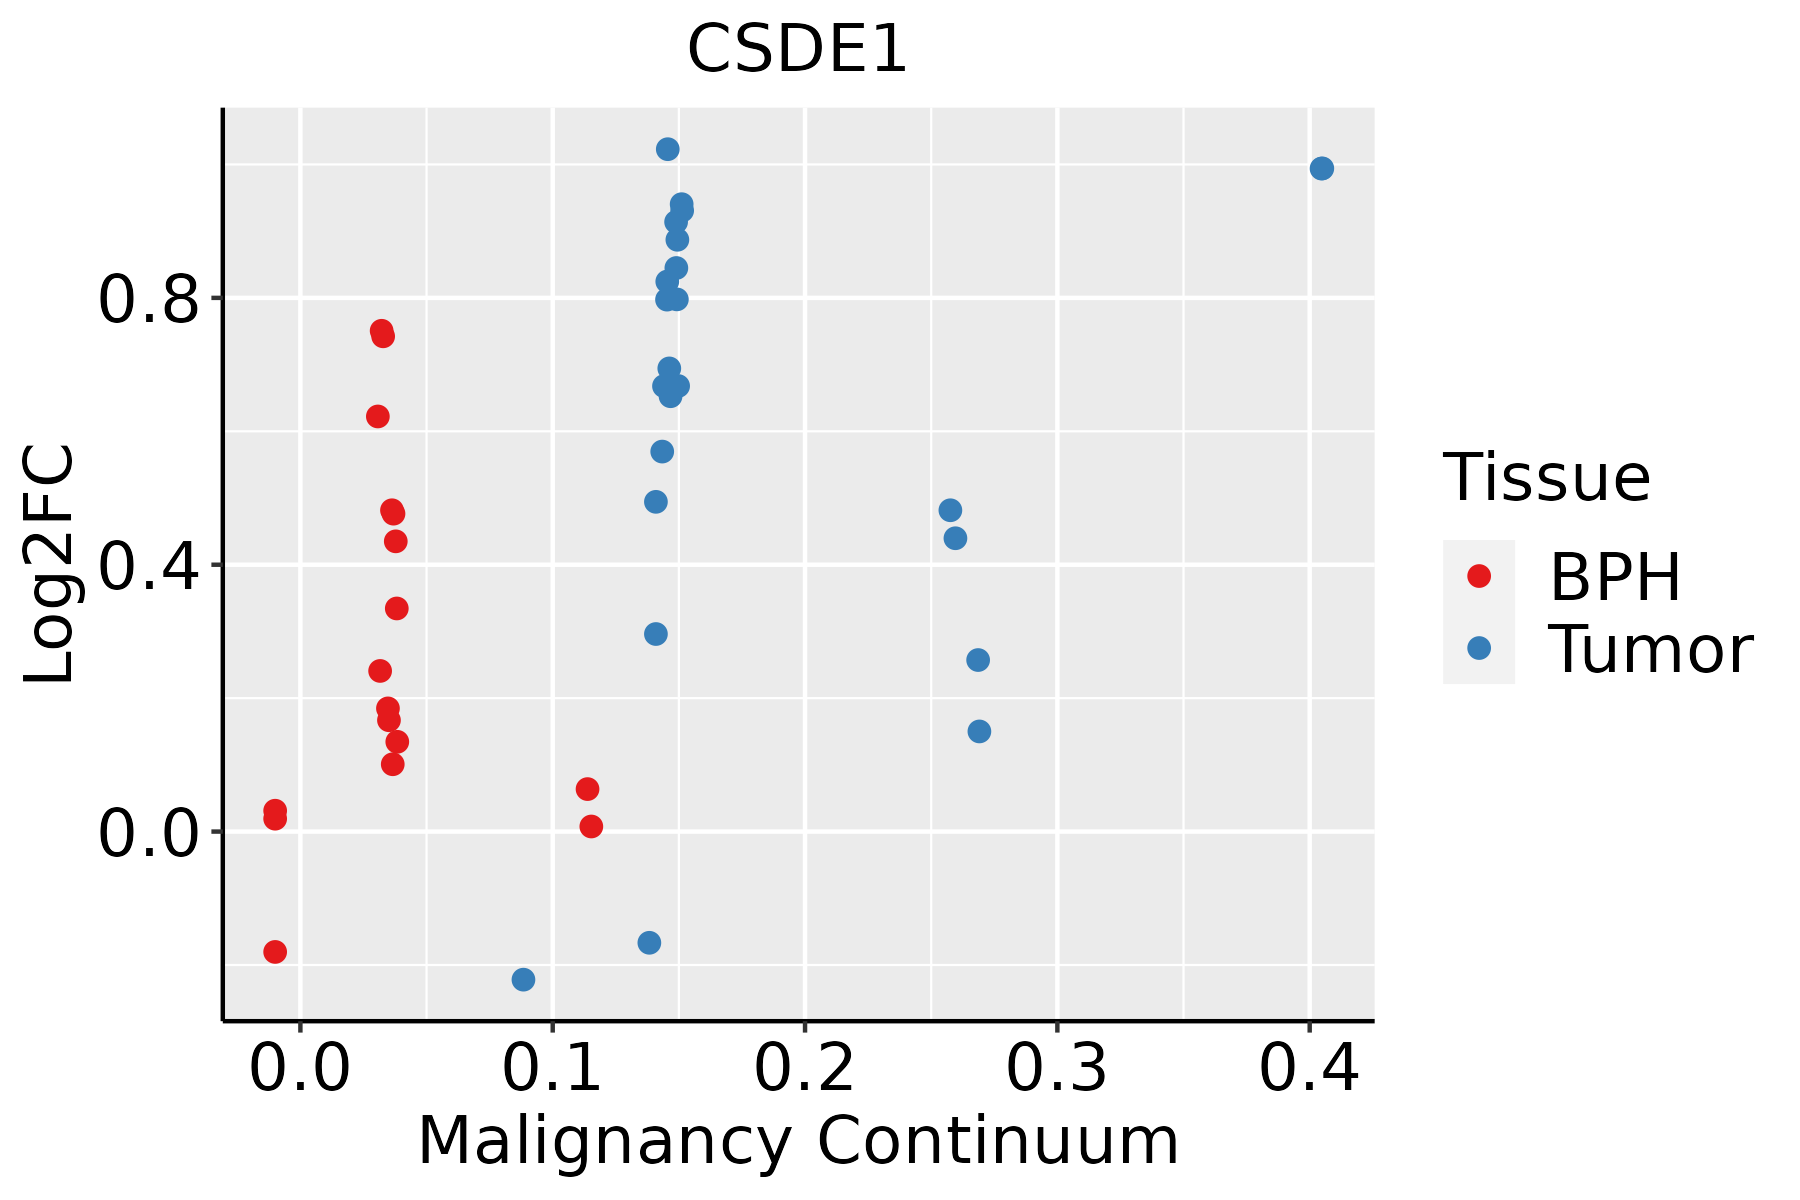 | BPH: Benign Prostatic Hyperplasia |
| Skin | 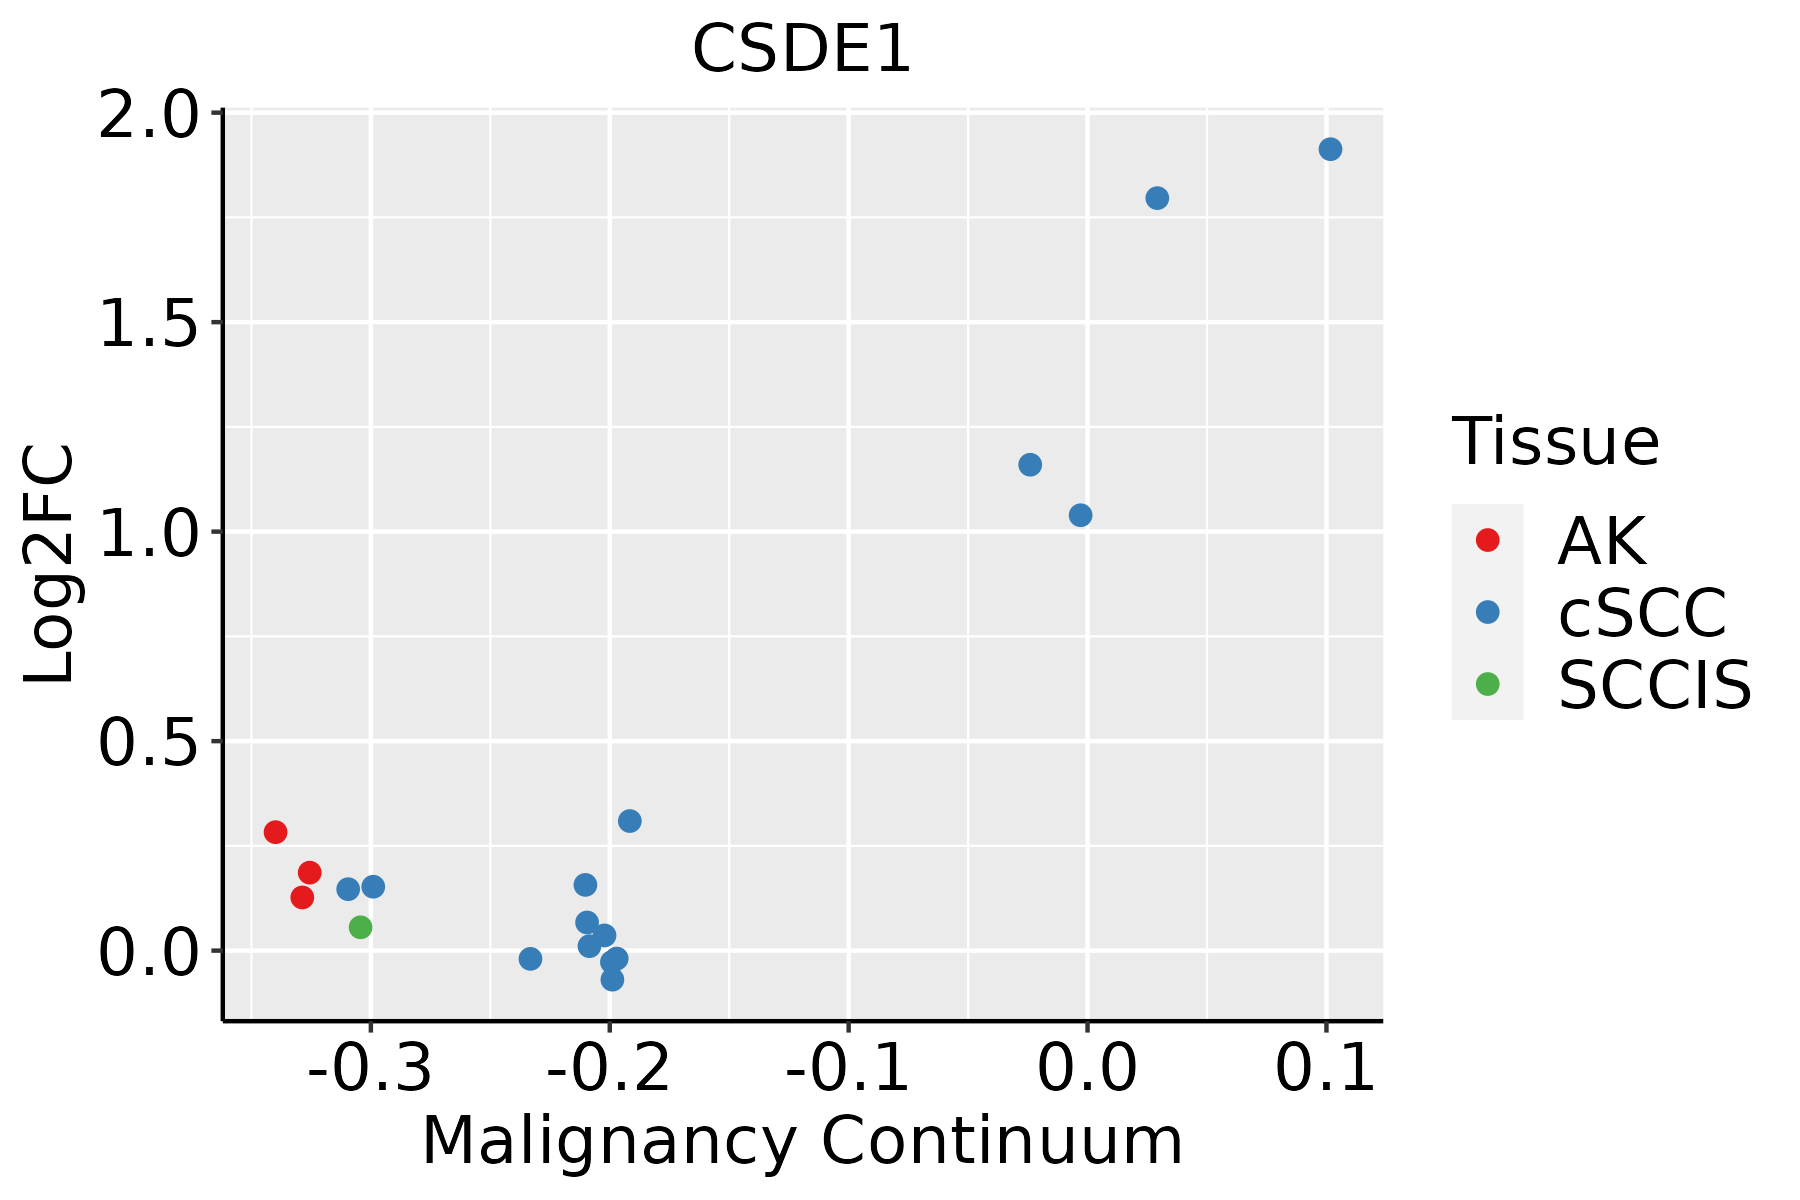 | AK: Actinic keratosis |
| cSCC: Cutaneous squamous cell carcinoma |
| SCCIS:squamous cell carcinoma in situ |
| Thyroid |  | ATC: Anaplastic thyroid cancer |
| HT: Hashimoto's thyroiditis |
| PTC: Papillary thyroid cancer |
| GO ID | Tissue | Disease Stage | Description | Gene Ratio | Bg Ratio | pvalue | p.adjust | Count |
| GO:004670014 | Prostate | Tumor | heterocycle catabolic process | 117/3246 | 445/18723 | 1.11e-06 | 2.10e-05 | 117 |
| GO:004427015 | Prostate | Tumor | cellular nitrogen compound catabolic process | 118/3246 | 451/18723 | 1.30e-06 | 2.39e-05 | 118 |
| GO:003406313 | Prostate | Tumor | stress granule assembly | 15/3246 | 26/18723 | 4.17e-06 | 6.64e-05 | 15 |
| GO:190136114 | Prostate | Tumor | organic cyclic compound catabolic process | 124/3246 | 495/18723 | 7.37e-06 | 1.10e-04 | 124 |
| GO:001943914 | Prostate | Tumor | aromatic compound catabolic process | 118/3246 | 467/18723 | 7.92e-06 | 1.17e-04 | 118 |
| GO:004666111 | Prostate | Tumor | male sex differentiation | 48/3246 | 165/18723 | 1.25e-04 | 1.16e-03 | 48 |
| GO:000840612 | Prostate | Tumor | gonad development | 60/3246 | 221/18723 | 1.68e-04 | 1.50e-03 | 60 |
| GO:000858411 | Prostate | Tumor | male gonad development | 42/3246 | 141/18723 | 1.83e-04 | 1.61e-03 | 42 |
| GO:004654611 | Prostate | Tumor | development of primary male sexual characteristics | 42/3246 | 142/18723 | 2.17e-04 | 1.86e-03 | 42 |
| GO:000754811 | Prostate | Tumor | sex differentiation | 71/3246 | 276/18723 | 2.70e-04 | 2.24e-03 | 71 |
| GO:004513712 | Prostate | Tumor | development of primary sexual characteristics | 60/3246 | 227/18723 | 3.65e-04 | 2.86e-03 | 60 |
| GO:001603229 | Skin | cSCC | viral process | 211/4864 | 415/18723 | 7.04e-28 | 2.76e-25 | 211 |
| GO:000641729 | Skin | cSCC | regulation of translation | 226/4864 | 468/18723 | 8.78e-26 | 2.62e-23 | 226 |
| GO:0006413111 | Skin | cSCC | translational initiation | 84/4864 | 118/18723 | 9.12e-25 | 2.29e-22 | 84 |
| GO:0006401111 | Skin | cSCC | RNA catabolic process | 133/4864 | 278/18723 | 2.71e-15 | 2.23e-13 | 133 |
| GO:000644619 | Skin | cSCC | regulation of translational initiation | 54/4864 | 79/18723 | 3.38e-15 | 2.72e-13 | 54 |
| GO:0006402111 | Skin | cSCC | mRNA catabolic process | 115/4864 | 232/18723 | 9.01e-15 | 6.57e-13 | 115 |
| GO:0034655111 | Skin | cSCC | nucleobase-containing compound catabolic process | 172/4864 | 407/18723 | 4.11e-13 | 2.43e-11 | 172 |
| GO:0046700110 | Skin | cSCC | heterocycle catabolic process | 178/4864 | 445/18723 | 4.45e-11 | 2.13e-09 | 178 |
| GO:0044270110 | Skin | cSCC | cellular nitrogen compound catabolic process | 179/4864 | 451/18723 | 8.34e-11 | 3.79e-09 | 179 |
| Hugo Symbol | Variant Class | Variant Classification | dbSNP RS | HGVSc | HGVSp | HGVSp Short | SWISSPROT | BIOTYPE | SIFT | PolyPhen | Tumor Sample Barcode | Tissue | Histology | Sex | Age | Stage | Therapy Types | Drugs | Outcome |
| CSDE1 | SNV | Missense_Mutation | novel | c.1489N>C | p.Glu497Gln | p.E497Q | O75534 | protein_coding | tolerated(0.06) | benign(0.136) | TCGA-AR-A2LE-01 | Breast | breast invasive carcinoma | Female | >=65 | I/II | Hormone Therapy | tamoxiphen | PD |
| CSDE1 | SNV | Missense_Mutation | | c.772N>T | p.His258Tyr | p.H258Y | O75534 | protein_coding | deleterious(0) | probably_damaging(0.922) | TCGA-C8-A12T-01 | Breast | breast invasive carcinoma | Female | <65 | I/II | Unknown | Unknown | SD |
| CSDE1 | SNV | Missense_Mutation | | c.114G>C | p.Lys38Asn | p.K38N | O75534 | protein_coding | tolerated_low_confidence(0.13) | probably_damaging(0.991) | TCGA-C8-A26Y-01 | Breast | breast invasive carcinoma | Female | >=65 | I/II | Unknown | Unknown | SD |
| CSDE1 | SNV | Missense_Mutation | | c.151N>G | p.Pro51Ala | p.P51A | O75534 | protein_coding | tolerated(0.08) | probably_damaging(0.994) | TCGA-D8-A27G-01 | Breast | breast invasive carcinoma | Female | >=65 | I/II | Unknown | Unknown | SD |
| CSDE1 | SNV | Missense_Mutation | novel | c.2281G>A | p.Asp761Asn | p.D761N | O75534 | protein_coding | deleterious(0.03) | possibly_damaging(0.794) | TCGA-PE-A5DE-01 | Breast | breast invasive carcinoma | Female | <65 | I/II | Chemotherapy | taxotere | CR |
| CSDE1 | insertion | In_Frame_Ins | novel | c.1798_1799insGATATAGTCCAAAGCAAGGGTTTTATTTAGGCATCTCTAAGC | p.Asp600delinsGlyTyrSerProLysGlnGlyPheTyrLeuGlyIleSerLysHis | p.D600delinsGYSPKQGFYLGISKH | O75534 | protein_coding | | | TCGA-AR-A0TY-01 | Breast | breast invasive carcinoma | Female | <65 | I/II | Unspecific | Paclitaxel | PD |
| CSDE1 | SNV | Missense_Mutation | novel | c.272N>A | p.Arg91His | p.R91H | O75534 | protein_coding | deleterious(0) | benign(0.072) | TCGA-PN-A8MA-01 | Cervix | cervical & endocervical cancer | Female | <65 | I/II | Chemotherapy | cisplatin | SD |
| CSDE1 | SNV | Missense_Mutation | novel | c.95N>T | p.Ser32Phe | p.S32F | O75534 | protein_coding | tolerated_low_confidence(0.18) | possibly_damaging(0.663) | TCGA-VS-A8EC-01 | Cervix | cervical & endocervical cancer | Female | <65 | III/IV | Chemotherapy | carboplatin | CR |
| CSDE1 | SNV | Missense_Mutation | novel | c.2356G>A | p.Glu786Lys | p.E786K | O75534 | protein_coding | tolerated(0.09) | benign(0.007) | TCGA-VS-A8EJ-01 | Cervix | cervical & endocervical cancer | Female | <65 | I/II | Chemotherapy | cisplatin | PD |
| CSDE1 | SNV | Missense_Mutation | | c.681N>T | p.Lys227Asn | p.K227N | O75534 | protein_coding | deleterious(0.02) | probably_damaging(0.978) | TCGA-A6-6141-01 | Colorectum | colon adenocarcinoma | Male | <65 | I/II | Chemotherapy | 5-fu | SD |


