
|
|||||
|
 | |
| |
| |
| |
| |
| |
|
Gene: CREBBP |
Gene summary for CREBBP |
| Gene information | Species | Human | Gene symbol | CREBBP | Gene ID | 1387 |
| Gene name | CREB binding protein | |
| Gene Alias | CBP | |
| Cytomap | 16p13.3 | |
| Gene Type | protein-coding | GO ID | GO:0000122 | UniProtAcc | Q92793 |
Top |
Malignant transformation analysis |
| Identification of the aberrant gene expression in precancerous and cancerous lesions by comparing the gene expression of stem-like cells in diseased tissues with normal stem cells |
| Entrez ID | Symbol | Replicates | Species | Organ | Tissue | Adj P-value | Log2FC | Malignancy |
| 1387 | CREBBP | CA_HPV_1 | Human | Cervix | CC | 4.57e-04 | 5.19e-02 | 0.0264 |
| 1387 | CREBBP | CCI_1 | Human | Cervix | CC | 1.23e-03 | 7.23e-01 | 0.528 |
| 1387 | CREBBP | CCI_2 | Human | Cervix | CC | 1.04e-08 | 9.78e-01 | 0.5249 |
| 1387 | CREBBP | CCI_3 | Human | Cervix | CC | 1.34e-04 | 6.35e-01 | 0.516 |
| 1387 | CREBBP | HTA11_3410_2000001011 | Human | Colorectum | AD | 4.77e-02 | -2.53e-01 | 0.0155 |
| 1387 | CREBBP | HTA11_347_2000001011 | Human | Colorectum | AD | 1.63e-03 | 3.68e-01 | -0.1954 |
| 1387 | CREBBP | HTA11_99999965104_69814 | Human | Colorectum | MSS | 1.58e-10 | 7.35e-01 | 0.281 |
| 1387 | CREBBP | HTA11_99999974143_84620 | Human | Colorectum | MSS | 4.62e-05 | -3.20e-01 | 0.3005 |
| 1387 | CREBBP | A002-C-010 | Human | Colorectum | FAP | 2.61e-03 | -4.41e-02 | 0.242 |
| 1387 | CREBBP | A001-C-207 | Human | Colorectum | FAP | 4.79e-02 | -1.54e-01 | 0.1278 |
| 1387 | CREBBP | A015-C-203 | Human | Colorectum | FAP | 1.13e-31 | -1.57e-01 | -0.1294 |
| 1387 | CREBBP | A015-C-204 | Human | Colorectum | FAP | 1.14e-04 | -1.59e-01 | -0.0228 |
| 1387 | CREBBP | A014-C-040 | Human | Colorectum | FAP | 2.45e-03 | -2.10e-01 | -0.1184 |
| 1387 | CREBBP | A002-C-201 | Human | Colorectum | FAP | 2.72e-11 | -2.76e-01 | 0.0324 |
| 1387 | CREBBP | A002-C-203 | Human | Colorectum | FAP | 5.95e-07 | -1.19e-02 | 0.2786 |
| 1387 | CREBBP | A001-C-119 | Human | Colorectum | FAP | 1.31e-05 | 8.61e-02 | -0.1557 |
| 1387 | CREBBP | A001-C-108 | Human | Colorectum | FAP | 3.05e-16 | -5.21e-02 | -0.0272 |
| 1387 | CREBBP | A002-C-205 | Human | Colorectum | FAP | 4.95e-22 | -1.06e-01 | -0.1236 |
| 1387 | CREBBP | A001-C-104 | Human | Colorectum | FAP | 3.58e-04 | 4.17e-03 | 0.0184 |
| 1387 | CREBBP | A015-C-005 | Human | Colorectum | FAP | 4.36e-03 | -1.38e-01 | -0.0336 |
| Page: 1 2 3 4 5 6 7 8 9 10 |
| Tissue | Expression Dynamics | Abbreviation |
| Cervix | 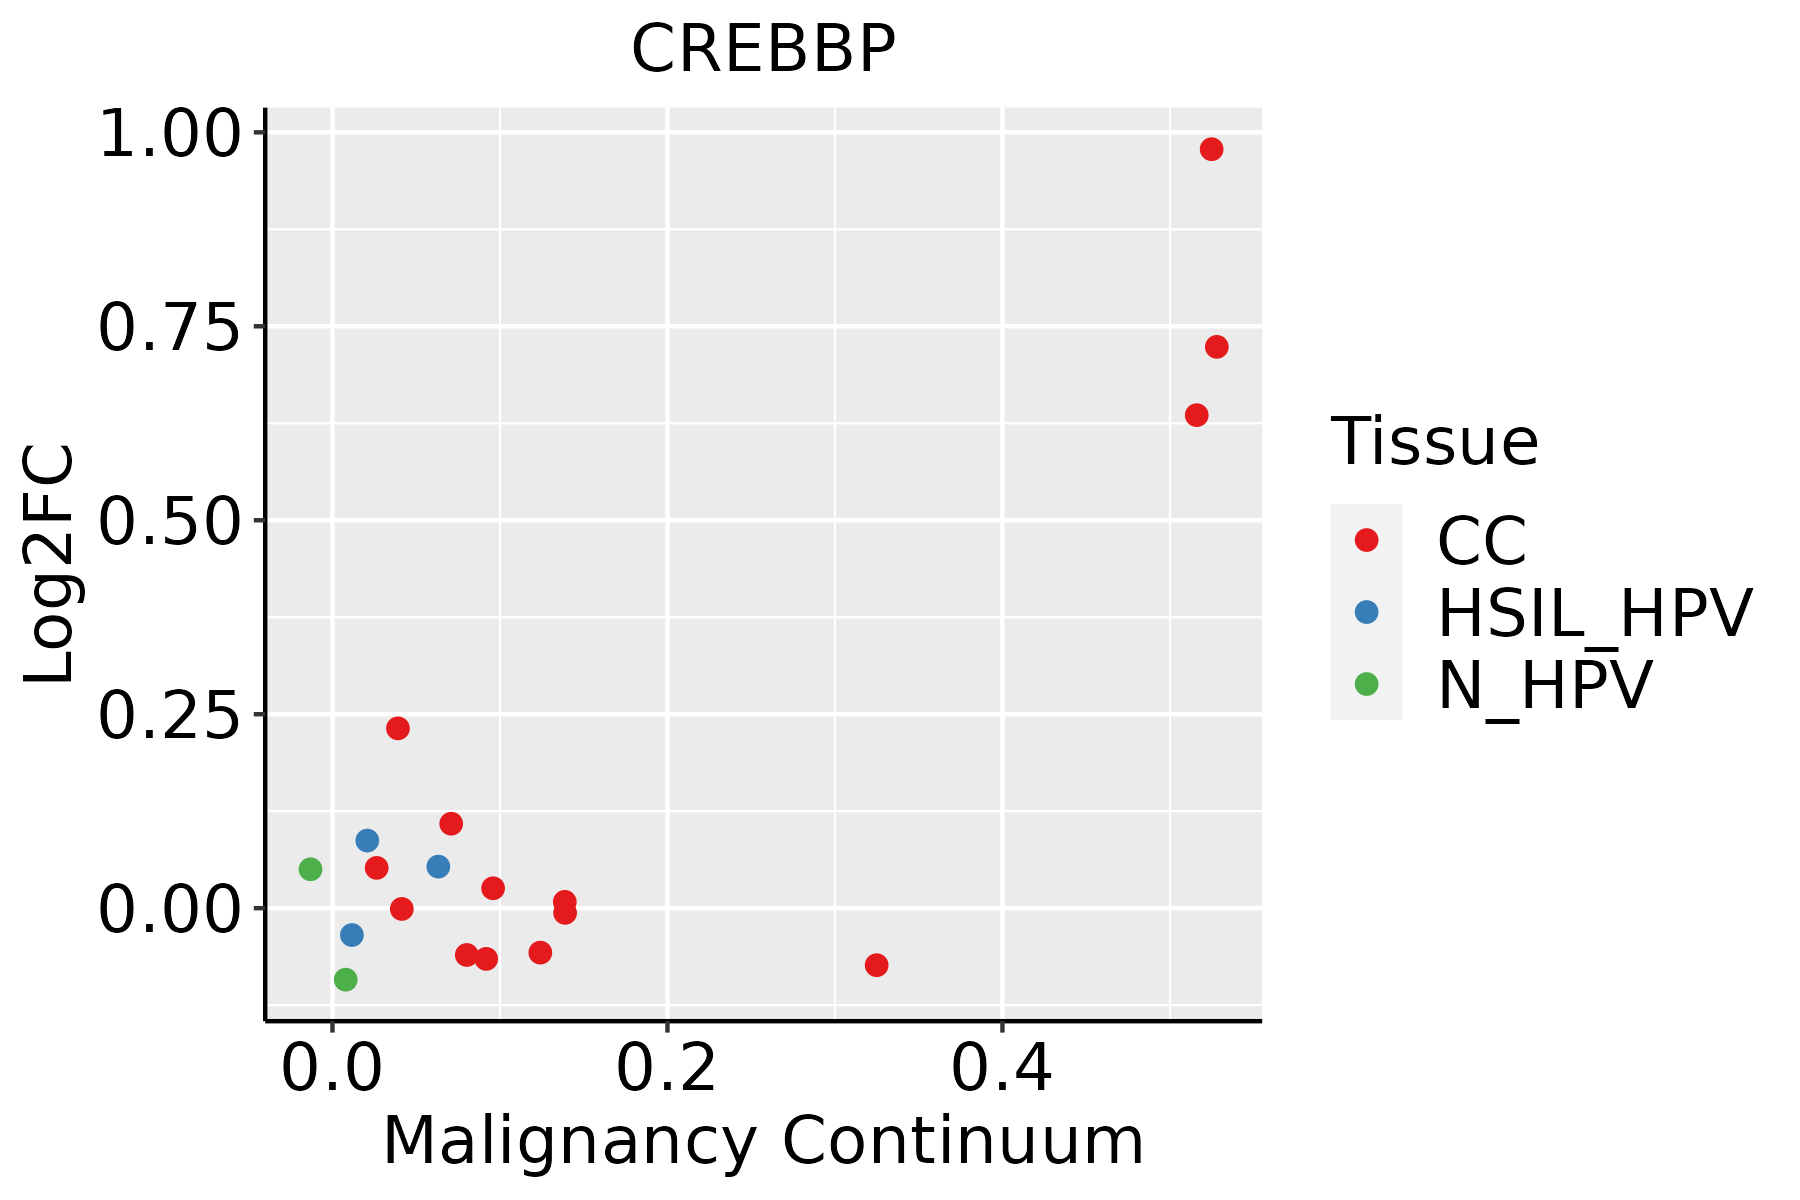 | CC: Cervix cancer |
| HSIL_HPV: HPV-infected high-grade squamous intraepithelial lesions | ||
| N_HPV: HPV-infected normal cervix | ||
| Colorectum (GSE201348) |  | FAP: Familial adenomatous polyposis |
| CRC: Colorectal cancer | ||
| Colorectum (HTA11) |  | AD: Adenomas |
| SER: Sessile serrated lesions | ||
| MSI-H: Microsatellite-high colorectal cancer | ||
| MSS: Microsatellite stable colorectal cancer | ||
| Esophagus |  | ESCC: Esophageal squamous cell carcinoma |
| HGIN: High-grade intraepithelial neoplasias | ||
| LGIN: Low-grade intraepithelial neoplasias | ||
| Liver | 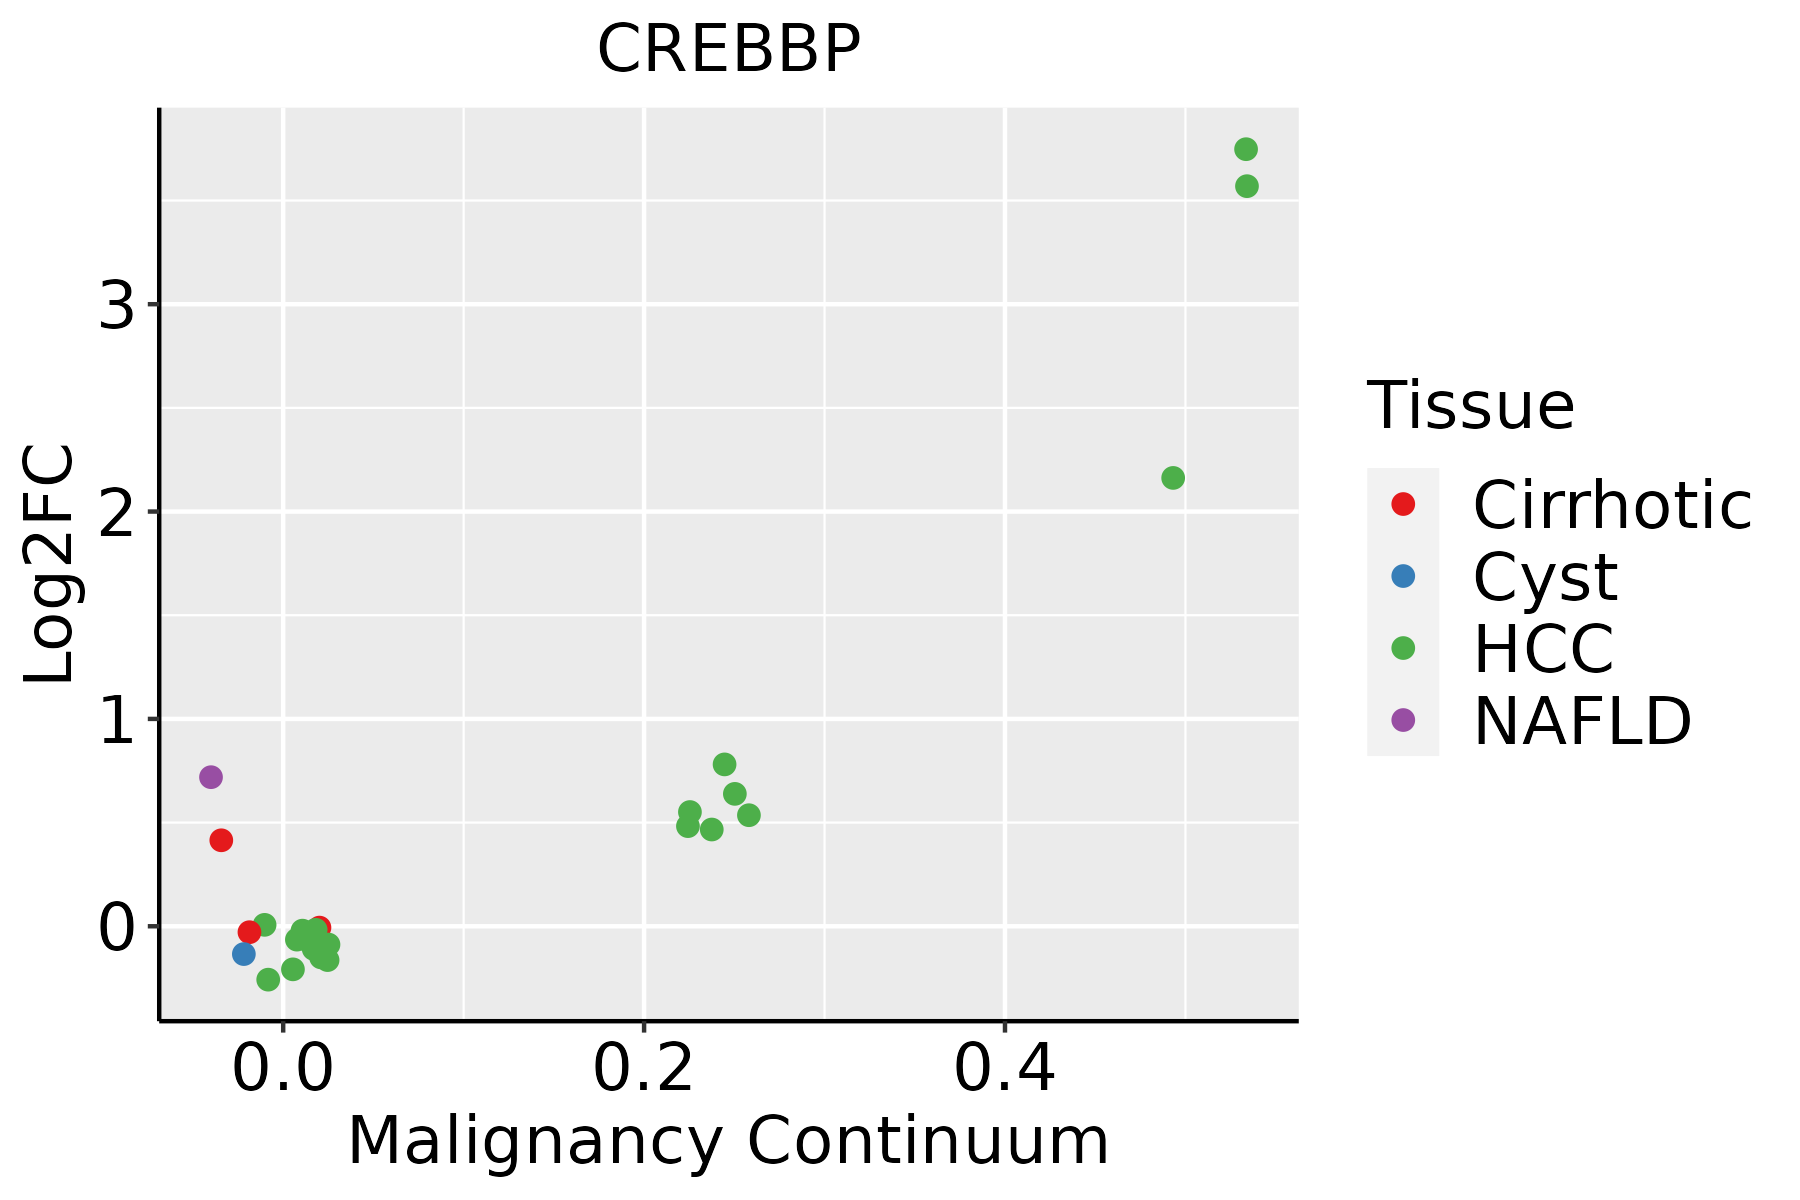 | HCC: Hepatocellular carcinoma |
| NAFLD: Non-alcoholic fatty liver disease | ||
| Lung | 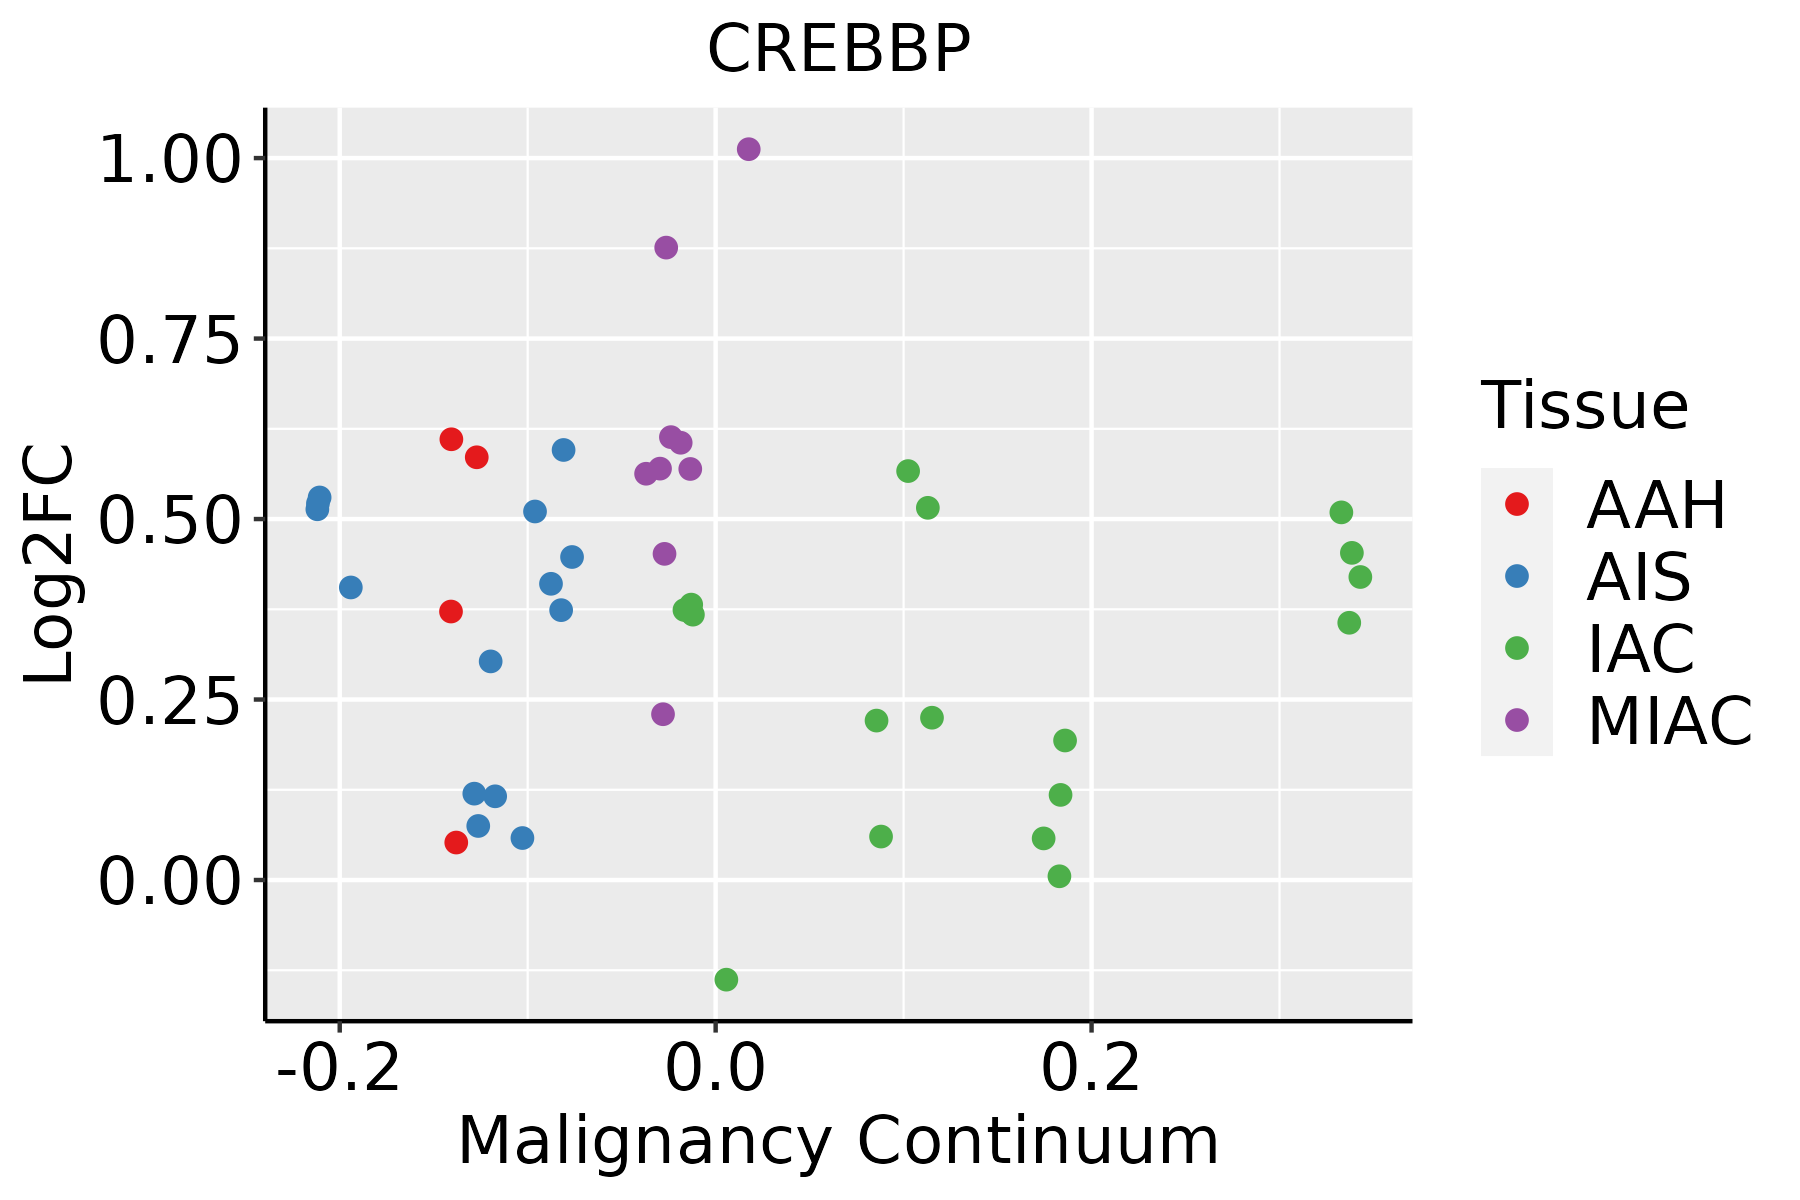 | AAH: Atypical adenomatous hyperplasia |
| AIS: Adenocarcinoma in situ | ||
| IAC: Invasive lung adenocarcinoma | ||
| MIA: Minimally invasive adenocarcinoma | ||
| Oral Cavity | 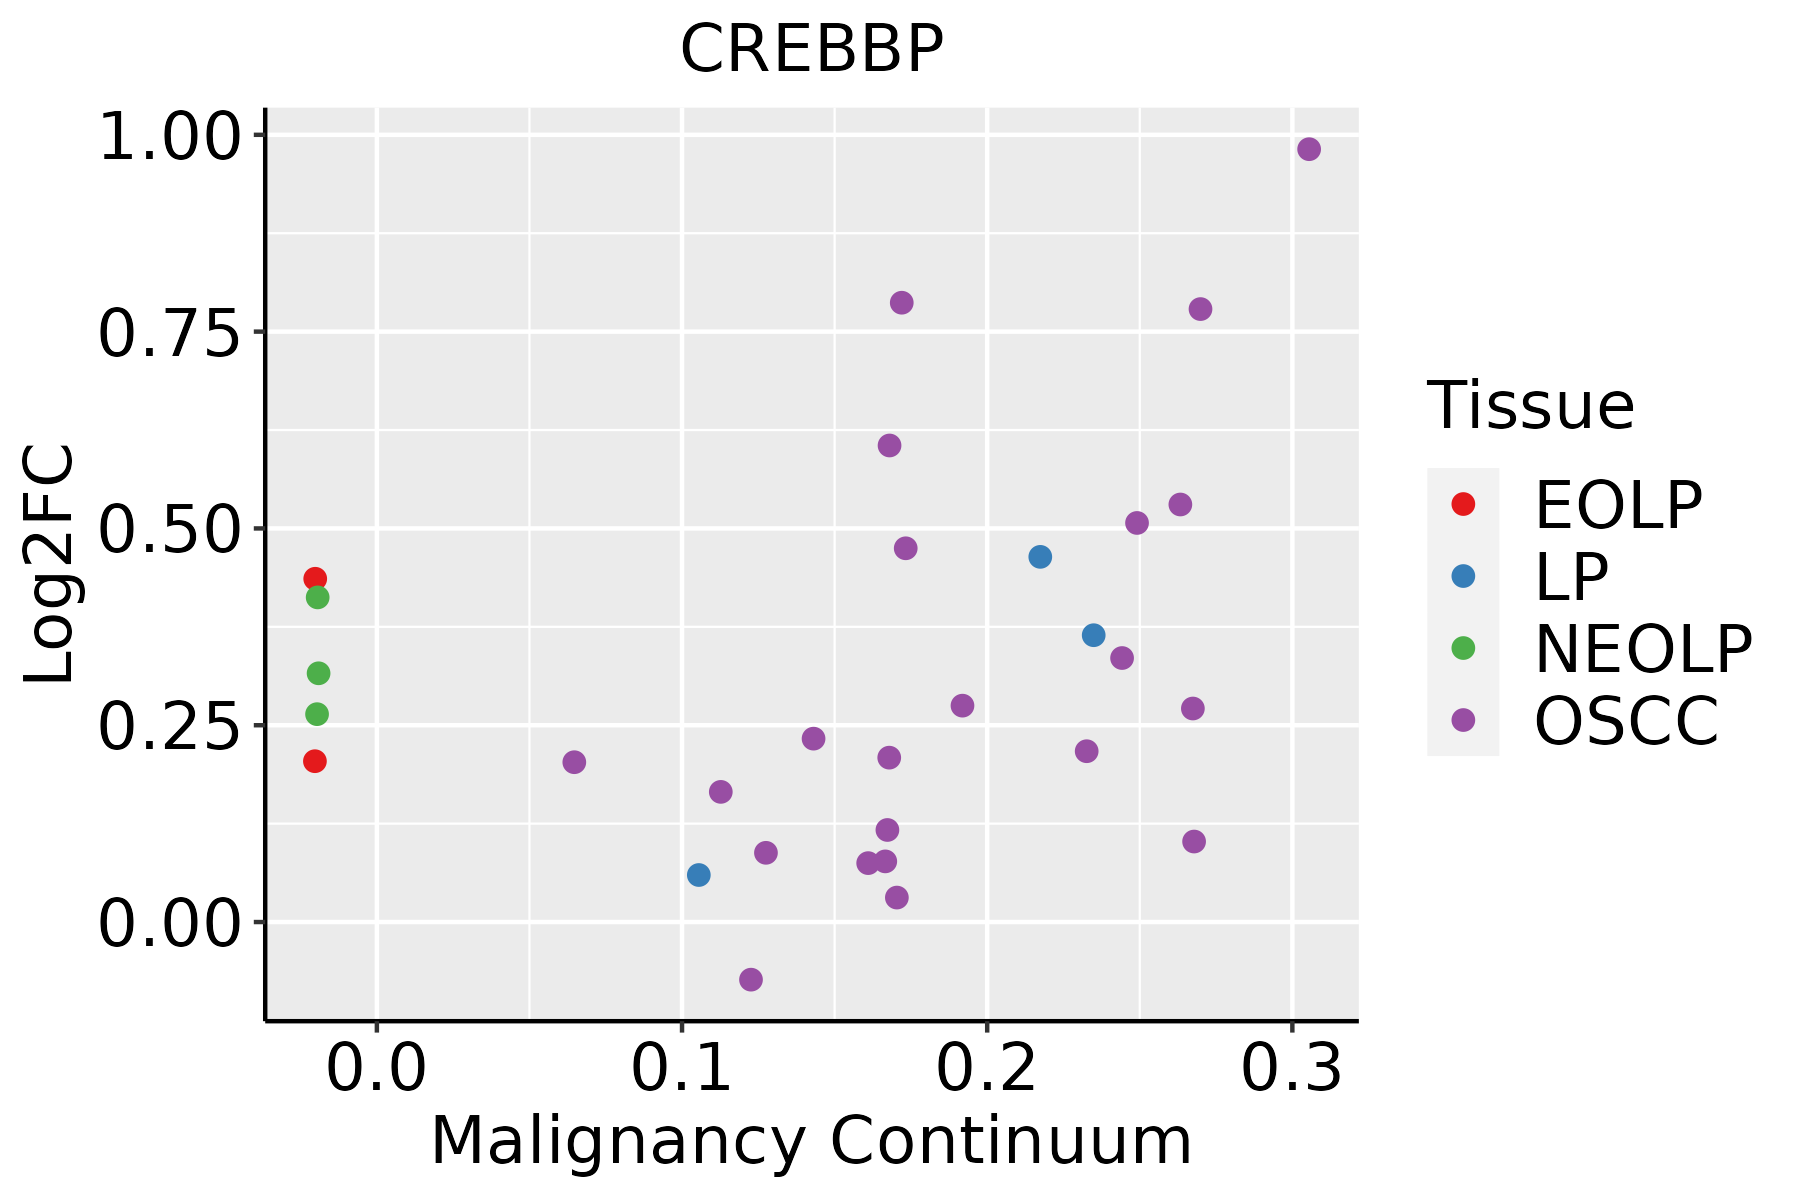 | EOLP: Erosive Oral lichen planus |
| LP: leukoplakia | ||
| NEOLP: Non-erosive oral lichen planus | ||
| OSCC: Oral squamous cell carcinoma | ||
| Prostate | 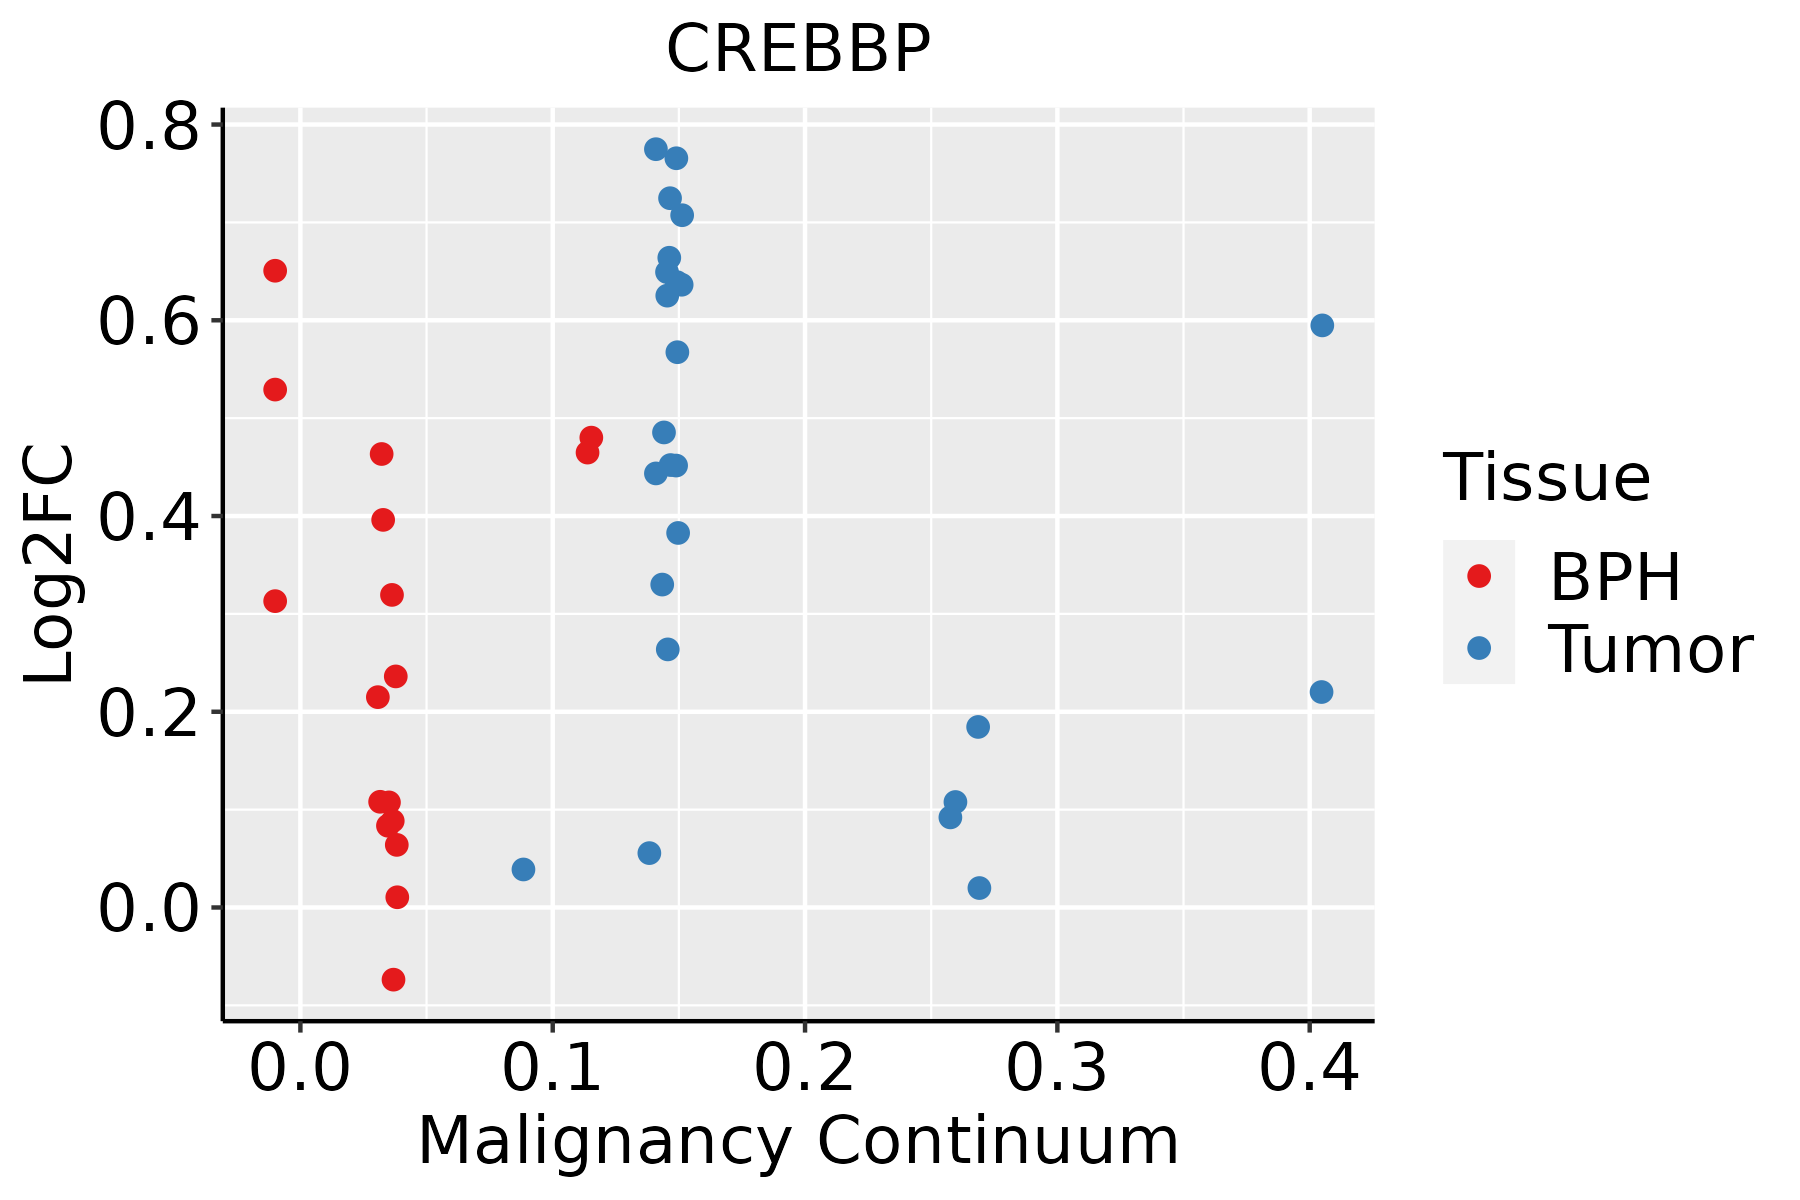 | BPH: Benign Prostatic Hyperplasia |
| Skin | 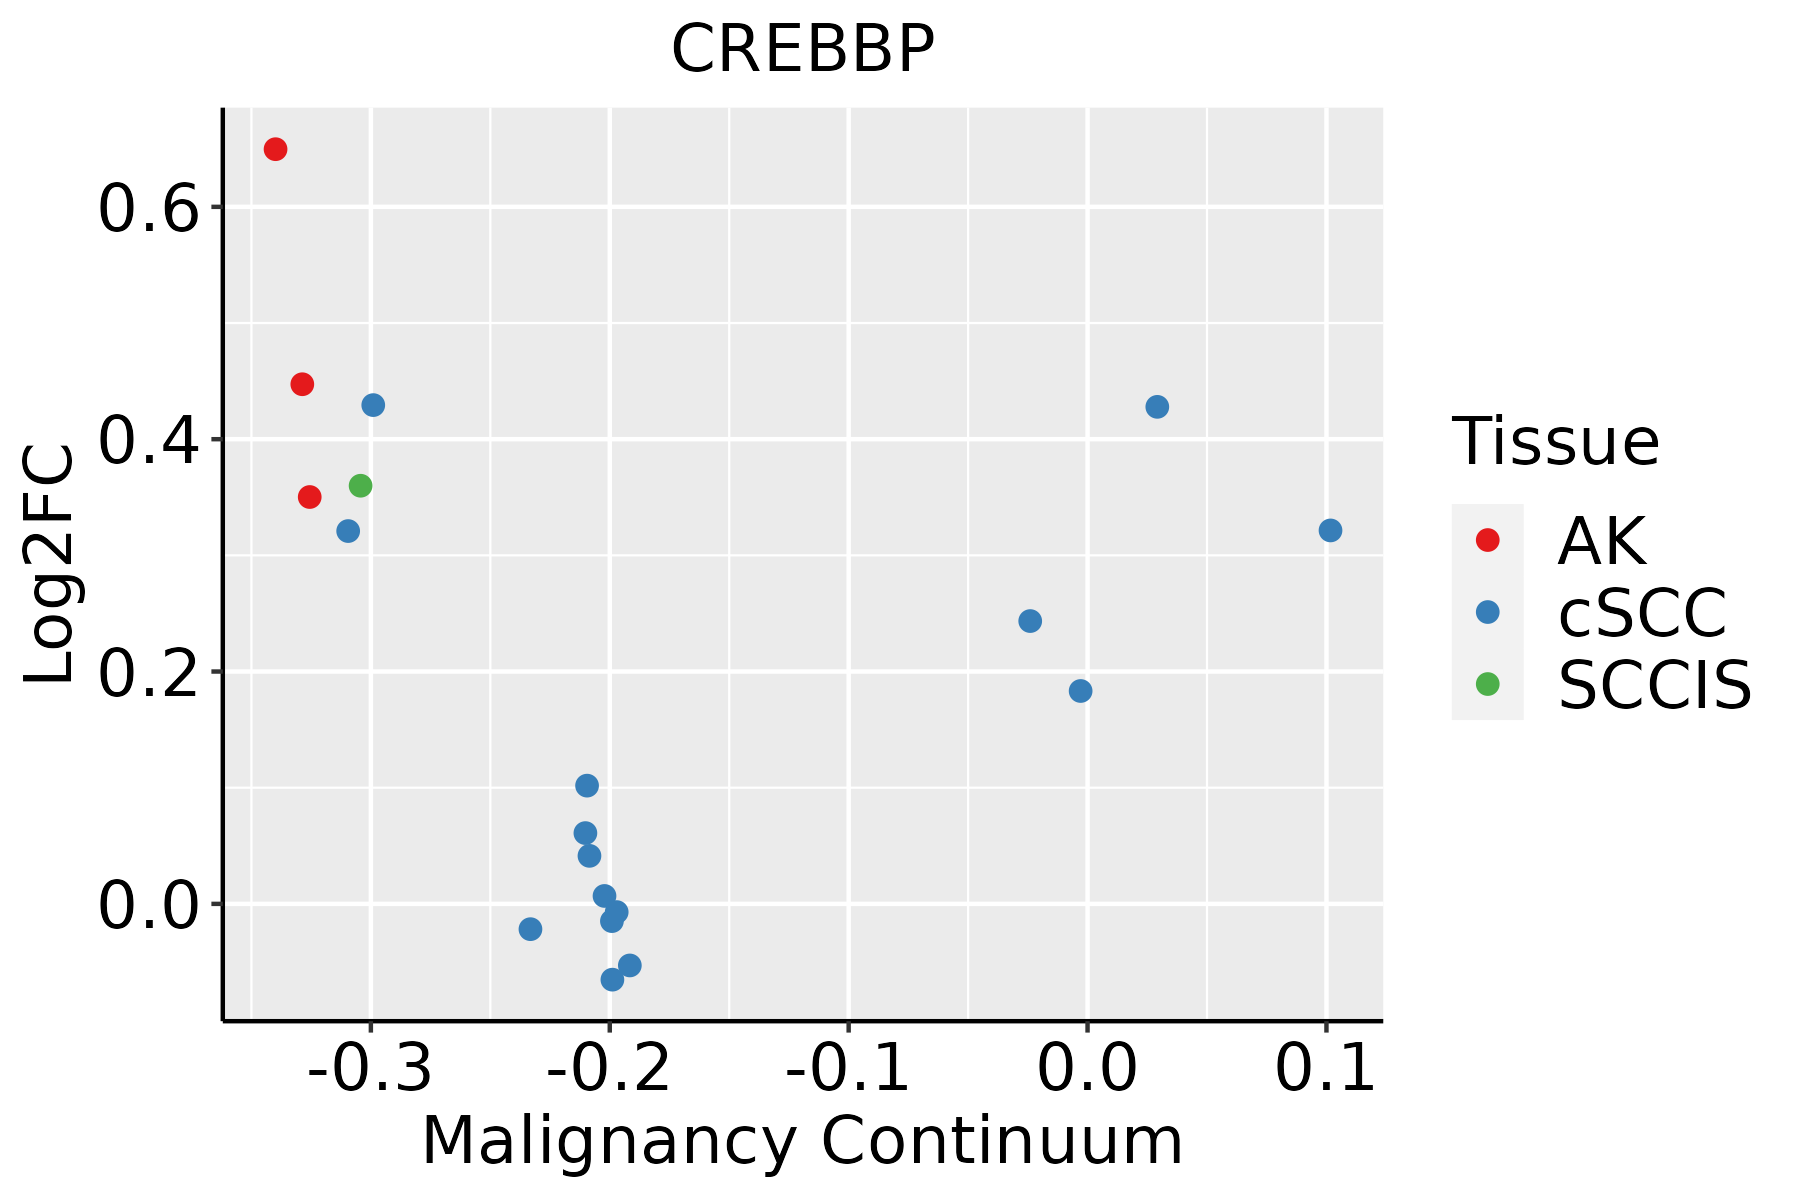 | AK: Actinic keratosis |
| cSCC: Cutaneous squamous cell carcinoma | ||
| SCCIS:squamous cell carcinoma in situ | ||
| Thyroid | 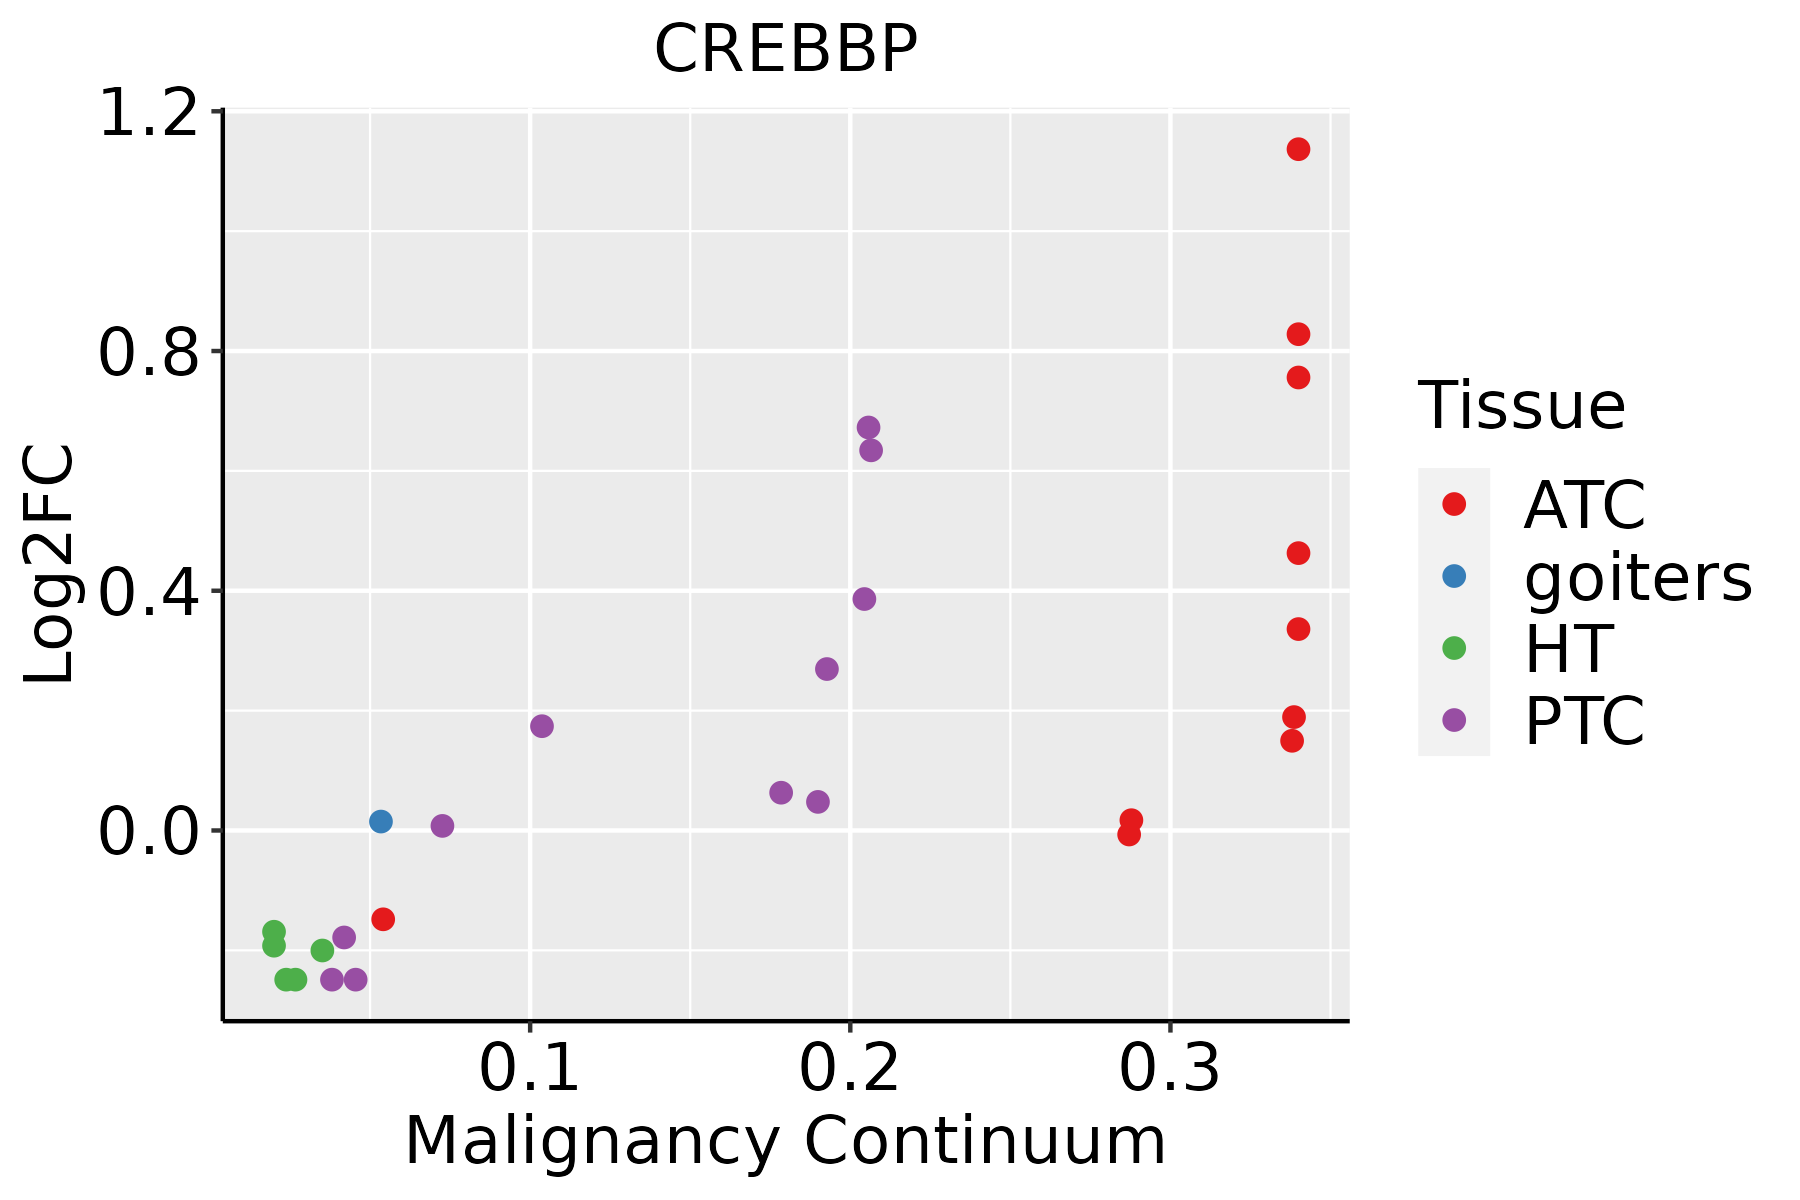 | ATC: Anaplastic thyroid cancer |
| HT: Hashimoto's thyroiditis | ||
| PTC: Papillary thyroid cancer |
| ∗log2FC in expression of this searched gene in stem-like cells from each diseased tissue sample relative to stem-like cells in normal samples in each tissue plotted against the malignancy continuum. Samples are colored based on if they are from different disease stage. |
Top |
Malignant transformation related pathway analysis |
| Find out the enriched GO biological processes and KEGG pathways involved in transition from healthy to precancer to cancer |
| Tissue | Disease Stage | Enriched GO biological Processes |
| Colorectum | AD |  |
| Colorectum | SER |  |
| Colorectum | MSS |  |
| Colorectum | MSI-H |  |
| Colorectum | FAP |  |
| ∗Top 15 enriched GO BP terms are showed in the bar plot of each disease state in each tissue. Each row represents a significant GO biological process which is colored according to the -log10(p.adjust). |
| Page: 1 2 3 4 5 6 7 8 9 |
| GO ID | Tissue | Disease Stage | Description | Gene Ratio | Bg Ratio | pvalue | p.adjust | Count |
| GO:0002223 | Oral cavity | OSCC | stimulatory C-type lectin receptor signaling pathway | 13/7305 | 18/18723 | 4.45e-03 | 1.79e-02 | 13 |
| GO:1990840 | Oral cavity | OSCC | response to lectin | 13/7305 | 18/18723 | 4.45e-03 | 1.79e-02 | 13 |
| GO:1990858 | Oral cavity | OSCC | cellular response to lectin | 13/7305 | 18/18723 | 4.45e-03 | 1.79e-02 | 13 |
| GO:00313495 | Oral cavity | OSCC | positive regulation of defense response | 127/7305 | 278/18723 | 1.32e-02 | 4.39e-02 | 127 |
| GO:0031647110 | Oral cavity | LP | regulation of protein stability | 132/4623 | 298/18723 | 8.16e-14 | 7.99e-12 | 132 |
| GO:005160416 | Oral cavity | LP | protein maturation | 122/4623 | 294/18723 | 1.37e-10 | 7.72e-09 | 122 |
| GO:0034605110 | Oral cavity | LP | cellular response to heat | 37/4623 | 69/18723 | 2.35e-07 | 7.03e-06 | 37 |
| GO:001820513 | Oral cavity | LP | peptidyl-lysine modification | 136/4623 | 376/18723 | 3.64e-07 | 1.06e-05 | 136 |
| GO:007121417 | Oral cavity | LP | cellular response to abiotic stimulus | 121/4623 | 331/18723 | 8.45e-07 | 2.20e-05 | 121 |
| GO:010400417 | Oral cavity | LP | cellular response to environmental stimulus | 121/4623 | 331/18723 | 8.45e-07 | 2.20e-05 | 121 |
| GO:004354312 | Oral cavity | LP | protein acylation | 93/4623 | 243/18723 | 1.65e-06 | 3.86e-05 | 93 |
| GO:000941112 | Oral cavity | LP | response to UV | 63/4623 | 149/18723 | 1.74e-06 | 4.05e-05 | 63 |
| GO:000931417 | Oral cavity | LP | response to radiation | 155/4623 | 456/18723 | 4.12e-06 | 8.49e-05 | 155 |
| GO:001839412 | Oral cavity | LP | peptidyl-lysine acetylation | 68/4623 | 169/18723 | 5.60e-06 | 1.11e-04 | 68 |
| GO:000647312 | Oral cavity | LP | protein acetylation | 78/4623 | 201/18723 | 6.06e-06 | 1.20e-04 | 78 |
| GO:0070482110 | Oral cavity | LP | response to oxygen levels | 122/4623 | 347/18723 | 7.10e-06 | 1.37e-04 | 122 |
| GO:007147815 | Oral cavity | LP | cellular response to radiation | 73/4623 | 186/18723 | 7.44e-06 | 1.41e-04 | 73 |
| GO:000940818 | Oral cavity | LP | response to heat | 47/4623 | 110/18723 | 2.48e-05 | 4.00e-04 | 47 |
| GO:000647512 | Oral cavity | LP | internal protein amino acid acetylation | 63/4623 | 160/18723 | 2.70e-05 | 4.29e-04 | 63 |
| GO:003464412 | Oral cavity | LP | cellular response to UV | 40/4623 | 90/18723 | 3.28e-05 | 5.02e-04 | 40 |
| Page: 1 2 3 4 5 6 7 8 9 10 11 12 13 14 15 16 17 18 19 20 21 22 23 24 25 26 27 28 29 30 31 32 33 34 35 36 37 38 |
| Pathway ID | Tissue | Disease Stage | Description | Gene Ratio | Bg Ratio | pvalue | p.adjust | qvalue | Count |
| hsa0501618 | Cervix | CC | Huntington disease | 94/1267 | 306/8465 | 8.49e-13 | 3.06e-11 | 1.81e-11 | 94 |
| hsa0516720 | Cervix | CC | Kaposi sarcoma-associated herpesvirus infection | 60/1267 | 194/8465 | 9.74e-09 | 1.58e-07 | 9.33e-08 | 60 |
| hsa0452020 | Cervix | CC | Adherens junction | 33/1267 | 93/8465 | 6.99e-07 | 7.31e-06 | 4.32e-06 | 33 |
| hsa0516620 | Cervix | CC | Human T-cell leukemia virus 1 infection | 61/1267 | 222/8465 | 8.13e-07 | 7.98e-06 | 4.72e-06 | 61 |
| hsa051657 | Cervix | CC | Human papillomavirus infection | 74/1267 | 331/8465 | 1.70e-04 | 1.02e-03 | 6.03e-04 | 74 |
| hsa043109 | Cervix | CC | Wnt signaling pathway | 43/1267 | 171/8465 | 3.03e-04 | 1.64e-03 | 9.68e-04 | 43 |
| hsa0516414 | Cervix | CC | Influenza A | 43/1267 | 171/8465 | 3.03e-04 | 1.64e-03 | 9.68e-04 | 43 |
| hsa0491918 | Cervix | CC | Thyroid hormone signaling pathway | 33/1267 | 121/8465 | 3.11e-04 | 1.65e-03 | 9.78e-04 | 33 |
| hsa052157 | Cervix | CC | Prostate cancer | 27/1267 | 97/8465 | 7.54e-04 | 3.39e-03 | 2.01e-03 | 27 |
| hsa05152 | Cervix | CC | Tuberculosis | 42/1267 | 180/8465 | 1.78e-03 | 7.21e-03 | 4.26e-03 | 42 |
| hsa052119 | Cervix | CC | Renal cell carcinoma | 20/1267 | 69/8465 | 2.07e-03 | 8.17e-03 | 4.83e-03 | 20 |
| hsa041106 | Cervix | CC | Cell cycle | 36/1267 | 157/8465 | 4.94e-03 | 1.67e-02 | 9.86e-03 | 36 |
| hsa0501619 | Cervix | CC | Huntington disease | 94/1267 | 306/8465 | 8.49e-13 | 3.06e-11 | 1.81e-11 | 94 |
| hsa05167110 | Cervix | CC | Kaposi sarcoma-associated herpesvirus infection | 60/1267 | 194/8465 | 9.74e-09 | 1.58e-07 | 9.33e-08 | 60 |
| hsa04520110 | Cervix | CC | Adherens junction | 33/1267 | 93/8465 | 6.99e-07 | 7.31e-06 | 4.32e-06 | 33 |
| hsa05166110 | Cervix | CC | Human T-cell leukemia virus 1 infection | 61/1267 | 222/8465 | 8.13e-07 | 7.98e-06 | 4.72e-06 | 61 |
| hsa0516512 | Cervix | CC | Human papillomavirus infection | 74/1267 | 331/8465 | 1.70e-04 | 1.02e-03 | 6.03e-04 | 74 |
| hsa0431012 | Cervix | CC | Wnt signaling pathway | 43/1267 | 171/8465 | 3.03e-04 | 1.64e-03 | 9.68e-04 | 43 |
| hsa0516415 | Cervix | CC | Influenza A | 43/1267 | 171/8465 | 3.03e-04 | 1.64e-03 | 9.68e-04 | 43 |
| hsa0491919 | Cervix | CC | Thyroid hormone signaling pathway | 33/1267 | 121/8465 | 3.11e-04 | 1.65e-03 | 9.78e-04 | 33 |
| Page: 1 2 3 4 5 6 7 8 9 10 11 12 13 14 15 16 17 18 19 20 21 22 23 24 25 |
Top |
Cell-cell communication analysis |
| Identification of potential cell-cell interactions between two cell types and their ligand-receptor pairs for different disease states |
| Ligand | Receptor | LRpair | Pathway | Tissue | Disease Stage |
| Page: 1 |
Top |
Single-cell gene regulatory network inference analysis |
| Find out the significant the regulons (TFs) and the target genes of each regulon across cell types for different disease states |
| TF | Cell Type | Tissue | Disease Stage | Target Gene | RSS | Regulon Activity |
| ∗The dot plots of a searched regulon are shown for all cell subpopulations in each disease state of each tissue based on the regulon specific score inferred using pySCENIC and by calculating the average expression. |
| Page: 1 |
Top |
Somatic mutation of malignant transformation related genes |
| Annotation of somatic variants for genes involved in malignant transformation |
| Hugo Symbol | Variant Class | Variant Classification | dbSNP RS | HGVSc | HGVSp | HGVSp Short | SWISSPROT | BIOTYPE | SIFT | PolyPhen | Tumor Sample Barcode | Tissue | Histology | Sex | Age | Stage | Therapy Types | Drugs | Outcome |
| CREBBP | SNV | Missense_Mutation | novel | c.2368N>A | p.Gln790Lys | p.Q790K | Q92793 | protein_coding | deleterious_low_confidence(0) | probably_damaging(0.985) | TCGA-5L-AAT1-01 | Breast | breast invasive carcinoma | Female | <65 | III/IV | Hormone Therapy | letrozol | SD |
| CREBBP | SNV | Missense_Mutation | c.2114A>G | p.Asn705Ser | p.N705S | Q92793 | protein_coding | deleterious_low_confidence(0.04) | benign(0.351) | TCGA-A2-A1G1-01 | Breast | breast invasive carcinoma | Female | >=65 | I/II | Unknown | Unknown | SD | |
| CREBBP | SNV | Missense_Mutation | c.3860N>A | p.Gly1287Asp | p.G1287D | Q92793 | protein_coding | deleterious(0.01) | benign(0.077) | TCGA-A8-A09Z-01 | Breast | breast invasive carcinoma | Female | >=65 | I/II | Unknown | Unknown | SD | |
| CREBBP | SNV | Missense_Mutation | novel | c.4175G>A | p.Arg1392Gln | p.R1392Q | Q92793 | protein_coding | deleterious(0) | probably_damaging(0.994) | TCGA-AN-A046-01 | Breast | breast invasive carcinoma | Female | >=65 | I/II | Unknown | Unknown | SD |
| CREBBP | SNV | Missense_Mutation | c.3505C>T | p.Arg1169Cys | p.R1169C | Q92793 | protein_coding | deleterious(0) | probably_damaging(0.997) | TCGA-AN-A046-01 | Breast | breast invasive carcinoma | Female | >=65 | I/II | Unknown | Unknown | SD | |
| CREBBP | SNV | Missense_Mutation | c.6803N>C | p.Met2268Thr | p.M2268T | Q92793 | protein_coding | deleterious_low_confidence(0.02) | possibly_damaging(0.599) | TCGA-AO-A128-01 | Breast | breast invasive carcinoma | Female | <65 | I/II | Chemotherapy | doxorubicin | SD | |
| CREBBP | SNV | Missense_Mutation | c.4349N>G | p.Tyr1450Cys | p.Y1450C | Q92793 | protein_coding | deleterious(0) | probably_damaging(1) | TCGA-AQ-A04J-01 | Breast | breast invasive carcinoma | Female | <65 | I/II | Chemotherapy | cytoxan | SD | |
| CREBBP | SNV | Missense_Mutation | c.4563N>A | p.Asp1521Glu | p.D1521E | Q92793 | protein_coding | deleterious(0) | probably_damaging(0.973) | TCGA-AR-A0TS-01 | Breast | breast invasive carcinoma | Female | <65 | I/II | Chemotherapy | doxorubicin | SD | |
| CREBBP | SNV | Missense_Mutation | novel | c.4778N>A | p.Thr1593Asn | p.T1593N | Q92793 | protein_coding | tolerated(0.06) | probably_damaging(0.997) | TCGA-B6-A1KF-01 | Breast | breast invasive carcinoma | Female | >=65 | I/II | Unknown | Unknown | SD |
| CREBBP | SNV | Missense_Mutation | c.6303N>G | p.Ile2101Met | p.I2101M | Q92793 | protein_coding | deleterious(0) | probably_damaging(0.996) | TCGA-BH-A0W7-01 | Breast | breast invasive carcinoma | Female | <65 | I/II | Chemotherapy | taxotere | CR |
| Page: 1 2 3 4 5 6 7 8 9 10 11 12 13 14 15 16 17 18 19 20 21 22 23 24 25 26 27 28 29 30 31 32 33 34 35 |
Top |
Related drugs of malignant transformation related genes |
| Identification of chemicals and drugs interact with genes involved in malignant transfromation |
| (DGIdb 4.0) |
| Entrez ID | Symbol | Category | Interaction Types | Drug Claim Name | Drug Name | PMIDs |
| 1387 | CREBBP | CLINICALLY ACTIONABLE, TRANSCRIPTION FACTOR COMPLEX, ENZYME, TRANSCRIPTION FACTOR, DRUG RESISTANCE, DRUGGABLE GENOME | (-)-ROLIPRAM | (-)-ROLIPRAM | ||
| 1387 | CREBBP | CLINICALLY ACTIONABLE, TRANSCRIPTION FACTOR COMPLEX, ENZYME, TRANSCRIPTION FACTOR, DRUG RESISTANCE, DRUGGABLE GENOME | ETAZOLATE | ETAZOLATE | ||
| 1387 | CREBBP | CLINICALLY ACTIONABLE, TRANSCRIPTION FACTOR COMPLEX, ENZYME, TRANSCRIPTION FACTOR, DRUG RESISTANCE, DRUGGABLE GENOME | TRIAZOLAM | TRIAZOLAM | 22137933 | |
| 1387 | CREBBP | CLINICALLY ACTIONABLE, TRANSCRIPTION FACTOR COMPLEX, ENZYME, TRANSCRIPTION FACTOR, DRUG RESISTANCE, DRUGGABLE GENOME | DNDI1417457 | CHEMBL1530911 | ||
| 1387 | CREBBP | CLINICALLY ACTIONABLE, TRANSCRIPTION FACTOR COMPLEX, ENZYME, TRANSCRIPTION FACTOR, DRUG RESISTANCE, DRUGGABLE GENOME | ESTAZOLAM | ESTAZOLAM | 22137933 | |
| 1387 | CREBBP | CLINICALLY ACTIONABLE, TRANSCRIPTION FACTOR COMPLEX, ENZYME, TRANSCRIPTION FACTOR, DRUG RESISTANCE, DRUGGABLE GENOME | DIETHYL-2-TETRADECYLMALONATE | CHEMBL1797712 | 21292492 | |
| 1387 | CREBBP | CLINICALLY ACTIONABLE, TRANSCRIPTION FACTOR COMPLEX, ENZYME, TRANSCRIPTION FACTOR, DRUG RESISTANCE, DRUGGABLE GENOME | PAPAVERINE | PAPAVERINE | ||
| 1387 | CREBBP | CLINICALLY ACTIONABLE, TRANSCRIPTION FACTOR COMPLEX, ENZYME, TRANSCRIPTION FACTOR, DRUG RESISTANCE, DRUGGABLE GENOME | C 82 | |||
| 1387 | CREBBP | CLINICALLY ACTIONABLE, TRANSCRIPTION FACTOR COMPLEX, ENZYME, TRANSCRIPTION FACTOR, DRUG RESISTANCE, DRUGGABLE GENOME | DIETHYL-2-TETRADECYLIDENEMALONATE | CHEMBL257748 | 21292492 | |
| 1387 | CREBBP | CLINICALLY ACTIONABLE, TRANSCRIPTION FACTOR COMPLEX, ENZYME, TRANSCRIPTION FACTOR, DRUG RESISTANCE, DRUGGABLE GENOME | PRI-724 | PRI-724 |
| Page: 1 2 3 |

Copyright 2023-Present -The University of Texas Health Science Center at Houston |