Schematic overview of the cellular and molecular mechanisms involved in the cancer progression, including the proposed cellular and molecular mechanisms in cancer cells trajectory. AT1: alveolar type 1 cells; AT2: alveolar type 2 cells; AAH: atypical adenomatous hyperplasia; AIS: adenocarcinoma in situ; MIA: minimally invasive adenocarcinoma; IA: invasive adenocarcinoma; EMT: epithelial-mesenchymal transition

Home

Download

Statistics

Help

Contact

Center for Computational Systems Medicine
leaf

Gene summary

leaf

Malignant transformation analysis

leaf

Malignant transformation related pathway analysis

leaf

Cell-cell communication analysis

leaf

Single-cell gene regulatory network inference analysis

leaf

Somatic mutation of malignant transformation related genes

leaf

Related drugs of malignant transformation related genes

Gene: CORO1C

Gene summary for CORO1C

check button Gene summary.

Gene informationSpeciesHuman
Gene symbol

CORO1C

Gene ID

23603

Gene namecoronin 1C
Gene AliasHCRNN4
Cytomap12q24.11
Gene Typeprotein-coding
GO ID

GO:0000902

UniProtAcc

Q9ULV4


Top

Malignant transformation analysis

check button Identification of the aberrant gene expression in precancerous and cancerous lesions by comparing the gene expression of stem-like cells in diseased tissues with normal stem cells
check button Malignant transformation involving gene list.
Entrez IDSymbolReplicatesSpeciesOrganTissueAdj P-valueLog2FCMalignancy
23603CORO1CLZE2THumanEsophagusESCC3.22e-023.21e-010.082
23603CORO1CLZE4THumanEsophagusESCC5.24e-144.73e-010.0811
23603CORO1CLZE5THumanEsophagusESCC1.88e-04-1.09e-010.0514
23603CORO1CLZE8THumanEsophagusESCC3.77e-032.02e-010.067
23603CORO1CLZE22THumanEsophagusESCC2.61e-092.54e-010.068
23603CORO1CLZE24THumanEsophagusESCC4.27e-123.33e-010.0596
23603CORO1CLZE6THumanEsophagusESCC1.37e-06-3.52e-020.0845
23603CORO1CP1T-EHumanEsophagusESCC2.94e-021.16e-010.0875
23603CORO1CP2T-EHumanEsophagusESCC3.50e-174.27e-010.1177
23603CORO1CP4T-EHumanEsophagusESCC8.33e-155.51e-010.1323
23603CORO1CP5T-EHumanEsophagusESCC5.02e-244.94e-010.1327
23603CORO1CP8T-EHumanEsophagusESCC2.85e-111.84e-010.0889
23603CORO1CP9T-EHumanEsophagusESCC2.66e-122.21e-010.1131
23603CORO1CP10T-EHumanEsophagusESCC2.51e-13-1.47e-020.116
23603CORO1CP11T-EHumanEsophagusESCC4.91e-164.76e-010.1426
23603CORO1CP12T-EHumanEsophagusESCC2.11e-194.40e-010.1122
23603CORO1CP15T-EHumanEsophagusESCC4.28e-205.45e-010.1149
23603CORO1CP16T-EHumanEsophagusESCC1.30e-102.41e-010.1153
23603CORO1CP17T-EHumanEsophagusESCC3.52e-024.49e-010.1278
23603CORO1CP20T-EHumanEsophagusESCC6.63e-236.58e-010.1124
Page: 1 2 3 4 5 6 7 

check button Transcriptomic changes along malignancy continuum.
TissueExpression DynamicsAbbreviation
EsophagusThe image shows the transcriptomic changes along malignancy continuum.log2FC in expression of this searched gene in stem-like cells from each diseased tissue sample relative to stem-like cells in normal samples in each tissue plotted against the malignancy continuum. Samples are colored based on if they are from different disease stage.ESCC: Esophageal squamous cell carcinoma
HGIN: High-grade intraepithelial neoplasias
LGIN: Low-grade intraepithelial neoplasias
LiverThe image shows the transcriptomic changes along malignancy continuum.log2FC in expression of this searched gene in stem-like cells from each diseased tissue sample relative to stem-like cells in normal samples in each tissue plotted against the malignancy continuum. Samples are colored based on if they are from different disease stage.
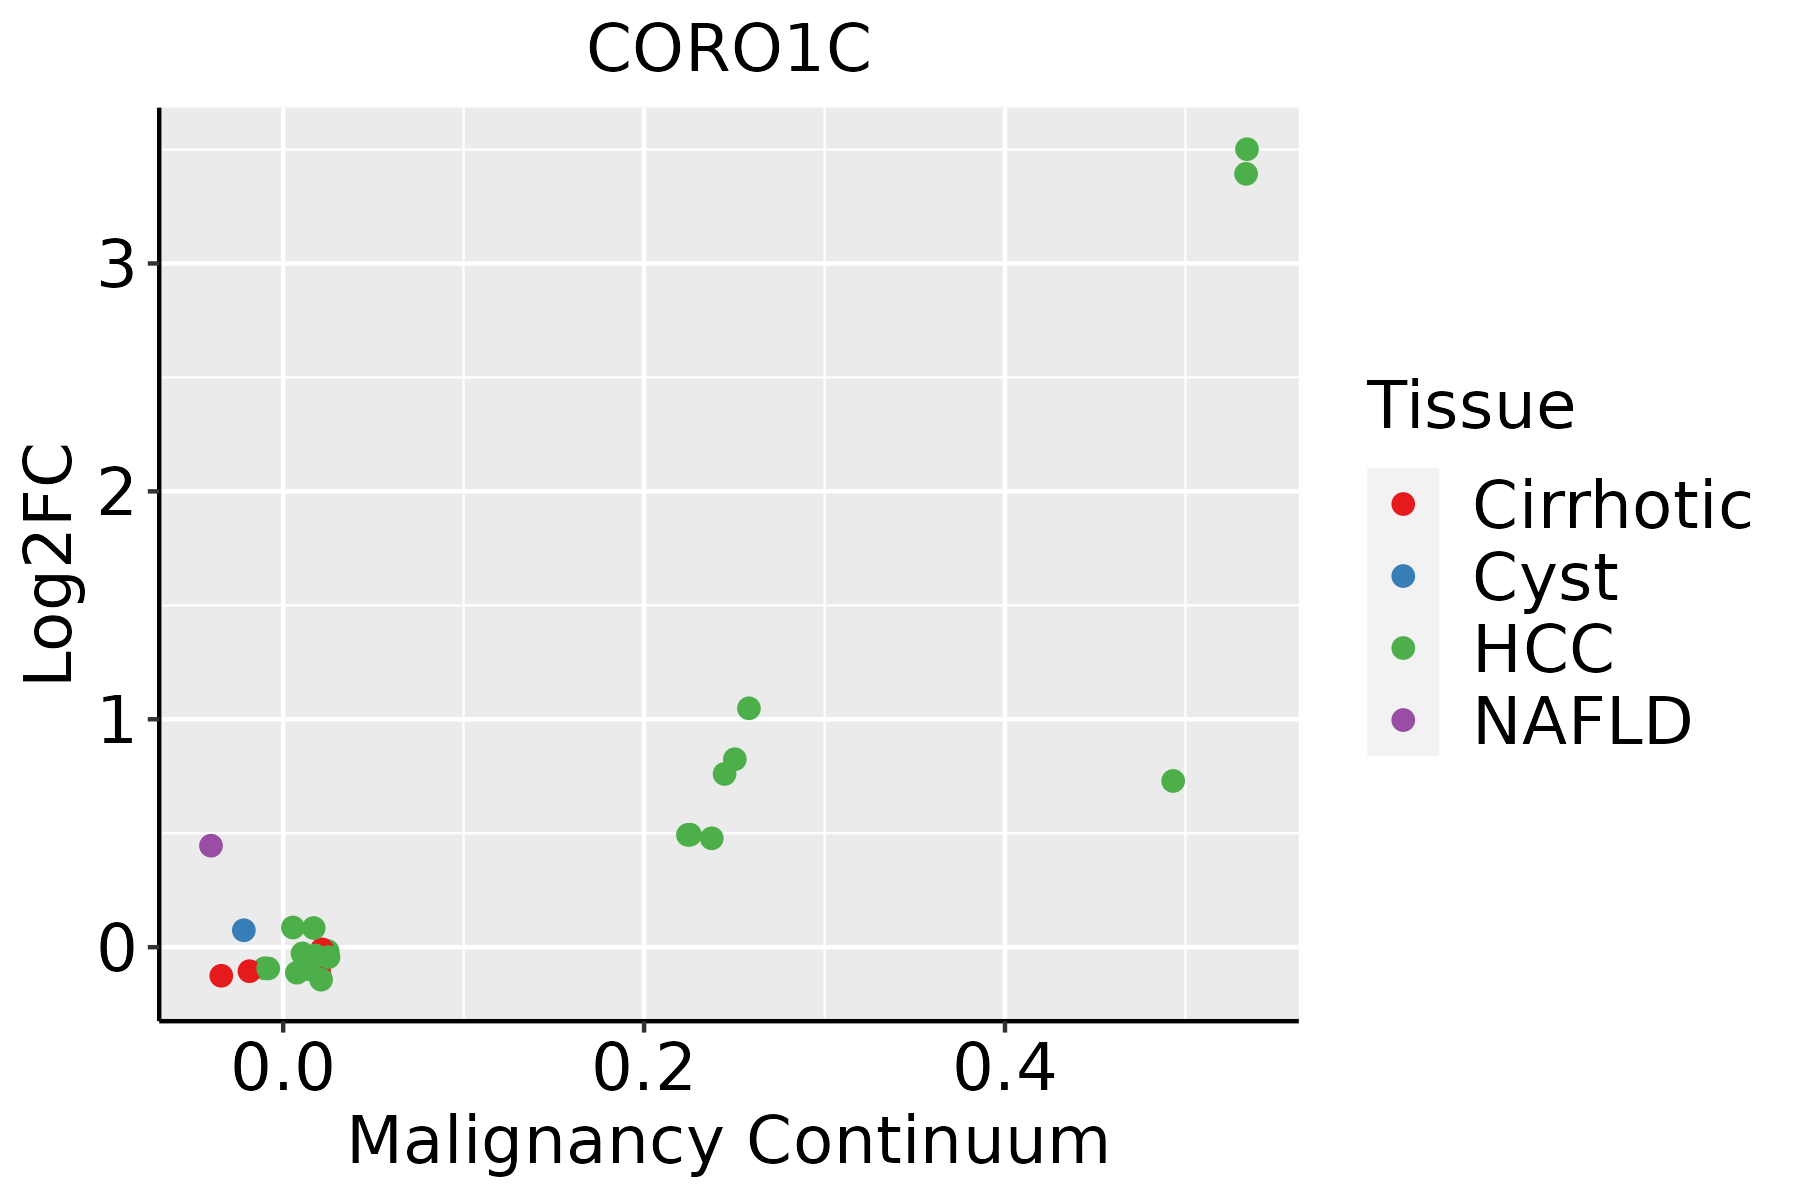
HCC: Hepatocellular carcinoma
NAFLD: Non-alcoholic fatty liver disease
Oral CavityThe image shows the transcriptomic changes along malignancy continuum.log2FC in expression of this searched gene in stem-like cells from each diseased tissue sample relative to stem-like cells in normal samples in each tissue plotted against the malignancy continuum. Samples are colored based on if they are from different disease stage.
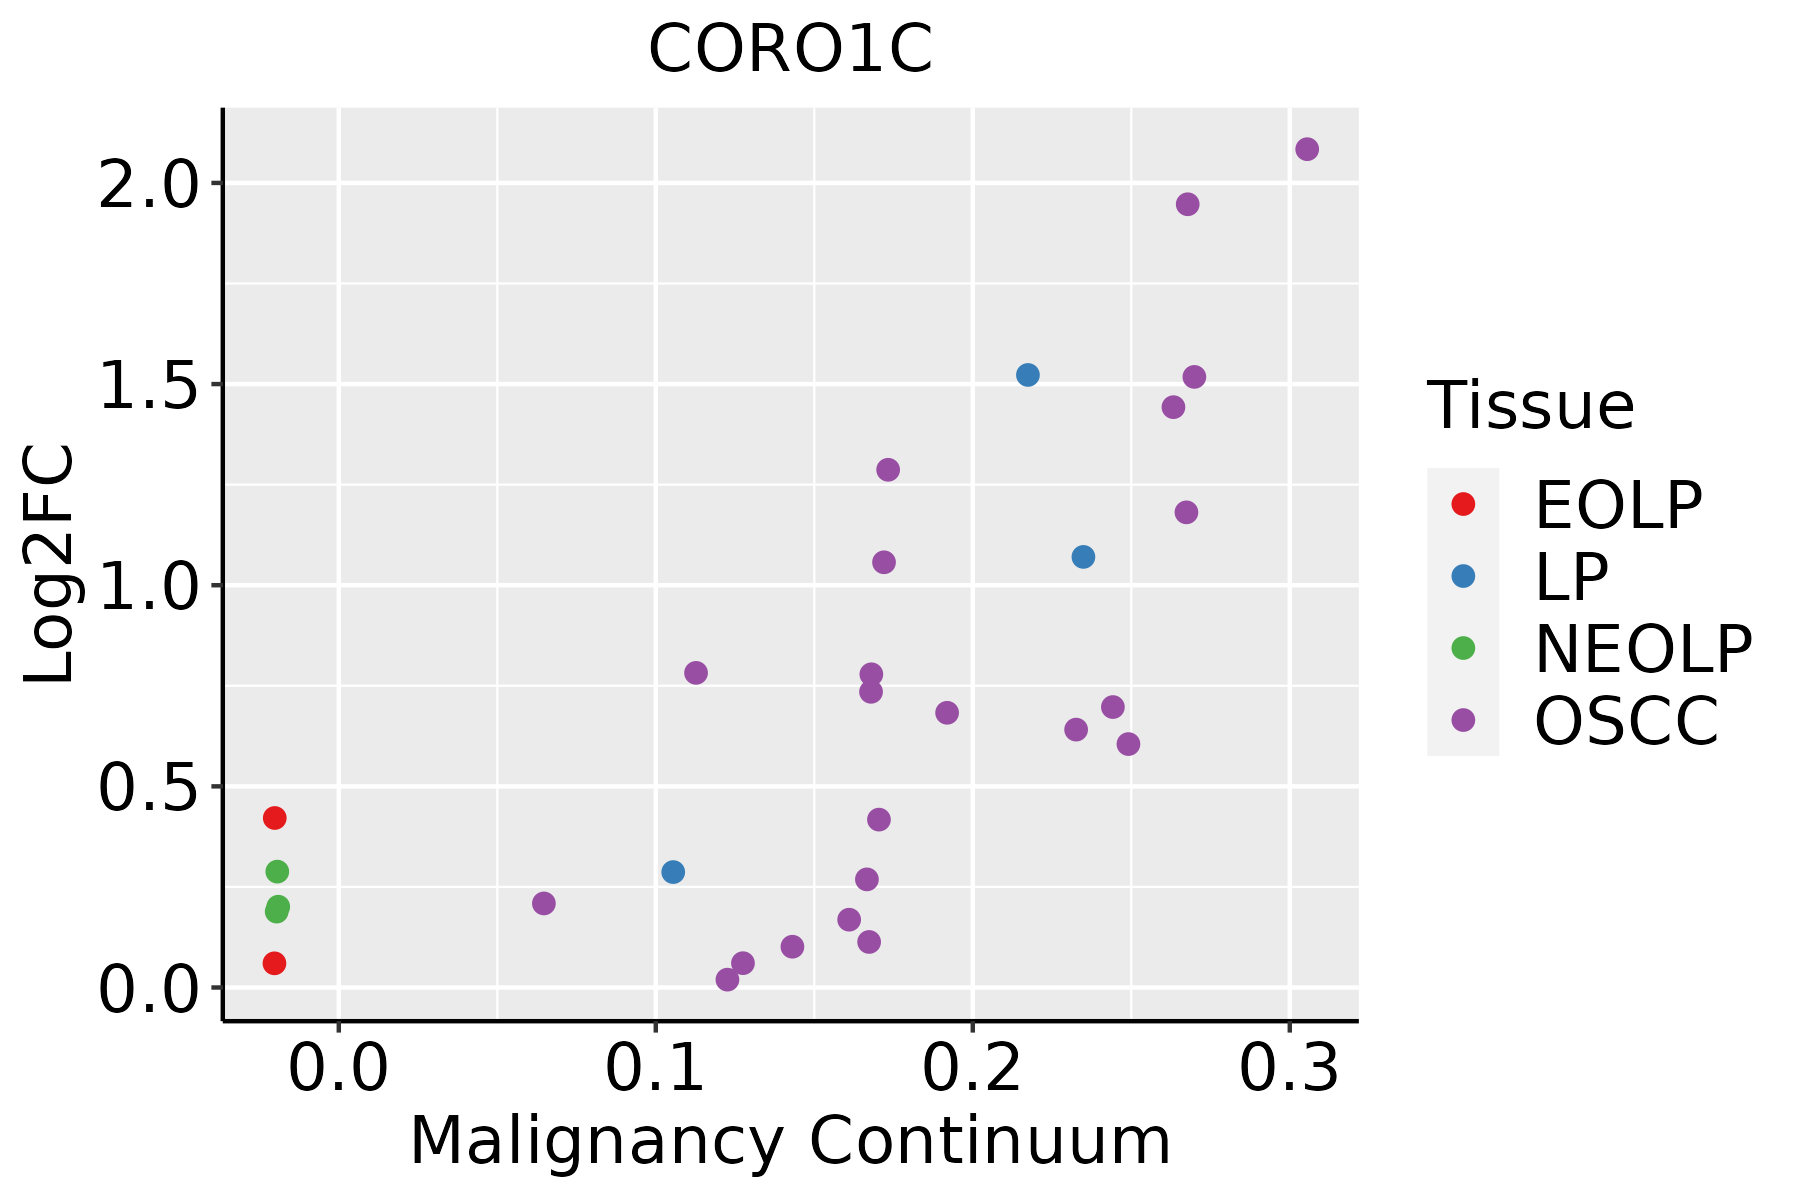
EOLP: Erosive Oral lichen planus
LP: leukoplakia
NEOLP: Non-erosive oral lichen planus
OSCC: Oral squamous cell carcinoma
ProstateThe image shows the transcriptomic changes along malignancy continuum.log2FC in expression of this searched gene in stem-like cells from each diseased tissue sample relative to stem-like cells in normal samples in each tissue plotted against the malignancy continuum. Samples are colored based on if they are from different disease stage.
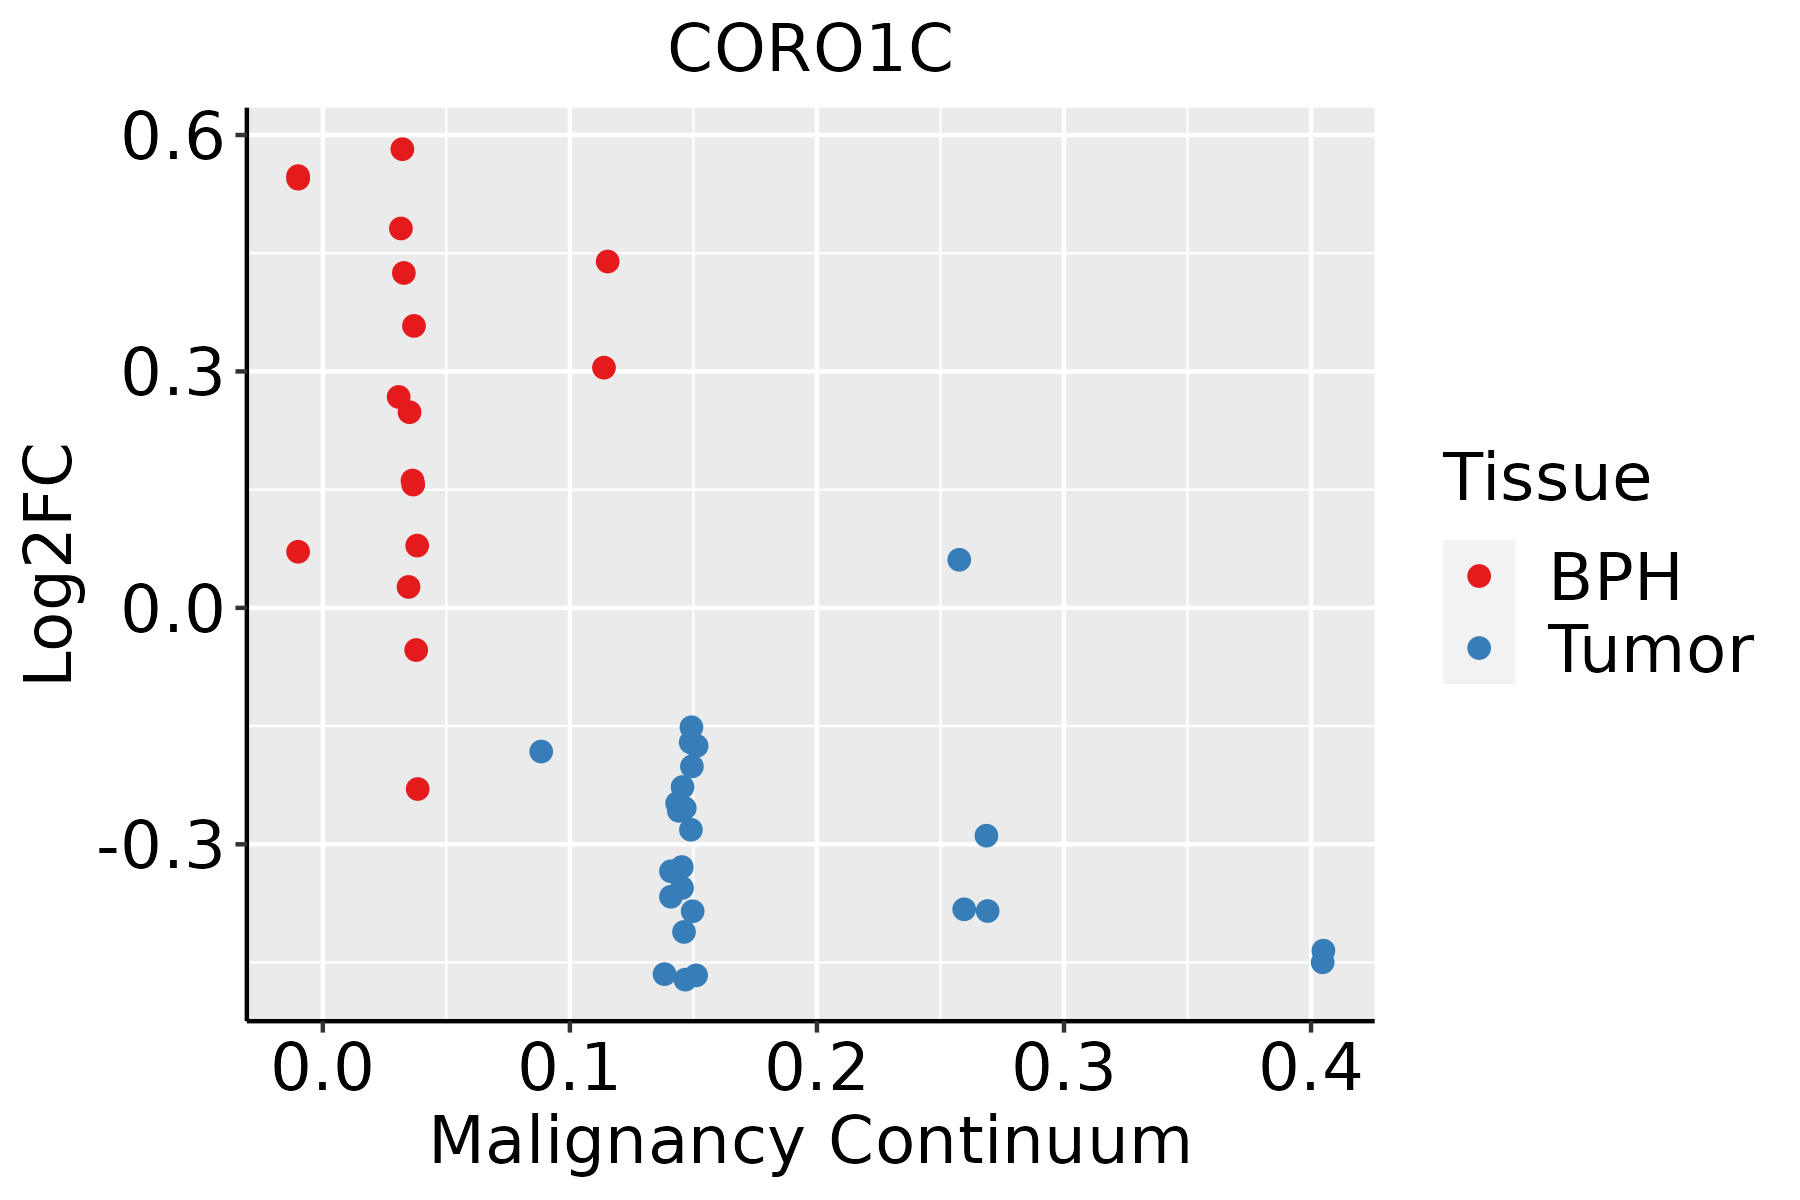
BPH: Benign Prostatic Hyperplasia
SkinThe image shows the transcriptomic changes along malignancy continuum.log2FC in expression of this searched gene in stem-like cells from each diseased tissue sample relative to stem-like cells in normal samples in each tissue plotted against the malignancy continuum. Samples are colored based on if they are from different disease stage.AK: Actinic keratosis
cSCC: Cutaneous squamous cell carcinoma
SCCIS:squamous cell carcinoma in situ
ThyroidThe image shows the transcriptomic changes along malignancy continuum.log2FC in expression of this searched gene in stem-like cells from each diseased tissue sample relative to stem-like cells in normal samples in each tissue plotted against the malignancy continuum. Samples are colored based on if they are from different disease stage.
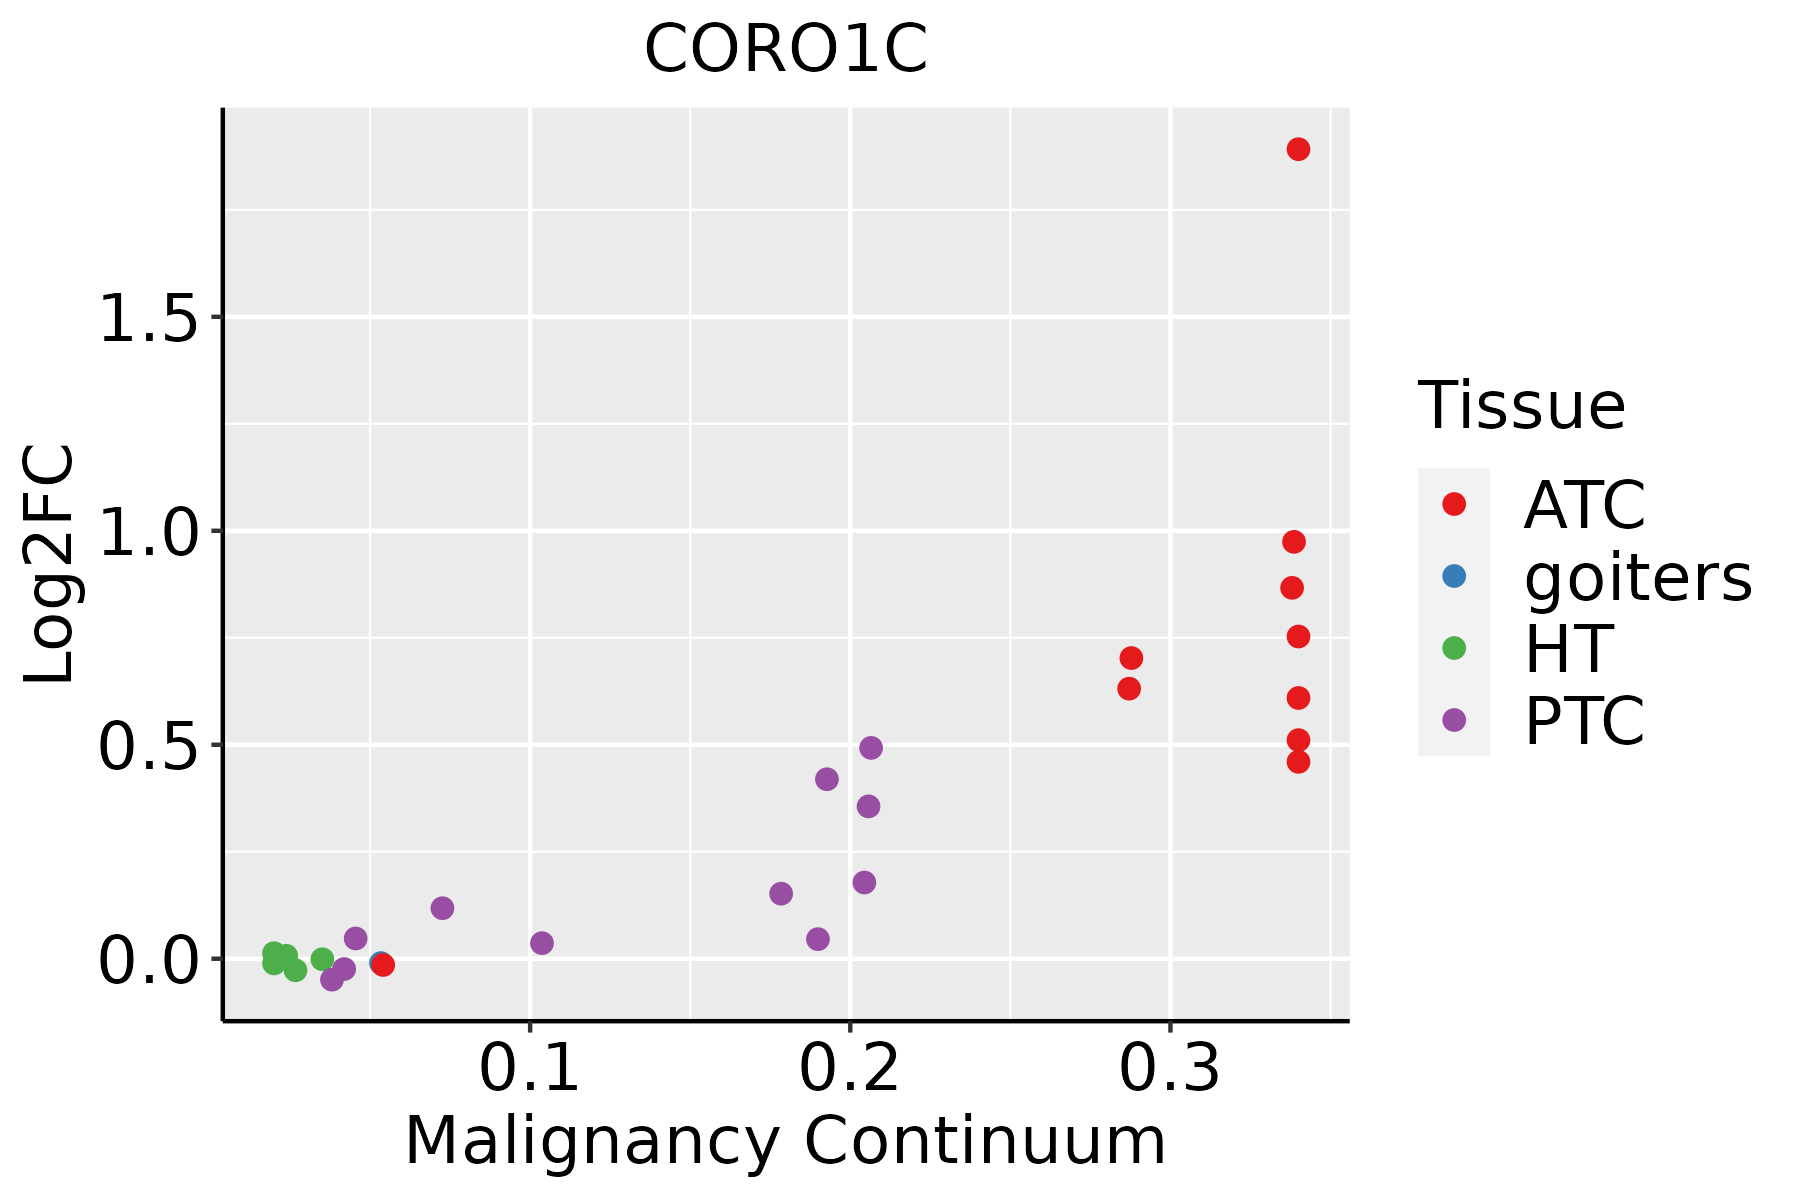
ATC: Anaplastic thyroid cancer
HT: Hashimoto's thyroiditis
PTC: Papillary thyroid cancer
∗log2FC in expression of this searched gene in stem-like cells from each diseased tissue sample relative to stem-like cells in normal samples in each tissue plotted against the malignancy continuum. Samples are colored based on if they are from different disease stage.

Top

Malignant transformation related pathway analysis

check buttonFind out the enriched GO biological processes and KEGG pathways involved in transition from healthy to precancer to cancer
check button Figure of enriched GO biological processes.
TissueDisease StageEnriched GO biological Processes
ColorectumADGO analysis - Figure of enriched GO biological processes: Top 15 enriched GO BP terms are showed in the bar plot of each disease state in each tissue. Each row represents a significant GO biological process which is colored according to the -log10(p.adjust).
ColorectumSERGO analysis - Figure of enriched GO biological processes: Top 15 enriched GO BP terms are showed in the bar plot of each disease state in each tissue. Each row represents a significant GO biological process which is colored according to the -log10(p.adjust).
ColorectumMSSGO analysis - Figure of enriched GO biological processes: Top 15 enriched GO BP terms are showed in the bar plot of each disease state in each tissue. Each row represents a significant GO biological process which is colored according to the -log10(p.adjust).
ColorectumMSI-HGO analysis - Figure of enriched GO biological processes: Top 15 enriched GO BP terms are showed in the bar plot of each disease state in each tissue. Each row represents a significant GO biological process which is colored according to the -log10(p.adjust).
ColorectumFAPGO analysis - Figure of enriched GO biological processes: Top 15 enriched GO BP terms are showed in the bar plot of each disease state in each tissue. Each row represents a significant GO biological process which is colored according to the -log10(p.adjust).
∗Top 15 enriched GO BP terms are showed in the bar plot of each disease state in each tissue. Each row represents a significant GO biological process which is colored according to the -log10(p.adjust).
Page: 1 2 3 4 5 6 7 8 9 

check button Enriched GO biological processes.
GO IDTissueDisease StageDescriptionGene RatioBg Ratiopvaluep.adjustCount
GO:009013216ProstateBPHepithelium migration104/3107360/187232.96e-091.15e-07104
GO:009013016ProstateBPHtissue migration105/3107365/187233.21e-091.24e-07105
GO:001063116ProstateBPHepithelial cell migration103/3107357/187233.80e-091.44e-07103
GO:001076916ProstateBPHregulation of cell morphogenesis involved in differentiation40/310796/187235.08e-091.86e-0740
GO:000166717ProstateBPHameboidal-type cell migration128/3107475/187235.69e-092.05e-07128
GO:003444616ProstateBPHsubstrate adhesion-dependent cell spreading43/3107108/187237.20e-092.50e-0743
GO:000195210ProstateBPHregulation of cell-matrix adhesion48/3107128/187239.98e-093.34e-0748
GO:001063216ProstateBPHregulation of epithelial cell migration87/3107292/187231.18e-083.87e-0787
GO:003432910ProstateBPHcell junction assembly114/3107420/187232.52e-087.49e-07114
GO:000193317ProstateBPHnegative regulation of protein phosphorylation97/3107342/187232.74e-088.11e-0797
GO:000716010ProstateBPHcell-matrix adhesion72/3107233/187234.17e-081.16e-0672
GO:190002416ProstateBPHregulation of substrate adhesion-dependent cell spreading27/310757/187236.30e-081.67e-0627
GO:00313469ProstateBPHpositive regulation of cell projection organization98/3107353/187237.34e-081.88e-0698
GO:005134818ProstateBPHnegative regulation of transferase activity78/3107268/187231.94e-074.29e-0678
GO:19018888ProstateBPHregulation of cell junction assembly62/3107204/187236.71e-071.30e-0562
GO:00160507ProstateBPHvesicle organization82/3107300/187231.64e-062.78e-0582
GO:00071628ProstateBPHnegative regulation of cell adhesion82/3107303/187232.51e-064.04e-0582
GO:000646916ProstateBPHnegative regulation of protein kinase activity62/3107212/187232.81e-064.45e-0562
GO:003367315ProstateBPHnegative regulation of kinase activity67/3107237/187234.15e-066.25e-0567
GO:19027439ProstateBPHregulation of lamellipodium organization23/310754/187235.78e-068.47e-0523
Page: 1 2 3 4 5 6 7 8 9 10 11 12 13 14 15 16 17 18 19 20 21 22 23 24 25 26 27 28 29 30 31 

check button Enriched KEGG pathways.
Pathway IDTissueDisease StageDescriptionGene RatioBg Ratiopvaluep.adjustqvalueCount
Page: 1 

Top

Cell-cell communication analysis

check buttonIdentification of potential cell-cell interactions between two cell types and their ligand-receptor pairs for different disease states
LigandReceptorLRpairPathwayTissueDisease Stage
Page: 1 

Top

Single-cell gene regulatory network inference analysis

check buttonFind out the significant the regulons (TFs) and the target genes of each regulon across cell types for different disease states
TFCell TypeTissueDisease StageTarget GeneRSSRegulon Activity
∗The dot plots of a searched regulon are shown for all cell subpopulations in each disease state of each tissue based on the regulon specific score inferred using pySCENIC and by calculating the average expression.
Page: 1 

Top

Somatic mutation of malignant transformation related genes

check buttonAnnotation of somatic variants for genes involved in malignant transformation
Hugo SymbolVariant ClassVariant ClassificationdbSNP RSHGVScHGVSpHGVSp ShortSWISSPROTBIOTYPESIFTPolyPhenTumor Sample BarcodeTissueHistologySexAgeStageTherapy TypesDrugsOutcome
CORO1CSNVMissense_Mutationc.803C>Tp.Ala268Valp.A268VQ9ULV4protein_codingtolerated(0.08)benign(0.052)TCGA-A7-A0CE-01Breastbreast invasive carcinomaFemale<65I/IIChemotherapyadriamycinSD
CORO1CSNVMissense_Mutationc.374N>Gp.Ser125Cysp.S125CQ9ULV4protein_codingdeleterious(0.03)benign(0.049)TCGA-A8-A06Q-01Breastbreast invasive carcinomaFemale<65III/IVUnknownUnknownSD
CORO1CSNVMissense_Mutationc.1531N>Gp.Gln511Glup.Q511EQ9ULV4protein_codingdeleterious(0.04)benign(0.127)TCGA-AC-A23H-01Breastbreast invasive carcinomaFemale>=65I/IIUnknownUnknownPD
CORO1CSNVMissense_Mutationc.1323N>Gp.Ile441Metp.I441MQ9ULV4protein_codingtolerated(0.54)benign(0.092)TCGA-AO-A0J9-01Breastbreast invasive carcinomaFemale<65III/IVChemotherapycyclophosphamidePD
CORO1CSNVMissense_Mutationnovelc.106N>Ap.His36Asnp.H36NQ9ULV4protein_codingtolerated_low_confidence(0.17)benign(0)TCGA-E9-A5UO-01Breastbreast invasive carcinomaFemale<65I/IIUnknownUnknownSD
CORO1CinsertionIn_Frame_Insnovelc.938_939insCAGACTTGTCTCTGGTTTCTTACAGGGTGACAGCAGTATp.His313_Glu314insArgLeuValSerGlyPheLeuGlnGlyAspSerSerIlep.H313_E314insRLVSGFLQGDSSIQ9ULV4protein_codingTCGA-A2-A0D2-01Breastbreast invasive carcinomaFemale<65I/IIChemotherapyadriamycinSD
CORO1CinsertionNonsense_Mutationnovelc.1256_1257insTAAATGAAGATAAGATATTTATTCCATCCATGTATp.Gly420LysfsTer2p.G420Kfs*2Q9ULV4protein_codingTCGA-BH-A0EE-01Breastbreast invasive carcinomaFemale>=65I/IIChemotherapydocetaxelSD
CORO1CSNVMissense_Mutationnovelc.59N>Ap.Arg20Hisp.R20HQ9ULV4protein_codingdeleterious_low_confidence(0.01)benign(0)TCGA-2W-A8YY-01Cervixcervical & endocervical cancerFemale<65I/IIChemotherapycisplatinCR
CORO1CSNVMissense_Mutationrs762661543c.1270N>Ap.Ala424Thrp.A424TQ9ULV4protein_codingdeleterious(0.01)possibly_damaging(0.742)TCGA-EA-A410-01Cervixcervical & endocervical cancerFemale<65I/IIUnknownUnknownSD
CORO1CSNVMissense_Mutationc.790N>Ap.Glu264Lysp.E264KQ9ULV4protein_codingdeleterious(0.01)possibly_damaging(0.479)TCGA-EK-A2RJ-01Cervixcervical & endocervical cancerFemale<65I/IIUnknownUnknownSD
Page: 1 2 3 4 5 6 

Top

Related drugs of malignant transformation related genes

check buttonIdentification of chemicals and drugs interact with genes involved in malignant transfromation
(DGIdb 4.0)
Entrez IDSymbolCategoryInteraction TypesDrug Claim NameDrug NamePMIDs
Page: 1