
|
|||||
|
 | |
| |
| |
| |
| |
| |
|
Gene: CHMP5 |
Gene summary for CHMP5 |
| Gene information | Species | Human | Gene symbol | CHMP5 | Gene ID | 51510 |
| Gene name | charged multivesicular body protein 5 | |
| Gene Alias | C9orf83 | |
| Cytomap | 9p13.3 | |
| Gene Type | protein-coding | GO ID | GO:0000070 | UniProtAcc | Q9NZZ3 |
Top |
Malignant transformation analysis |
| Identification of the aberrant gene expression in precancerous and cancerous lesions by comparing the gene expression of stem-like cells in diseased tissues with normal stem cells |
| Entrez ID | Symbol | Replicates | Species | Organ | Tissue | Adj P-value | Log2FC | Malignancy |
| 51510 | CHMP5 | HTA11_1938_2000001011 | Human | Colorectum | AD | 1.63e-02 | 2.86e-01 | -0.0811 |
| 51510 | CHMP5 | HTA11_78_2000001011 | Human | Colorectum | AD | 4.69e-02 | 1.58e-01 | -0.1088 |
| 51510 | CHMP5 | HTA11_347_2000001011 | Human | Colorectum | AD | 2.58e-06 | 3.17e-01 | -0.1954 |
| 51510 | CHMP5 | HTA11_83_2000001011 | Human | Colorectum | SER | 7.44e-03 | 2.42e-01 | -0.1526 |
| 51510 | CHMP5 | HTA11_696_2000001011 | Human | Colorectum | AD | 2.32e-02 | 1.49e-01 | -0.1464 |
| 51510 | CHMP5 | HTA11_1391_2000001011 | Human | Colorectum | AD | 1.45e-03 | 1.74e-01 | -0.059 |
| 51510 | CHMP5 | HTA11_5212_2000001011 | Human | Colorectum | AD | 9.39e-03 | 4.45e-01 | -0.2061 |
| 51510 | CHMP5 | HTA11_99999970781_79442 | Human | Colorectum | MSS | 4.47e-09 | 3.67e-01 | 0.294 |
| 51510 | CHMP5 | HTA11_99999965062_69753 | Human | Colorectum | MSI-H | 1.97e-03 | 7.43e-01 | 0.3487 |
| 51510 | CHMP5 | HTA11_99999965104_69814 | Human | Colorectum | MSS | 3.21e-07 | 4.41e-01 | 0.281 |
| 51510 | CHMP5 | HTA11_99999971662_82457 | Human | Colorectum | MSS | 2.25e-05 | 3.33e-01 | 0.3859 |
| 51510 | CHMP5 | AEH-subject1 | Human | Endometrium | AEH | 6.13e-10 | -3.06e-01 | -0.3059 |
| 51510 | CHMP5 | AEH-subject2 | Human | Endometrium | AEH | 2.88e-07 | -1.95e-01 | -0.2525 |
| 51510 | CHMP5 | AEH-subject3 | Human | Endometrium | AEH | 9.07e-13 | -2.38e-01 | -0.2576 |
| 51510 | CHMP5 | AEH-subject4 | Human | Endometrium | AEH | 1.77e-04 | -1.95e-01 | -0.2657 |
| 51510 | CHMP5 | AEH-subject5 | Human | Endometrium | AEH | 3.96e-02 | -2.05e-01 | -0.2953 |
| 51510 | CHMP5 | EEC-subject1 | Human | Endometrium | EEC | 8.78e-17 | -3.63e-01 | -0.2682 |
| 51510 | CHMP5 | EEC-subject2 | Human | Endometrium | EEC | 2.13e-15 | -3.44e-01 | -0.2607 |
| 51510 | CHMP5 | EEC-subject3 | Human | Endometrium | EEC | 3.19e-38 | -3.59e-01 | -0.2525 |
| 51510 | CHMP5 | EEC-subject4 | Human | Endometrium | EEC | 3.09e-05 | 1.14e-02 | -0.2571 |
| Page: 1 2 3 4 5 6 7 8 |
| Tissue | Expression Dynamics | Abbreviation |
| Colorectum (GSE201348) |  | FAP: Familial adenomatous polyposis |
| CRC: Colorectal cancer | ||
| Colorectum (HTA11) |  | AD: Adenomas |
| SER: Sessile serrated lesions | ||
| MSI-H: Microsatellite-high colorectal cancer | ||
| MSS: Microsatellite stable colorectal cancer | ||
| Endometrium |  | AEH: Atypical endometrial hyperplasia |
| EEC: Endometrioid Cancer | ||
| Esophagus |  | ESCC: Esophageal squamous cell carcinoma |
| HGIN: High-grade intraepithelial neoplasias | ||
| LGIN: Low-grade intraepithelial neoplasias | ||
| Liver |  | HCC: Hepatocellular carcinoma |
| NAFLD: Non-alcoholic fatty liver disease | ||
| Oral Cavity |  | EOLP: Erosive Oral lichen planus |
| LP: leukoplakia | ||
| NEOLP: Non-erosive oral lichen planus | ||
| OSCC: Oral squamous cell carcinoma | ||
| Prostate |  | BPH: Benign Prostatic Hyperplasia |
| Skin | 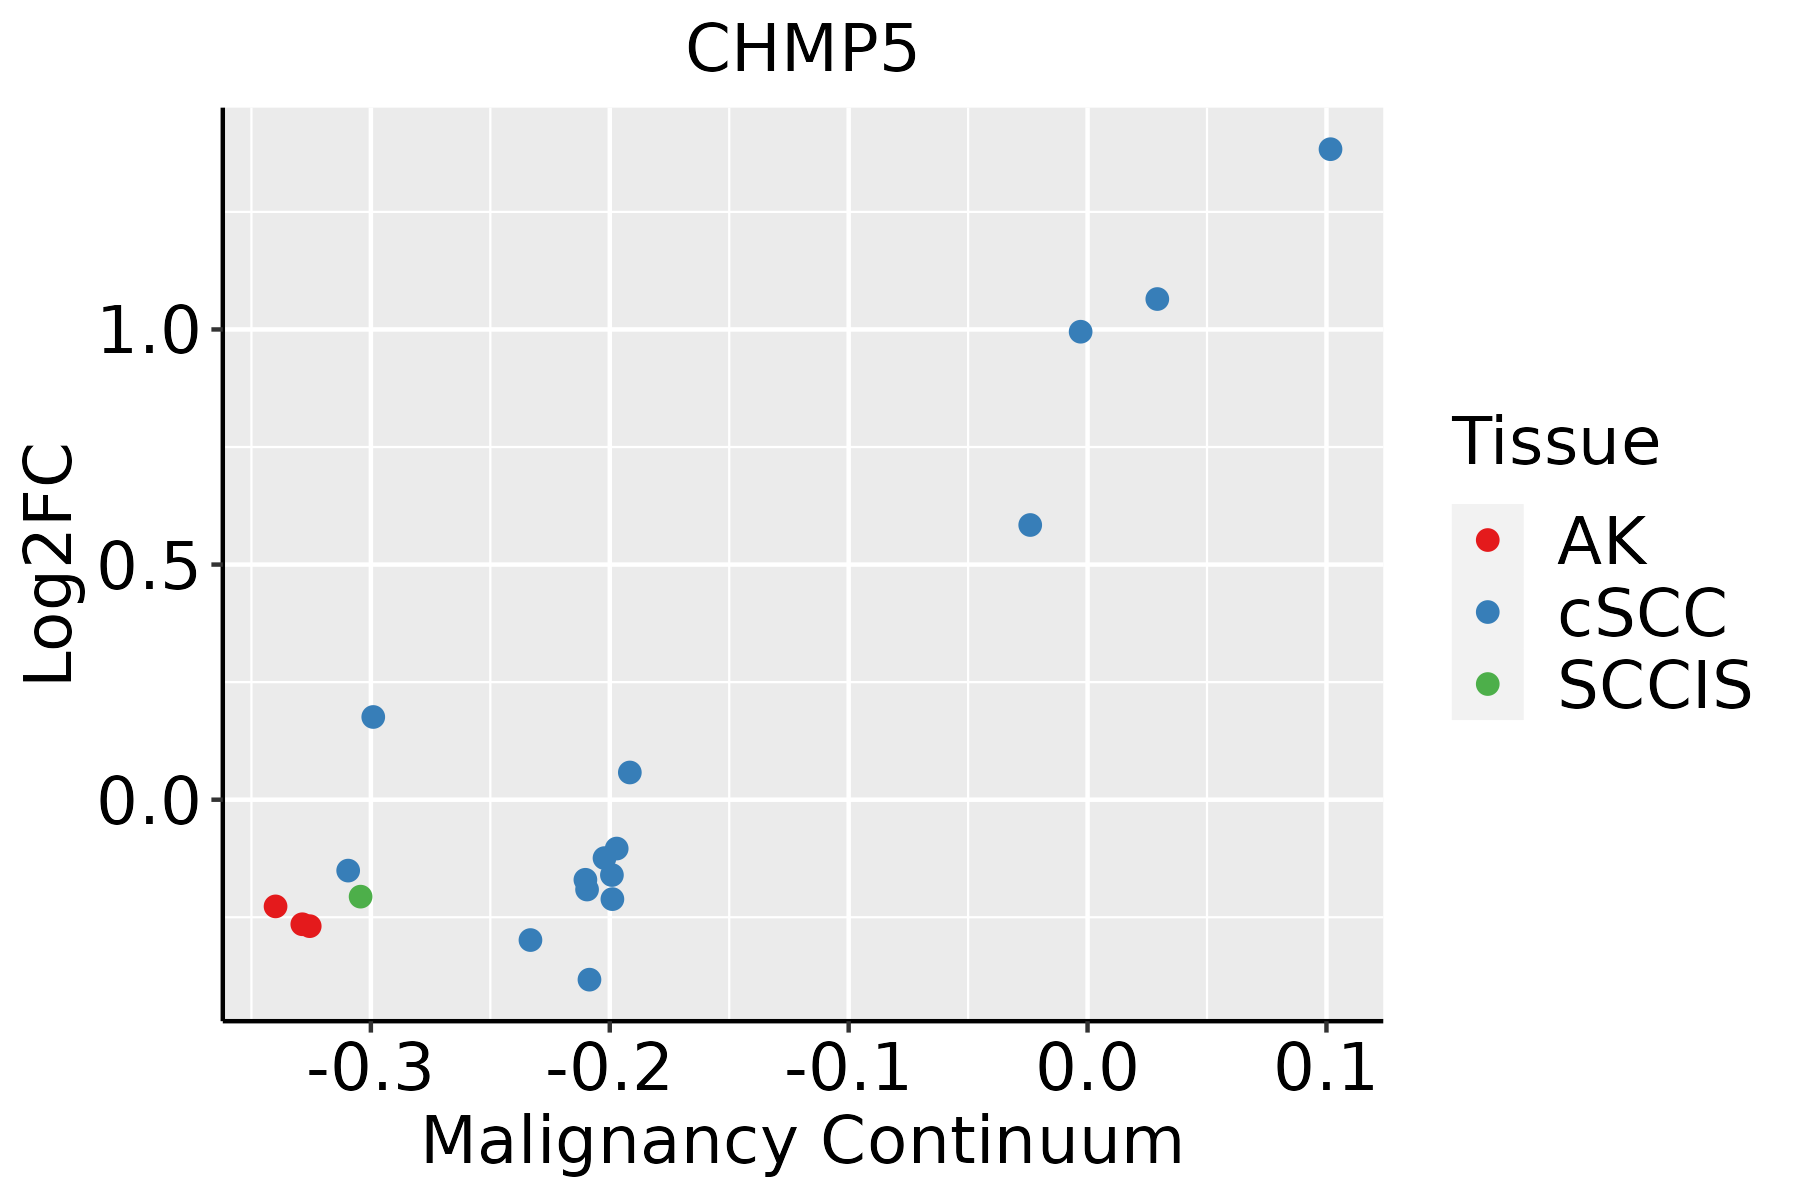 | AK: Actinic keratosis |
| cSCC: Cutaneous squamous cell carcinoma | ||
| SCCIS:squamous cell carcinoma in situ | ||
| Thyroid |  | ATC: Anaplastic thyroid cancer |
| HT: Hashimoto's thyroiditis | ||
| PTC: Papillary thyroid cancer |
| ∗log2FC in expression of this searched gene in stem-like cells from each diseased tissue sample relative to stem-like cells in normal samples in each tissue plotted against the malignancy continuum. Samples are colored based on if they are from different disease stage. |
Top |
Malignant transformation related pathway analysis |
| Find out the enriched GO biological processes and KEGG pathways involved in transition from healthy to precancer to cancer |
| Tissue | Disease Stage | Enriched GO biological Processes |
| Colorectum | AD |  |
| Colorectum | SER |  |
| Colorectum | MSS |  |
| Colorectum | MSI-H |  |
| Colorectum | FAP |  |
| ∗Top 15 enriched GO BP terms are showed in the bar plot of each disease state in each tissue. Each row represents a significant GO biological process which is colored according to the -log10(p.adjust). |
| Page: 1 2 3 4 5 6 7 8 9 |
| GO ID | Tissue | Disease Stage | Description | Gene Ratio | Bg Ratio | pvalue | p.adjust | Count |
| GO:00362585 | Oral cavity | OSCC | multivesicular body assembly | 28/7305 | 30/18723 | 5.89e-10 | 1.52e-08 | 28 |
| GO:00070327 | Oral cavity | OSCC | endosome organization | 59/7305 | 82/18723 | 1.41e-09 | 3.39e-08 | 59 |
| GO:190165316 | Oral cavity | OSCC | cellular response to peptide | 194/7305 | 359/18723 | 4.31e-09 | 9.57e-08 | 194 |
| GO:00069974 | Oral cavity | OSCC | nucleus organization | 85/7305 | 133/18723 | 5.12e-09 | 1.12e-07 | 85 |
| GO:00325065 | Oral cavity | OSCC | cytokinetic process | 33/7305 | 39/18723 | 5.91e-09 | 1.26e-07 | 33 |
| GO:00002815 | Oral cavity | OSCC | mitotic cytokinesis | 51/7305 | 71/18723 | 2.01e-08 | 3.95e-07 | 51 |
| GO:00719855 | Oral cavity | OSCC | multivesicular body sorting pathway | 31/7305 | 37/18723 | 2.80e-08 | 5.41e-07 | 31 |
| GO:00325096 | Oral cavity | OSCC | endosome transport via multivesicular body sorting pathway | 27/7305 | 31/18723 | 4.29e-08 | 8.03e-07 | 27 |
| GO:19021155 | Oral cavity | OSCC | regulation of organelle assembly | 109/7305 | 186/18723 | 4.54e-08 | 8.45e-07 | 109 |
| GO:00190686 | Oral cavity | OSCC | virion assembly | 29/7305 | 35/18723 | 1.30e-07 | 2.20e-06 | 29 |
| GO:00070402 | Oral cavity | OSCC | lysosome organization | 51/7305 | 74/18723 | 1.77e-07 | 2.87e-06 | 51 |
| GO:00801712 | Oral cavity | OSCC | lytic vacuole organization | 51/7305 | 74/18723 | 1.77e-07 | 2.87e-06 | 51 |
| GO:00903076 | Oral cavity | OSCC | mitotic spindle assembly | 46/7305 | 65/18723 | 2.06e-07 | 3.29e-06 | 46 |
| GO:00512255 | Oral cavity | OSCC | spindle assembly | 73/7305 | 117/18723 | 2.51e-07 | 3.96e-06 | 73 |
| GO:00453244 | Oral cavity | OSCC | late endosome to vacuole transport | 22/7305 | 25/18723 | 5.68e-07 | 8.19e-06 | 22 |
| GO:003249617 | Oral cavity | OSCC | response to lipopolysaccharide | 178/7305 | 343/18723 | 7.27e-07 | 1.03e-05 | 178 |
| GO:00467555 | Oral cavity | OSCC | viral budding | 22/7305 | 26/18723 | 2.32e-06 | 2.93e-05 | 22 |
| GO:00070418 | Oral cavity | OSCC | lysosomal transport | 69/7305 | 114/18723 | 2.62e-06 | 3.26e-05 | 69 |
| GO:19024107 | Oral cavity | OSCC | mitotic cytokinetic process | 20/7305 | 23/18723 | 2.91e-06 | 3.56e-05 | 20 |
| GO:00325112 | Oral cavity | OSCC | late endosome to vacuole transport via multivesicular body sorting pathway | 16/7305 | 17/18723 | 3.07e-06 | 3.72e-05 | 16 |
| Page: 1 2 3 4 5 6 7 8 9 10 11 12 13 14 15 16 17 18 19 20 21 22 23 24 25 26 27 28 29 30 31 32 33 34 35 36 37 |
| Pathway ID | Tissue | Disease Stage | Description | Gene Ratio | Bg Ratio | pvalue | p.adjust | qvalue | Count |
| hsa04144 | Colorectum | AD | Endocytosis | 111/2092 | 251/8465 | 5.95e-12 | 1.42e-10 | 9.08e-11 | 111 |
| hsa041441 | Colorectum | AD | Endocytosis | 111/2092 | 251/8465 | 5.95e-12 | 1.42e-10 | 9.08e-11 | 111 |
| hsa041442 | Colorectum | SER | Endocytosis | 81/1580 | 251/8465 | 1.14e-07 | 2.36e-06 | 1.71e-06 | 81 |
| hsa04217 | Colorectum | SER | Necroptosis | 47/1580 | 159/8465 | 5.21e-04 | 4.44e-03 | 3.22e-03 | 47 |
| hsa041443 | Colorectum | SER | Endocytosis | 81/1580 | 251/8465 | 1.14e-07 | 2.36e-06 | 1.71e-06 | 81 |
| hsa042171 | Colorectum | SER | Necroptosis | 47/1580 | 159/8465 | 5.21e-04 | 4.44e-03 | 3.22e-03 | 47 |
| hsa041444 | Colorectum | MSS | Endocytosis | 102/1875 | 251/8465 | 1.85e-11 | 4.43e-10 | 2.71e-10 | 102 |
| hsa041445 | Colorectum | MSS | Endocytosis | 102/1875 | 251/8465 | 1.85e-11 | 4.43e-10 | 2.71e-10 | 102 |
| hsa0414420 | Endometrium | AEH | Endocytosis | 56/1197 | 251/8465 | 2.58e-04 | 2.15e-03 | 1.57e-03 | 56 |
| hsa04144110 | Endometrium | AEH | Endocytosis | 56/1197 | 251/8465 | 2.58e-04 | 2.15e-03 | 1.57e-03 | 56 |
| hsa0414424 | Endometrium | EEC | Endocytosis | 57/1237 | 251/8465 | 3.34e-04 | 2.82e-03 | 2.10e-03 | 57 |
| hsa0414434 | Endometrium | EEC | Endocytosis | 57/1237 | 251/8465 | 3.34e-04 | 2.82e-03 | 2.10e-03 | 57 |
| hsa04144210 | Esophagus | ESCC | Endocytosis | 186/4205 | 251/8465 | 9.74e-16 | 4.66e-14 | 2.39e-14 | 186 |
| hsa0414437 | Esophagus | ESCC | Endocytosis | 186/4205 | 251/8465 | 9.74e-16 | 4.66e-14 | 2.39e-14 | 186 |
| hsa0414412 | Liver | Cirrhotic | Endocytosis | 119/2530 | 251/8465 | 2.33e-09 | 4.56e-08 | 2.81e-08 | 119 |
| hsa0414413 | Liver | Cirrhotic | Endocytosis | 119/2530 | 251/8465 | 2.33e-09 | 4.56e-08 | 2.81e-08 | 119 |
| hsa0414422 | Liver | HCC | Endocytosis | 178/4020 | 251/8465 | 2.03e-14 | 5.22e-13 | 2.91e-13 | 178 |
| hsa0414432 | Liver | HCC | Endocytosis | 178/4020 | 251/8465 | 2.03e-14 | 5.22e-13 | 2.91e-13 | 178 |
| hsa0414427 | Oral cavity | OSCC | Endocytosis | 174/3704 | 251/8465 | 9.42e-17 | 4.51e-15 | 2.29e-15 | 174 |
| hsa04144112 | Oral cavity | OSCC | Endocytosis | 174/3704 | 251/8465 | 9.42e-17 | 4.51e-15 | 2.29e-15 | 174 |
| Page: 1 2 |
Top |
Cell-cell communication analysis |
| Identification of potential cell-cell interactions between two cell types and their ligand-receptor pairs for different disease states |
| Ligand | Receptor | LRpair | Pathway | Tissue | Disease Stage |
| Page: 1 |
Top |
Single-cell gene regulatory network inference analysis |
| Find out the significant the regulons (TFs) and the target genes of each regulon across cell types for different disease states |
| TF | Cell Type | Tissue | Disease Stage | Target Gene | RSS | Regulon Activity |
| ∗The dot plots of a searched regulon are shown for all cell subpopulations in each disease state of each tissue based on the regulon specific score inferred using pySCENIC and by calculating the average expression. |
| Page: 1 |
Top |
Somatic mutation of malignant transformation related genes |
| Annotation of somatic variants for genes involved in malignant transformation |
| Hugo Symbol | Variant Class | Variant Classification | dbSNP RS | HGVSc | HGVSp | HGVSp Short | SWISSPROT | BIOTYPE | SIFT | PolyPhen | Tumor Sample Barcode | Tissue | Histology | Sex | Age | Stage | Therapy Types | Drugs | Outcome |
| CHMP5 | SNV | Missense_Mutation | c.107N>G | p.Ser36Cys | p.S36C | Q9NZZ3 | protein_coding | deleterious(0.02) | possibly_damaging(0.676) | TCGA-A2-A0CL-01 | Breast | breast invasive carcinoma | Female | <65 | III/IV | Chemotherapy | cytoxan | SD | |
| CHMP5 | SNV | Missense_Mutation | c.80G>C | p.Arg27Thr | p.R27T | Q9NZZ3 | protein_coding | deleterious(0) | probably_damaging(1) | TCGA-C5-A1BQ-01 | Cervix | cervical & endocervical cancer | Female | >=65 | III/IV | Chemotherapy | cisplatin | CR | |
| CHMP5 | SNV | Missense_Mutation | novel | c.261C>A | p.Phe87Leu | p.F87L | Q9NZZ3 | protein_coding | deleterious(0) | benign(0.35) | TCGA-CA-6717-01 | Colorectum | colon adenocarcinoma | Male | <65 | I/II | Chemotherapy | oxaliplatin | CR |
| CHMP5 | SNV | Missense_Mutation | rs758726437 | c.376N>A | p.Asp126Asn | p.D126N | Q9NZZ3 | protein_coding | tolerated(0.13) | benign(0.08) | TCGA-D5-6928-01 | Colorectum | colon adenocarcinoma | Male | >=65 | I/II | Unknown | Unknown | SD |
| CHMP5 | SNV | Missense_Mutation | c.138N>T | p.Lys46Asn | p.K46N | Q9NZZ3 | protein_coding | deleterious(0) | possibly_damaging(0.547) | TCGA-AG-A002-01 | Colorectum | rectum adenocarcinoma | Male | <65 | I/II | Unknown | Unknown | SD | |
| CHMP5 | SNV | Missense_Mutation | rs758726437 | c.376N>A | p.Asp126Asn | p.D126N | Q9NZZ3 | protein_coding | tolerated(0.13) | benign(0.08) | TCGA-A5-A0G2-01 | Endometrium | uterine corpus endometrioid carcinoma | Female | <65 | III/IV | Unknown | Unknown | SD |
| CHMP5 | SNV | Missense_Mutation | c.551N>G | p.Asp184Gly | p.D184G | Q9NZZ3 | protein_coding | tolerated(0.12) | benign(0.137) | TCGA-AP-A059-01 | Endometrium | uterine corpus endometrioid carcinoma | Female | >=65 | I/II | Unknown | Unknown | SD | |
| CHMP5 | SNV | Missense_Mutation | novel | c.433N>G | p.Ile145Val | p.I145V | Q9NZZ3 | protein_coding | tolerated(0.39) | benign(0.019) | TCGA-AX-A06F-01 | Endometrium | uterine corpus endometrioid carcinoma | Female | <65 | III/IV | Chemotherapy | carboplatin | SD |
| CHMP5 | SNV | Missense_Mutation | novel | c.343N>A | p.Glu115Lys | p.E115K | Q9NZZ3 | protein_coding | deleterious(0.01) | benign(0.41) | TCGA-AX-A2HC-01 | Endometrium | uterine corpus endometrioid carcinoma | Female | <65 | III/IV | Chemotherapy | paclitaxel | PD |
| CHMP5 | SNV | Missense_Mutation | c.337N>T | p.Val113Leu | p.V113L | Q9NZZ3 | protein_coding | tolerated(0.4) | benign(0.001) | TCGA-B5-A11E-01 | Endometrium | uterine corpus endometrioid carcinoma | Female | <65 | I/II | Unknown | Unknown | SD |
| Page: 1 2 3 |
Top |
Related drugs of malignant transformation related genes |
| Identification of chemicals and drugs interact with genes involved in malignant transfromation |
| (DGIdb 4.0) |
| Entrez ID | Symbol | Category | Interaction Types | Drug Claim Name | Drug Name | PMIDs |
| Page: 1 |

Copyright 2023-Present -The University of Texas Health Science Center at Houston |