
|
|||||
|
 | |
| |
| |
| |
| |
| |
|
Gene: BIN1 |
Gene summary for BIN1 |
| Gene information | Species | Human | Gene symbol | BIN1 | Gene ID | 274 |
| Gene name | bridging integrator 1 | |
| Gene Alias | AMPH2 | |
| Cytomap | 2q14.3 | |
| Gene Type | protein-coding | GO ID | GO:0001508 | UniProtAcc | A0A024RAG9 |
Top |
Malignant transformation analysis |
| Identification of the aberrant gene expression in precancerous and cancerous lesions by comparing the gene expression of stem-like cells in diseased tissues with normal stem cells |
| Entrez ID | Symbol | Replicates | Species | Organ | Tissue | Adj P-value | Log2FC | Malignancy |
| 274 | BIN1 | HTA11_3410_2000001011 | Human | Colorectum | AD | 4.76e-06 | 1.52e-01 | 0.0155 |
| 274 | BIN1 | HTA11_1938_2000001011 | Human | Colorectum | AD | 1.74e-07 | 4.14e-01 | -0.0811 |
| 274 | BIN1 | HTA11_347_2000001011 | Human | Colorectum | AD | 1.21e-03 | 2.08e-01 | -0.1954 |
| 274 | BIN1 | HTA11_696_2000001011 | Human | Colorectum | AD | 1.11e-04 | 2.54e-01 | -0.1464 |
| 274 | BIN1 | HTA11_866_2000001011 | Human | Colorectum | AD | 1.81e-03 | 2.09e-01 | -0.1001 |
| 274 | BIN1 | HTA11_1391_2000001011 | Human | Colorectum | AD | 2.55e-12 | 5.49e-01 | -0.059 |
| 274 | BIN1 | HTA11_866_3004761011 | Human | Colorectum | AD | 1.58e-17 | 5.03e-01 | 0.096 |
| 274 | BIN1 | HTA11_4255_2000001011 | Human | Colorectum | SER | 2.54e-03 | 5.27e-01 | 0.0446 |
| 274 | BIN1 | HTA11_9408_2000001011 | Human | Colorectum | AD | 1.70e-06 | 7.87e-01 | 0.0451 |
| 274 | BIN1 | HTA11_8622_2000001021 | Human | Colorectum | SER | 1.96e-09 | 6.72e-01 | 0.0528 |
| 274 | BIN1 | HTA11_7663_2000001011 | Human | Colorectum | SER | 6.54e-04 | 4.61e-01 | 0.0131 |
| 274 | BIN1 | HTA11_6801_2000001011 | Human | Colorectum | SER | 6.63e-04 | 5.42e-01 | 0.0171 |
| 274 | BIN1 | HTA11_10711_2000001011 | Human | Colorectum | AD | 1.10e-05 | 3.01e-01 | 0.0338 |
| 274 | BIN1 | HTA11_7696_3000711011 | Human | Colorectum | AD | 6.10e-22 | 6.00e-01 | 0.0674 |
| 274 | BIN1 | HTA11_6818_2000001011 | Human | Colorectum | AD | 2.41e-04 | 4.16e-01 | 0.0112 |
| 274 | BIN1 | HTA11_6818_2000001021 | Human | Colorectum | AD | 4.44e-02 | 2.84e-01 | 0.0588 |
| 274 | BIN1 | HTA11_99999970781_79442 | Human | Colorectum | MSS | 1.94e-18 | 5.82e-01 | 0.294 |
| 274 | BIN1 | HTA11_99999971662_82457 | Human | Colorectum | MSS | 1.18e-38 | 1.11e+00 | 0.3859 |
| 274 | BIN1 | HTA11_99999974143_84620 | Human | Colorectum | MSS | 1.54e-32 | 7.35e-01 | 0.3005 |
| 274 | BIN1 | LZE4T | Human | Esophagus | ESCC | 2.82e-04 | 1.42e-01 | 0.0811 |
| Page: 1 2 3 4 5 |
| Tissue | Expression Dynamics | Abbreviation |
| Colorectum (GSE201348) | 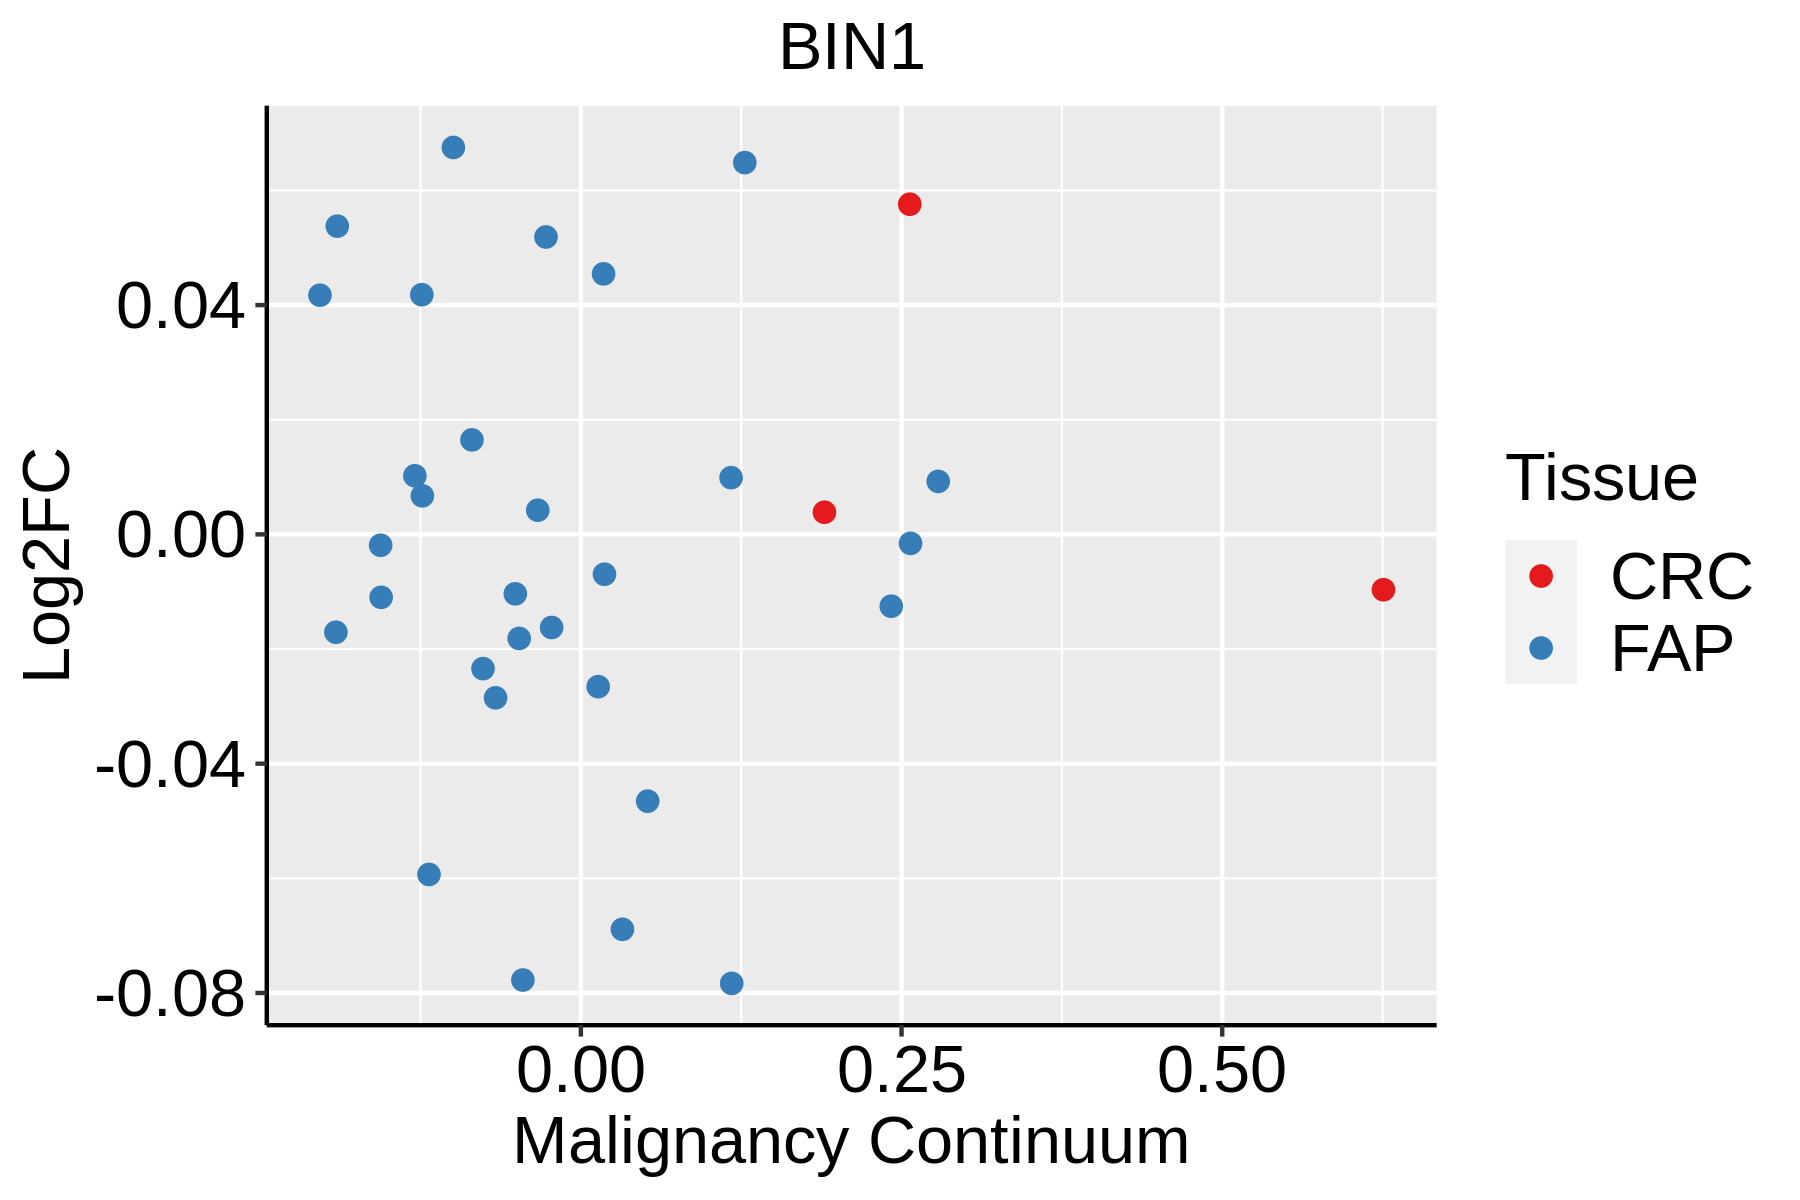 | FAP: Familial adenomatous polyposis |
| CRC: Colorectal cancer | ||
| Colorectum (HTA11) |  | AD: Adenomas |
| SER: Sessile serrated lesions | ||
| MSI-H: Microsatellite-high colorectal cancer | ||
| MSS: Microsatellite stable colorectal cancer | ||
| Esophagus |  | ESCC: Esophageal squamous cell carcinoma |
| HGIN: High-grade intraepithelial neoplasias | ||
| LGIN: Low-grade intraepithelial neoplasias | ||
| Liver | 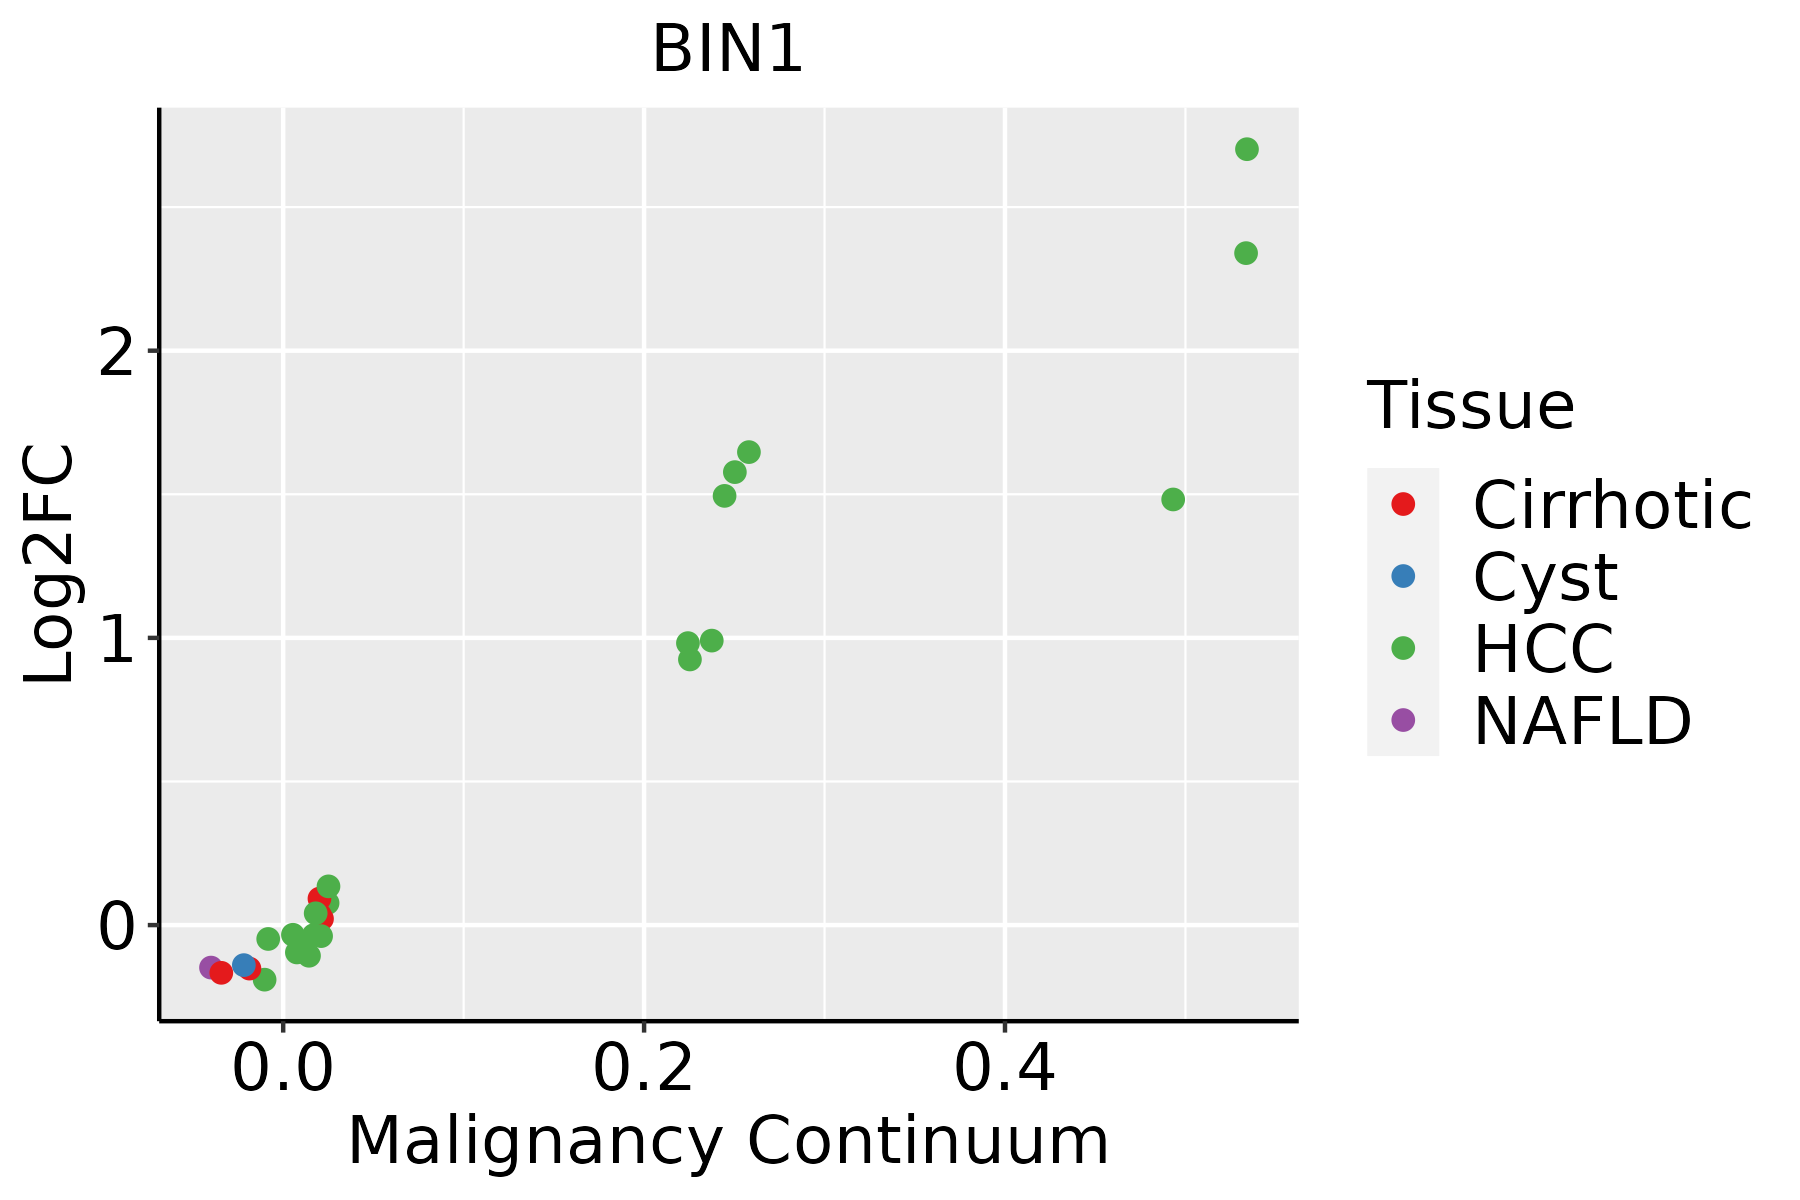 | HCC: Hepatocellular carcinoma |
| NAFLD: Non-alcoholic fatty liver disease | ||
| Oral Cavity | 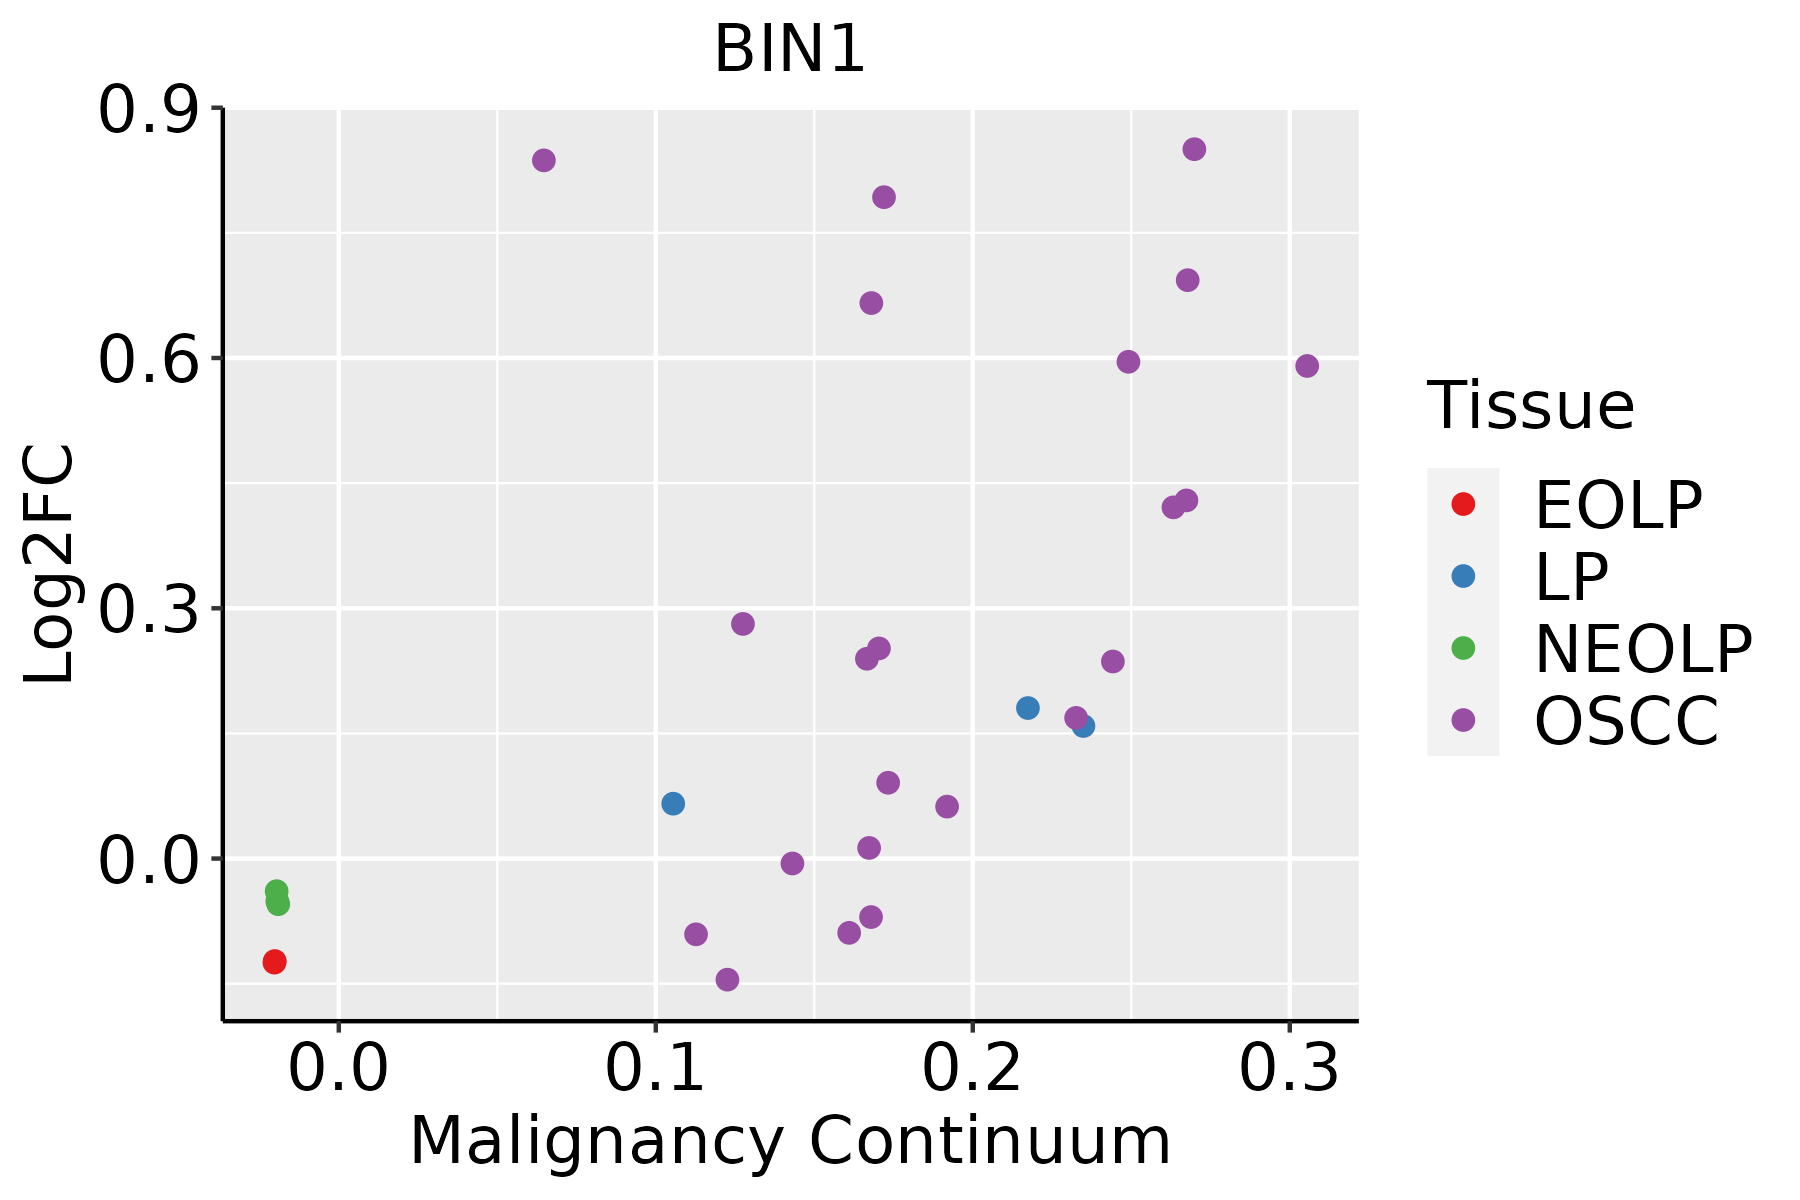 | EOLP: Erosive Oral lichen planus |
| LP: leukoplakia | ||
| NEOLP: Non-erosive oral lichen planus | ||
| OSCC: Oral squamous cell carcinoma | ||
| Thyroid | 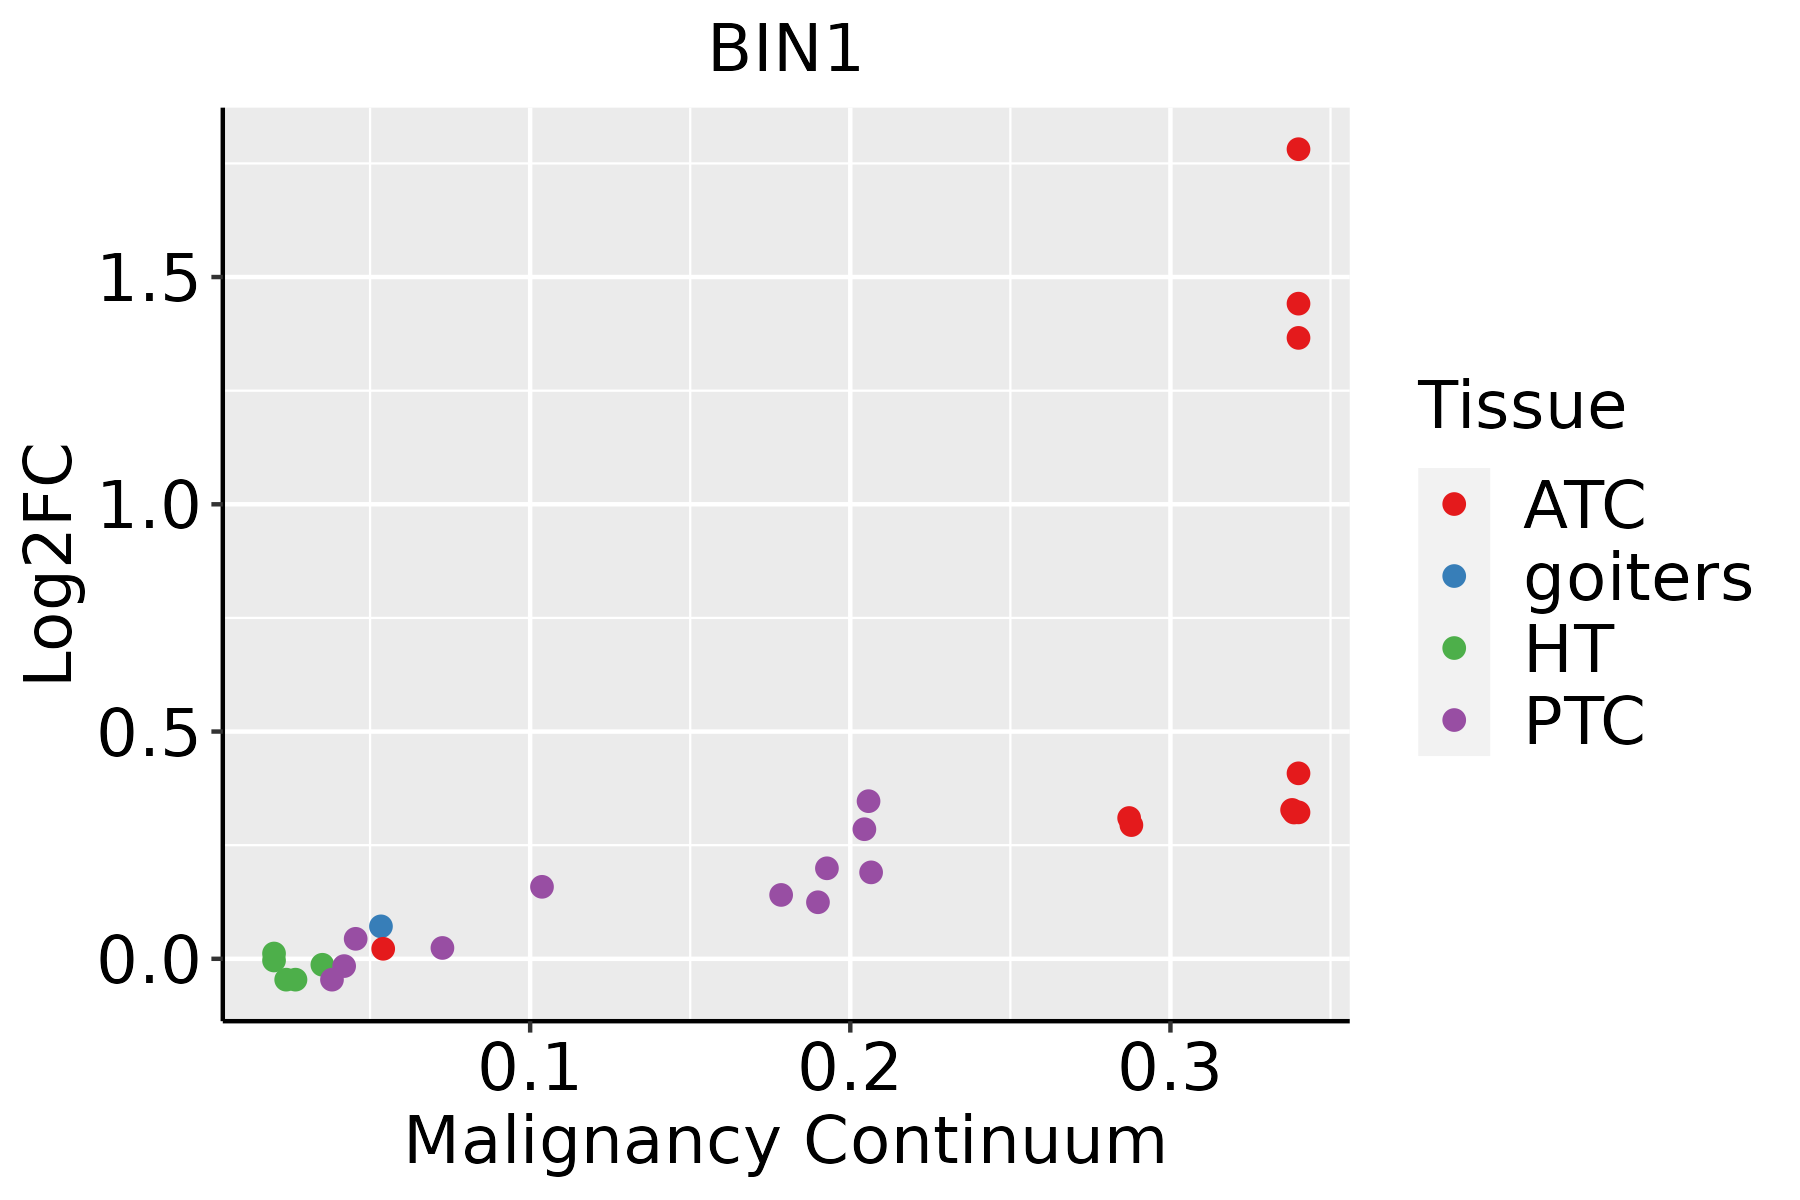 | ATC: Anaplastic thyroid cancer |
| HT: Hashimoto's thyroiditis | ||
| PTC: Papillary thyroid cancer |
| ∗log2FC in expression of this searched gene in stem-like cells from each diseased tissue sample relative to stem-like cells in normal samples in each tissue plotted against the malignancy continuum. Samples are colored based on if they are from different disease stage. |
Top |
Malignant transformation related pathway analysis |
| Find out the enriched GO biological processes and KEGG pathways involved in transition from healthy to precancer to cancer |
| Tissue | Disease Stage | Enriched GO biological Processes |
| Colorectum | AD |  |
| Colorectum | SER |  |
| Colorectum | MSS |  |
| Colorectum | MSI-H |  |
| Colorectum | FAP |  |
| ∗Top 15 enriched GO BP terms are showed in the bar plot of each disease state in each tissue. Each row represents a significant GO biological process which is colored according to the -log10(p.adjust). |
| Page: 1 2 3 4 5 6 7 8 9 |
| GO ID | Tissue | Disease Stage | Description | Gene Ratio | Bg Ratio | pvalue | p.adjust | Count |
| GO:005196014 | Thyroid | ATC | regulation of nervous system development | 195/6293 | 443/18723 | 2.62e-06 | 3.06e-05 | 195 |
| GO:005254734 | Thyroid | ATC | regulation of peptidase activity | 200/6293 | 461/18723 | 6.25e-06 | 6.52e-05 | 200 |
| GO:005196221 | Thyroid | ATC | positive regulation of nervous system development | 126/6293 | 272/18723 | 8.17e-06 | 8.27e-05 | 126 |
| GO:004269216 | Thyroid | ATC | muscle cell differentiation | 165/6293 | 384/18723 | 7.17e-05 | 5.46e-04 | 165 |
| GO:0030838110 | Thyroid | ATC | positive regulation of actin filament polymerization | 52/6293 | 99/18723 | 7.88e-05 | 5.94e-04 | 52 |
| GO:003424923 | Thyroid | ATC | negative regulation of cellular amide metabolic process | 121/6293 | 273/18723 | 1.36e-04 | 9.57e-04 | 121 |
| GO:005254834 | Thyroid | ATC | regulation of endopeptidase activity | 181/6293 | 432/18723 | 1.70e-04 | 1.16e-03 | 181 |
| GO:000699714 | Thyroid | ATC | nucleus organization | 65/6293 | 133/18723 | 1.87e-04 | 1.26e-03 | 65 |
| GO:004586134 | Thyroid | ATC | negative regulation of proteolysis | 146/6293 | 351/18723 | 9.84e-04 | 5.22e-03 | 146 |
| GO:004206323 | Thyroid | ATC | gliogenesis | 127/6293 | 301/18723 | 1.07e-03 | 5.66e-03 | 127 |
| GO:000633813 | Thyroid | ATC | chromatin remodeling | 109/6293 | 255/18723 | 1.38e-03 | 7.15e-03 | 109 |
| GO:005134629 | Thyroid | ATC | negative regulation of hydrolase activity | 155/6293 | 379/18723 | 1.64e-03 | 8.23e-03 | 155 |
| GO:00718242 | Thyroid | ATC | protein-DNA complex subunit organization | 103/6293 | 241/18723 | 1.84e-03 | 9.03e-03 | 103 |
| GO:005127117 | Thyroid | ATC | negative regulation of cellular component movement | 150/6293 | 367/18723 | 1.99e-03 | 9.54e-03 | 150 |
| GO:005500112 | Thyroid | ATC | muscle cell development | 81/6293 | 184/18723 | 2.02e-03 | 9.60e-03 | 81 |
| GO:000833311 | Thyroid | ATC | endosome to lysosome transport | 29/6293 | 55/18723 | 2.65e-03 | 1.22e-02 | 29 |
| GO:005105114 | Thyroid | ATC | negative regulation of transport | 183/6293 | 470/18723 | 8.12e-03 | 3.13e-02 | 183 |
| GO:003420521 | Thyroid | ATC | amyloid-beta formation | 28/6293 | 57/18723 | 1.09e-02 | 3.94e-02 | 28 |
| GO:005043521 | Thyroid | ATC | amyloid-beta metabolic process | 32/6293 | 67/18723 | 1.13e-02 | 4.04e-02 | 32 |
| Page: 1 2 3 4 5 6 7 8 9 10 11 12 13 14 15 16 17 18 19 |
| Pathway ID | Tissue | Disease Stage | Description | Gene Ratio | Bg Ratio | pvalue | p.adjust | qvalue | Count |
| hsa04144 | Colorectum | AD | Endocytosis | 111/2092 | 251/8465 | 5.95e-12 | 1.42e-10 | 9.08e-11 | 111 |
| hsa04666 | Colorectum | AD | Fc gamma R-mediated phagocytosis | 46/2092 | 97/8465 | 9.10e-07 | 1.22e-05 | 7.77e-06 | 46 |
| hsa041441 | Colorectum | AD | Endocytosis | 111/2092 | 251/8465 | 5.95e-12 | 1.42e-10 | 9.08e-11 | 111 |
| hsa046661 | Colorectum | AD | Fc gamma R-mediated phagocytosis | 46/2092 | 97/8465 | 9.10e-07 | 1.22e-05 | 7.77e-06 | 46 |
| hsa041442 | Colorectum | SER | Endocytosis | 81/1580 | 251/8465 | 1.14e-07 | 2.36e-06 | 1.71e-06 | 81 |
| hsa046662 | Colorectum | SER | Fc gamma R-mediated phagocytosis | 39/1580 | 97/8465 | 5.84e-07 | 9.70e-06 | 7.04e-06 | 39 |
| hsa041443 | Colorectum | SER | Endocytosis | 81/1580 | 251/8465 | 1.14e-07 | 2.36e-06 | 1.71e-06 | 81 |
| hsa046663 | Colorectum | SER | Fc gamma R-mediated phagocytosis | 39/1580 | 97/8465 | 5.84e-07 | 9.70e-06 | 7.04e-06 | 39 |
| hsa041444 | Colorectum | MSS | Endocytosis | 102/1875 | 251/8465 | 1.85e-11 | 4.43e-10 | 2.71e-10 | 102 |
| hsa046664 | Colorectum | MSS | Fc gamma R-mediated phagocytosis | 45/1875 | 97/8465 | 9.30e-08 | 1.56e-06 | 9.55e-07 | 45 |
| hsa041445 | Colorectum | MSS | Endocytosis | 102/1875 | 251/8465 | 1.85e-11 | 4.43e-10 | 2.71e-10 | 102 |
| hsa046665 | Colorectum | MSS | Fc gamma R-mediated phagocytosis | 45/1875 | 97/8465 | 9.30e-08 | 1.56e-06 | 9.55e-07 | 45 |
| hsa04144210 | Esophagus | ESCC | Endocytosis | 186/4205 | 251/8465 | 9.74e-16 | 4.66e-14 | 2.39e-14 | 186 |
| hsa0466620 | Esophagus | ESCC | Fc gamma R-mediated phagocytosis | 63/4205 | 97/8465 | 1.63e-03 | 4.89e-03 | 2.50e-03 | 63 |
| hsa0414437 | Esophagus | ESCC | Endocytosis | 186/4205 | 251/8465 | 9.74e-16 | 4.66e-14 | 2.39e-14 | 186 |
| hsa04666110 | Esophagus | ESCC | Fc gamma R-mediated phagocytosis | 63/4205 | 97/8465 | 1.63e-03 | 4.89e-03 | 2.50e-03 | 63 |
| hsa0414412 | Liver | Cirrhotic | Endocytosis | 119/2530 | 251/8465 | 2.33e-09 | 4.56e-08 | 2.81e-08 | 119 |
| hsa0414413 | Liver | Cirrhotic | Endocytosis | 119/2530 | 251/8465 | 2.33e-09 | 4.56e-08 | 2.81e-08 | 119 |
| hsa0414422 | Liver | HCC | Endocytosis | 178/4020 | 251/8465 | 2.03e-14 | 5.22e-13 | 2.91e-13 | 178 |
| hsa0466610 | Liver | HCC | Fc gamma R-mediated phagocytosis | 58/4020 | 97/8465 | 9.65e-03 | 2.52e-02 | 1.40e-02 | 58 |
| Page: 1 2 |
Top |
Cell-cell communication analysis |
| Identification of potential cell-cell interactions between two cell types and their ligand-receptor pairs for different disease states |
| Ligand | Receptor | LRpair | Pathway | Tissue | Disease Stage |
| Page: 1 |
Top |
Single-cell gene regulatory network inference analysis |
| Find out the significant the regulons (TFs) and the target genes of each regulon across cell types for different disease states |
| TF | Cell Type | Tissue | Disease Stage | Target Gene | RSS | Regulon Activity |
| ∗The dot plots of a searched regulon are shown for all cell subpopulations in each disease state of each tissue based on the regulon specific score inferred using pySCENIC and by calculating the average expression. |
| Page: 1 |
Top |
Somatic mutation of malignant transformation related genes |
| Annotation of somatic variants for genes involved in malignant transformation |
| Hugo Symbol | Variant Class | Variant Classification | dbSNP RS | HGVSc | HGVSp | HGVSp Short | SWISSPROT | BIOTYPE | SIFT | PolyPhen | Tumor Sample Barcode | Tissue | Histology | Sex | Age | Stage | Therapy Types | Drugs | Outcome |
| BIN1 | SNV | Missense_Mutation | c.908N>G | p.Ser303Cys | p.S303C | O00499 | protein_coding | deleterious(0.04) | probably_damaging(0.957) | TCGA-AC-A23H-01 | Breast | breast invasive carcinoma | Female | >=65 | I/II | Unknown | Unknown | PD | |
| BIN1 | SNV | Missense_Mutation | rs779552563 | c.865G>A | p.Ala289Thr | p.A289T | O00499 | protein_coding | tolerated(0.48) | benign(0.021) | TCGA-BH-A0HA-01 | Breast | breast invasive carcinoma | Female | <65 | I/II | Unknown | Unknown | SD |
| BIN1 | insertion | Nonsense_Mutation | novel | c.1061_1062insCTAGGACTAGAACTAAGGAACTGAGGCTGCAGGTGTCTGGGTGG | p.Lys354AsnfsTer2 | p.K354Nfs*2 | O00499 | protein_coding | TCGA-A2-A04Y-01 | Breast | breast invasive carcinoma | Female | <65 | I/II | Chemotherapy | cytoxan | SD | ||
| BIN1 | SNV | Missense_Mutation | rs759691190 | c.1747N>A | p.Val583Ile | p.V583I | O00499 | protein_coding | deleterious(0.02) | benign(0.136) | TCGA-5M-AAT6-01 | Colorectum | colon adenocarcinoma | Female | <65 | III/IV | Unknown | Unknown | PD |
| BIN1 | SNV | Missense_Mutation | c.1618C>A | p.Gln540Lys | p.Q540K | O00499 | protein_coding | deleterious(0.05) | probably_damaging(0.979) | TCGA-AA-3947-01 | Colorectum | colon adenocarcinoma | Female | <65 | I/II | Unknown | Unknown | SD | |
| BIN1 | SNV | Missense_Mutation | novel | c.446A>G | p.Asp149Gly | p.D149G | O00499 | protein_coding | deleterious(0) | probably_damaging(0.96) | TCGA-AA-3949-01 | Colorectum | colon adenocarcinoma | Female | >=65 | III/IV | Unknown | Unknown | SD |
| BIN1 | SNV | Missense_Mutation | c.1309N>A | p.Ala437Thr | p.A437T | O00499 | protein_coding | tolerated(0.11) | benign(0) | TCGA-AA-A010-01 | Colorectum | colon adenocarcinoma | Female | <65 | I/II | Chemotherapy | folinic | CR | |
| BIN1 | SNV | Missense_Mutation | c.1745N>T | p.Gly582Val | p.G582V | O00499 | protein_coding | deleterious(0) | probably_damaging(1) | TCGA-AG-A02G-01 | Colorectum | rectum adenocarcinoma | Male | >=65 | III/IV | Chemotherapy | folinic | PD | |
| BIN1 | deletion | Frame_Shift_Del | c.550delN | p.Gln184SerfsTer12 | p.Q184Sfs*12 | O00499 | protein_coding | TCGA-AY-6197-01 | Colorectum | colon adenocarcinoma | Male | <65 | I/II | Unknown | Unknown | SD | |||
| BIN1 | SNV | Missense_Mutation | rs794727107 | c.1142N>T | p.Pro381Leu | p.P381L | O00499 | protein_coding | tolerated(0.08) | possibly_damaging(0.46) | TCGA-4E-A92E-01 | Endometrium | uterine corpus endometrioid carcinoma | Female | <65 | I/II | Unknown | Unknown | SD |
| Page: 1 2 3 4 5 |
Top |
Related drugs of malignant transformation related genes |
| Identification of chemicals and drugs interact with genes involved in malignant transfromation |
| (DGIdb 4.0) |
| Entrez ID | Symbol | Category | Interaction Types | Drug Claim Name | Drug Name | PMIDs |
| Page: 1 |

Copyright 2023-Present -The University of Texas Health Science Center at Houston |