Schematic overview of the cellular and molecular mechanisms involved in the cancer progression, including the proposed cellular and molecular mechanisms in cancer cells trajectory. AT1: alveolar type 1 cells; AT2: alveolar type 2 cells; AAH: atypical adenomatous hyperplasia; AIS: adenocarcinoma in situ; MIA: minimally invasive adenocarcinoma; IA: invasive adenocarcinoma; EMT: epithelial-mesenchymal transition

Home

Download

Statistics

Help

Contact

Center for Computational Systems Medicine
leaf

Gene summary

leaf

Malignant transformation analysis

leaf

Malignant transformation related pathway analysis

leaf

Cell-cell communication analysis

leaf

Single-cell gene regulatory network inference analysis

leaf

Somatic mutation of malignant transformation related genes

leaf

Related drugs of malignant transformation related genes

Gene: ARID5B

Gene summary for ARID5B

check button Gene summary.

Gene informationSpeciesHuman
Gene symbol

ARID5B

Gene ID

84159

Gene nameAT-rich interaction domain 5B
Gene AliasDESRT
Cytomap10q21.2
Gene Typeprotein-coding
GO ID

GO:0000003

UniProtAcc

Q14865


Top

Malignant transformation analysis

check button Identification of the aberrant gene expression in precancerous and cancerous lesions by comparing the gene expression of stem-like cells in diseased tissues with normal stem cells
check button Malignant transformation involving gene list.
Entrez IDSymbolReplicatesSpeciesOrganTissueAdj P-valueLog2FCMalignancy
84159ARID5BGSM4909281HumanBreastIDC8.67e-10-4.29e-010.21
84159ARID5BGSM4909282HumanBreastIDC2.18e-07-3.80e-01-0.0288
84159ARID5BGSM4909285HumanBreastIDC3.50e-03-2.16e-010.21
84159ARID5BGSM4909286HumanBreastIDC3.96e-08-2.91e-010.1081
84159ARID5BGSM4909287HumanBreastIDC2.18e-11-4.90e-010.2057
84159ARID5BGSM4909288HumanBreastIDC1.26e-03-5.59e-010.0988
84159ARID5BGSM4909290HumanBreastIDC1.76e-02-3.41e-010.2096
84159ARID5BGSM4909291HumanBreastIDC6.20e-04-4.32e-010.1753
84159ARID5BGSM4909293HumanBreastIDC9.40e-061.24e-010.1581
84159ARID5BGSM4909294HumanBreastIDC2.55e-03-3.07e-010.2022
84159ARID5BGSM4909295HumanBreastIDC3.18e-02-3.69e-010.0898
84159ARID5BGSM4909296HumanBreastIDC1.59e-07-4.04e-010.1524
84159ARID5BGSM4909297HumanBreastIDC1.07e-07-3.39e-010.1517
84159ARID5BGSM4909298HumanBreastIDC1.63e-04-3.55e-010.1551
84159ARID5BGSM4909301HumanBreastIDC9.42e-24-6.39e-010.1577
84159ARID5BGSM4909302HumanBreastIDC7.54e-20-5.70e-010.1545
84159ARID5BGSM4909304HumanBreastIDC3.15e-27-6.25e-010.1636
84159ARID5BGSM4909307HumanBreastIDC3.32e-04-3.32e-010.1569
84159ARID5BGSM4909308HumanBreastIDC6.51e-11-5.10e-010.158
84159ARID5BGSM4909311HumanBreastIDC7.69e-26-5.38e-010.1534
Page: 1 2 3 4 5 6 7 8 9 10 11 12 

check button Transcriptomic changes along malignancy continuum.
TissueExpression DynamicsAbbreviation
BreastThe image shows the transcriptomic changes along malignancy continuum.log2FC in expression of this searched gene in stem-like cells from each diseased tissue sample relative to stem-like cells in normal samples in each tissue plotted against the malignancy continuum. Samples are colored based on if they are from different disease stage.IDC: Invasive ductal carcinoma
DCIS: Ductal carcinoma in situ
Precancer(BRCA1-mut): Precancerous lesion from BRCA1 mutation carriers
CervixThe image shows the transcriptomic changes along malignancy continuum.log2FC in expression of this searched gene in stem-like cells from each diseased tissue sample relative to stem-like cells in normal samples in each tissue plotted against the malignancy continuum. Samples are colored based on if they are from different disease stage.CC: Cervix cancer
HSIL_HPV: HPV-infected high-grade squamous intraepithelial lesions
N_HPV: HPV-infected normal cervix
Colorectum (GSE201348)The image shows the transcriptomic changes along malignancy continuum.log2FC in expression of this searched gene in stem-like cells from each diseased tissue sample relative to stem-like cells in normal samples in each tissue plotted against the malignancy continuum. Samples are colored based on if they are from different disease stage.
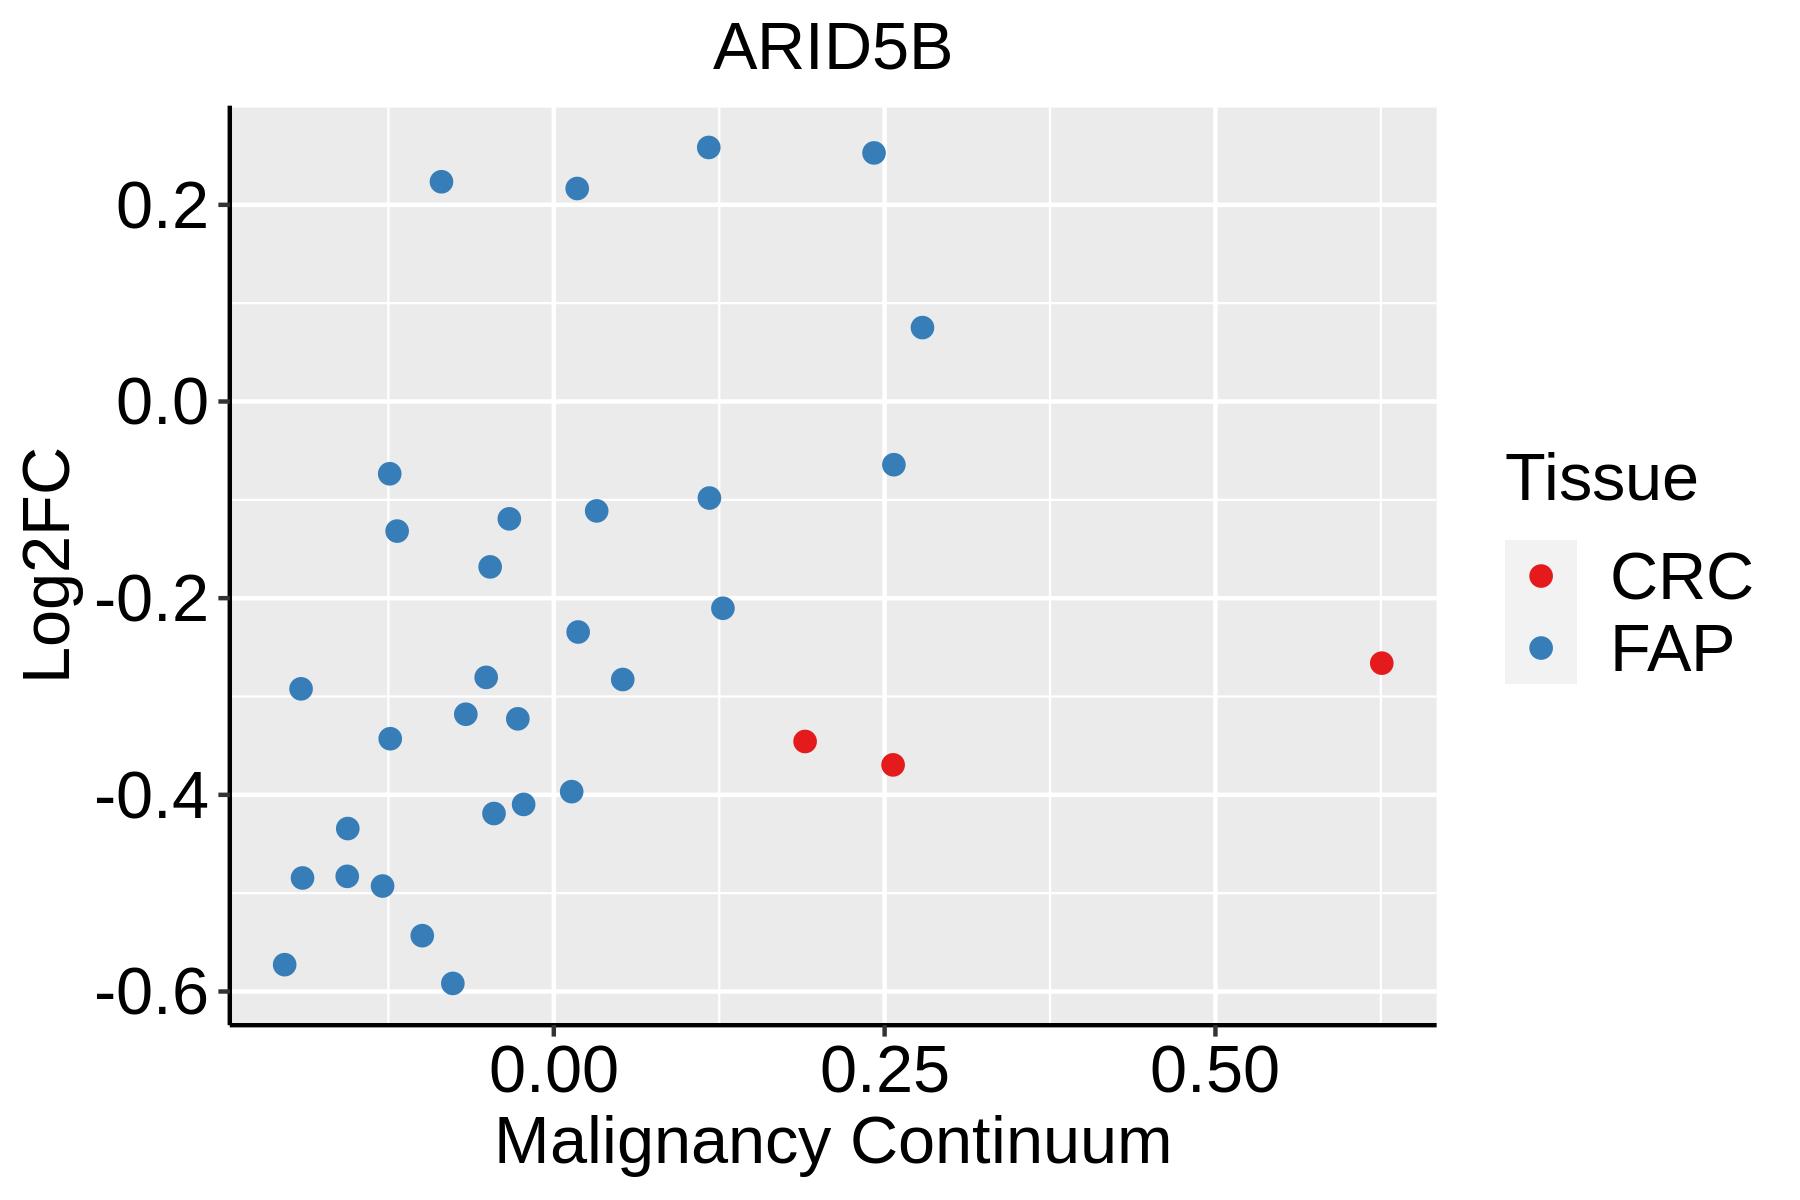
FAP: Familial adenomatous polyposis
CRC: Colorectal cancer
Colorectum (HTA11)The image shows the transcriptomic changes along malignancy continuum.log2FC in expression of this searched gene in stem-like cells from each diseased tissue sample relative to stem-like cells in normal samples in each tissue plotted against the malignancy continuum. Samples are colored based on if they are from different disease stage.AD: Adenomas
SER: Sessile serrated lesions
MSI-H: Microsatellite-high colorectal cancer
MSS: Microsatellite stable colorectal cancer
EsophagusThe image shows the transcriptomic changes along malignancy continuum.log2FC in expression of this searched gene in stem-like cells from each diseased tissue sample relative to stem-like cells in normal samples in each tissue plotted against the malignancy continuum. Samples are colored based on if they are from different disease stage.ESCC: Esophageal squamous cell carcinoma
HGIN: High-grade intraepithelial neoplasias
LGIN: Low-grade intraepithelial neoplasias
LiverThe image shows the transcriptomic changes along malignancy continuum.log2FC in expression of this searched gene in stem-like cells from each diseased tissue sample relative to stem-like cells in normal samples in each tissue plotted against the malignancy continuum. Samples are colored based on if they are from different disease stage.
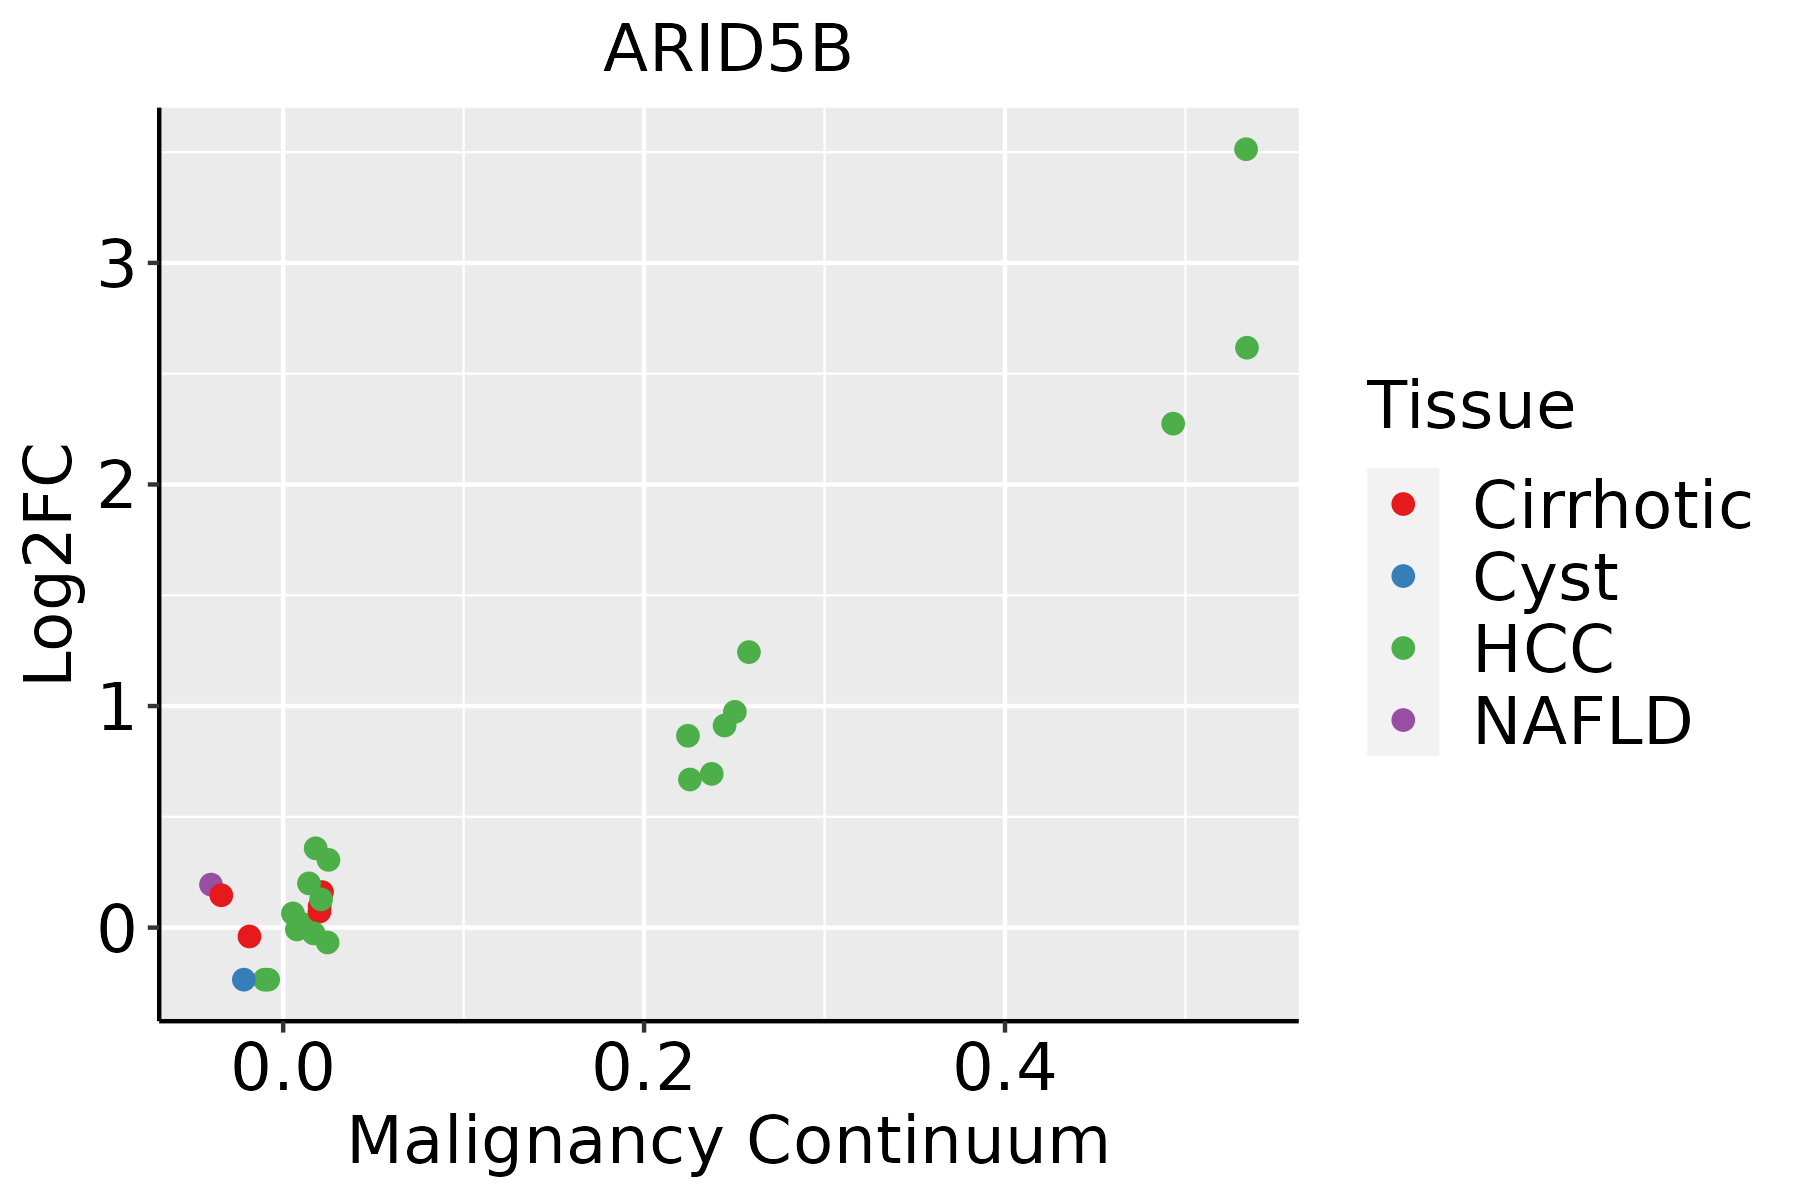
HCC: Hepatocellular carcinoma
NAFLD: Non-alcoholic fatty liver disease
LungThe image shows the transcriptomic changes along malignancy continuum.log2FC in expression of this searched gene in stem-like cells from each diseased tissue sample relative to stem-like cells in normal samples in each tissue plotted against the malignancy continuum. Samples are colored based on if they are from different disease stage.AAH: Atypical adenomatous hyperplasia
AIS: Adenocarcinoma in situ
IAC: Invasive lung adenocarcinoma
MIA: Minimally invasive adenocarcinoma
Oral CavityThe image shows the transcriptomic changes along malignancy continuum.log2FC in expression of this searched gene in stem-like cells from each diseased tissue sample relative to stem-like cells in normal samples in each tissue plotted against the malignancy continuum. Samples are colored based on if they are from different disease stage.
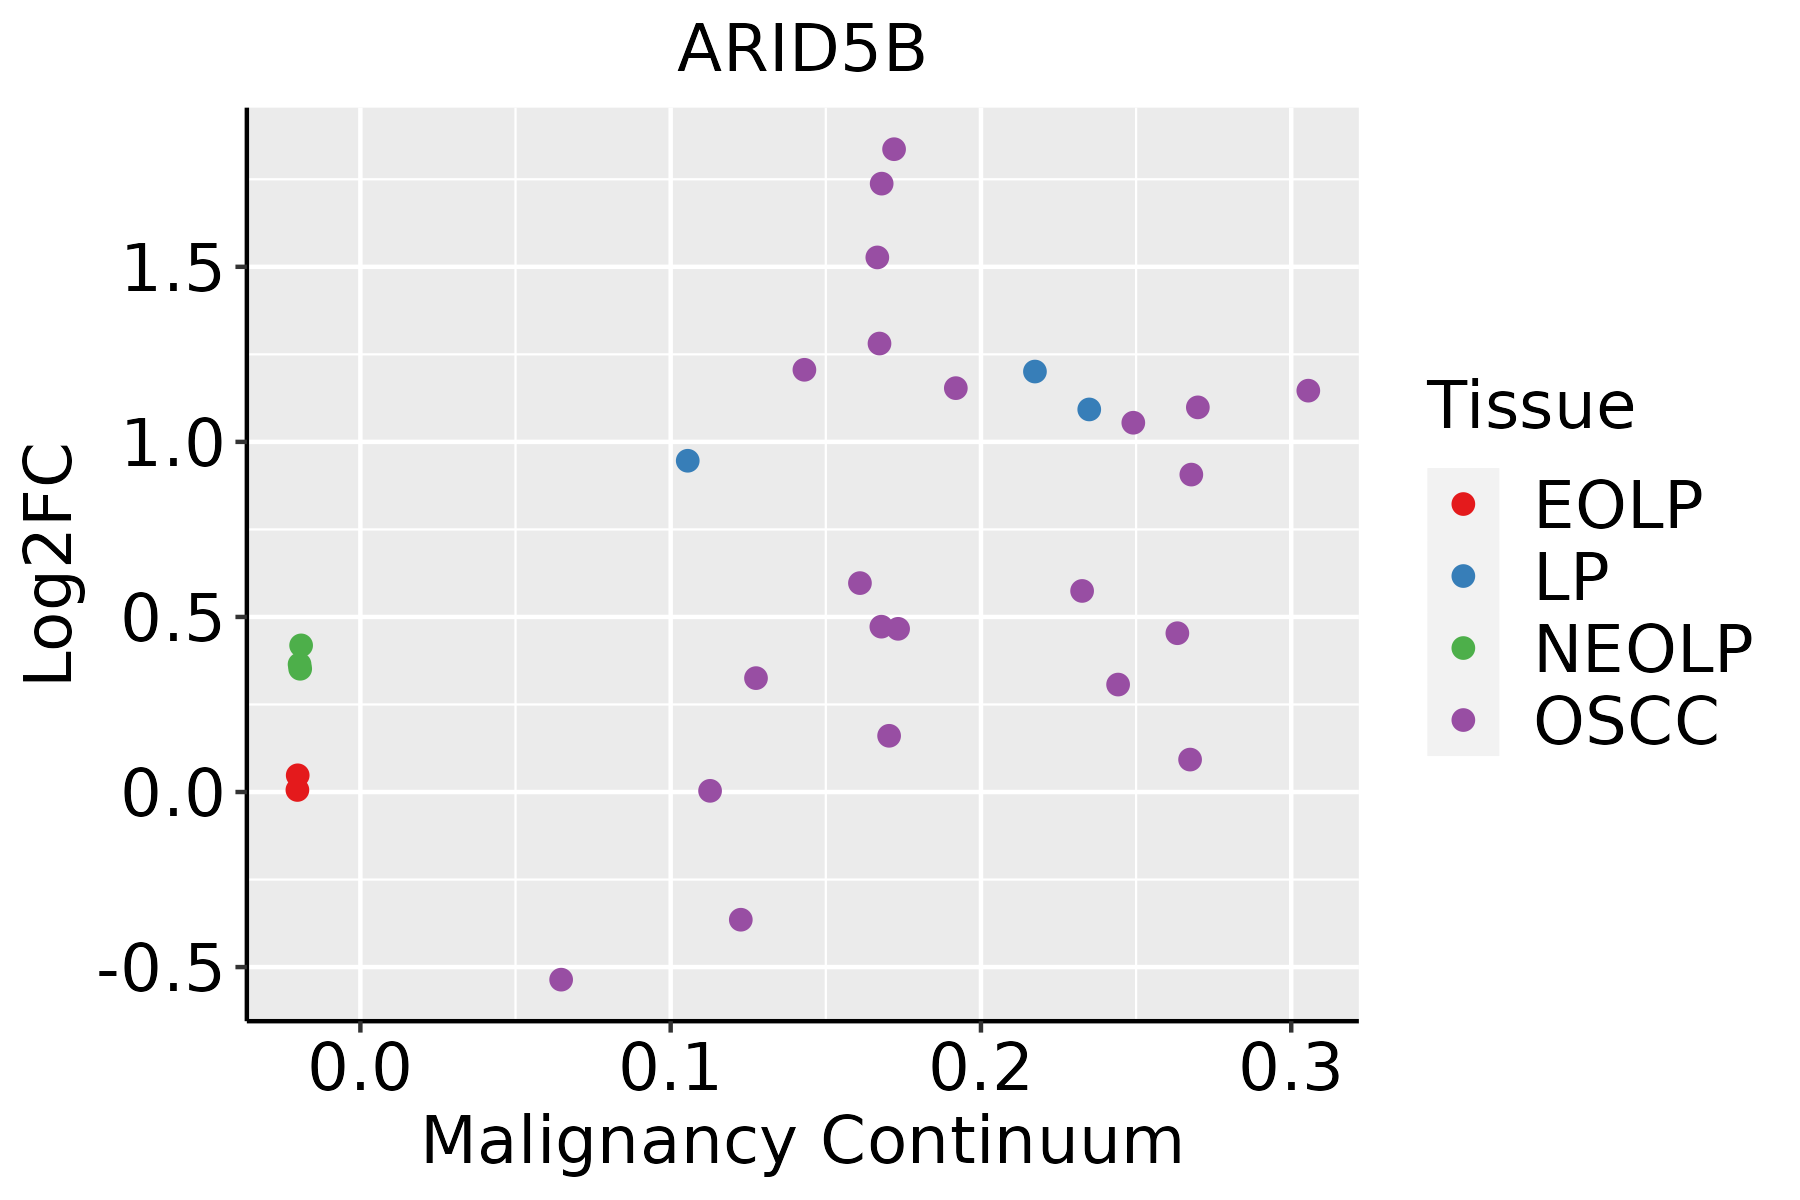
EOLP: Erosive Oral lichen planus
LP: leukoplakia
NEOLP: Non-erosive oral lichen planus
OSCC: Oral squamous cell carcinoma
ProstateThe image shows the transcriptomic changes along malignancy continuum.log2FC in expression of this searched gene in stem-like cells from each diseased tissue sample relative to stem-like cells in normal samples in each tissue plotted against the malignancy continuum. Samples are colored based on if they are from different disease stage.
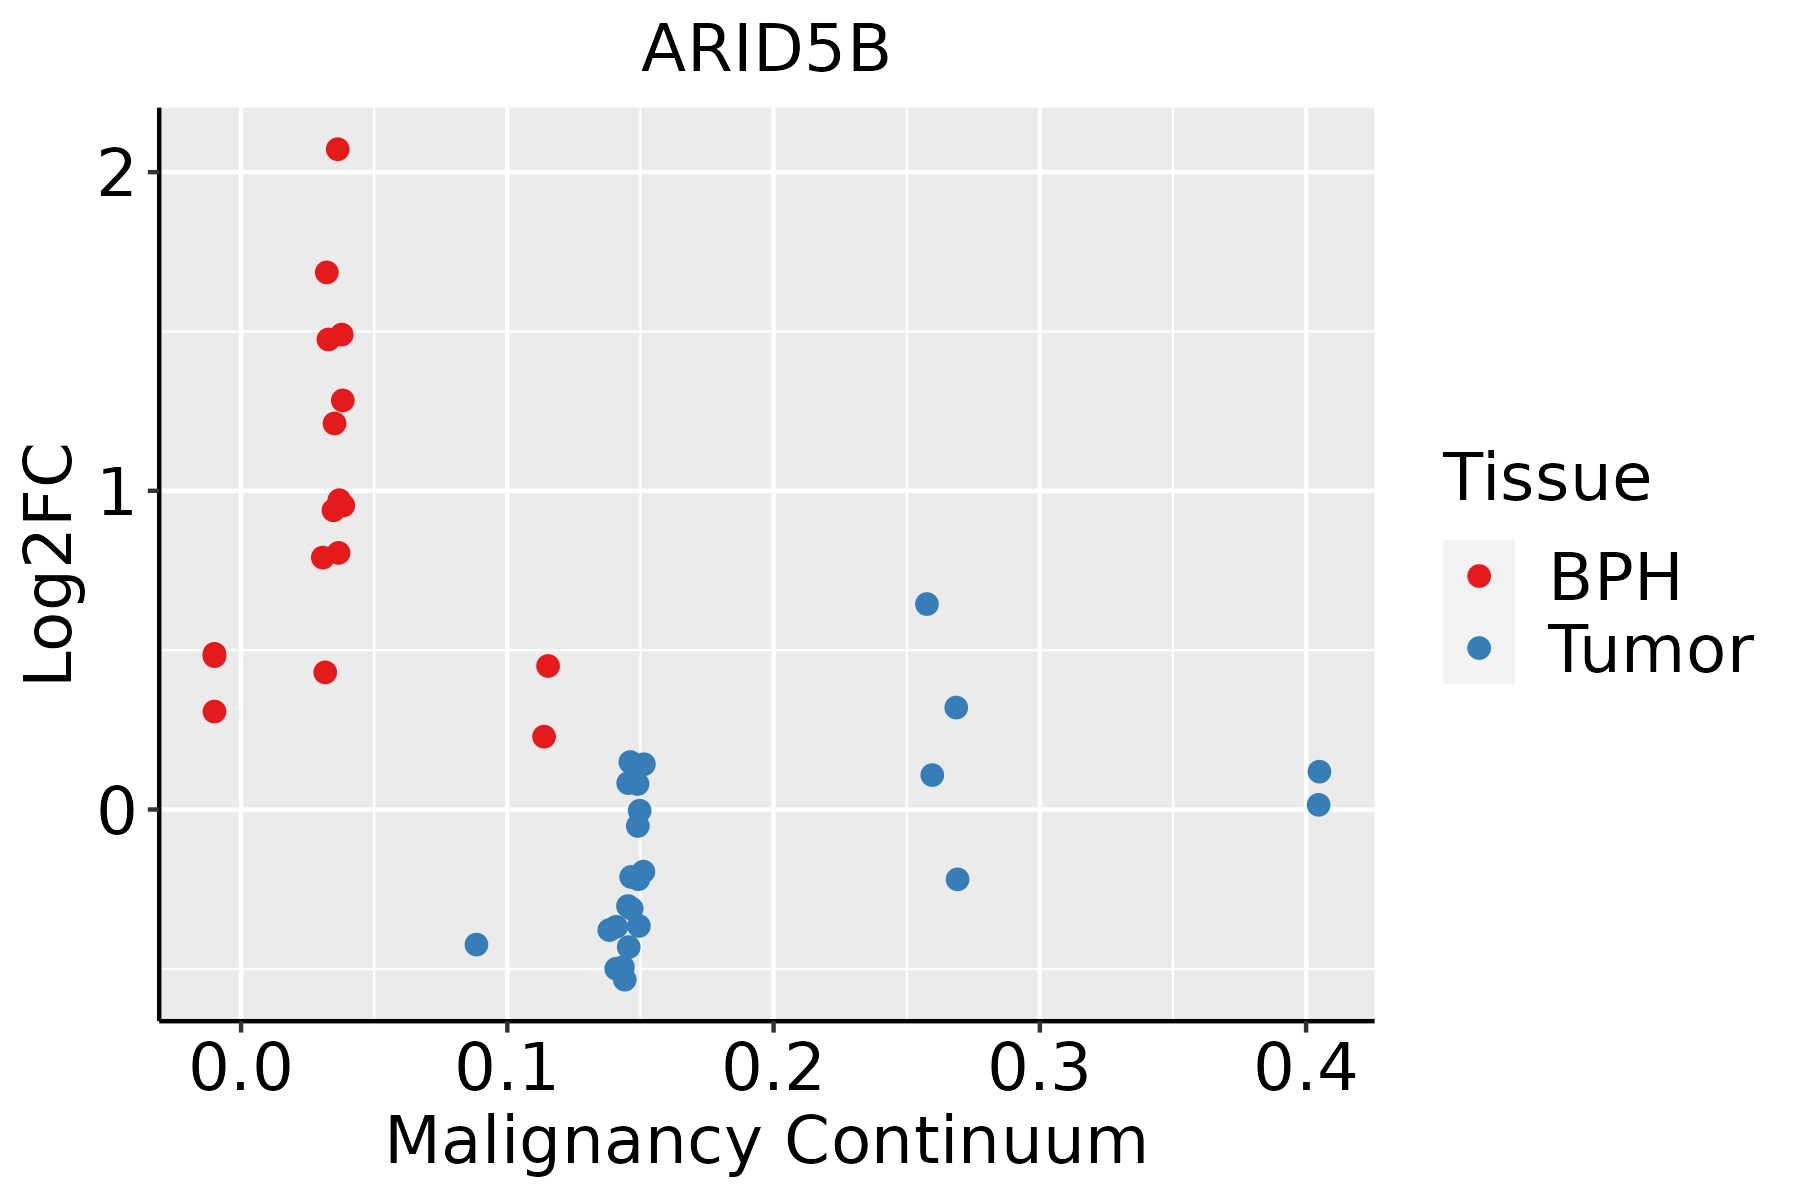
BPH: Benign Prostatic Hyperplasia
SkinThe image shows the transcriptomic changes along malignancy continuum.log2FC in expression of this searched gene in stem-like cells from each diseased tissue sample relative to stem-like cells in normal samples in each tissue plotted against the malignancy continuum. Samples are colored based on if they are from different disease stage.AK: Actinic keratosis
cSCC: Cutaneous squamous cell carcinoma
SCCIS:squamous cell carcinoma in situ
ThyroidThe image shows the transcriptomic changes along malignancy continuum.log2FC in expression of this searched gene in stem-like cells from each diseased tissue sample relative to stem-like cells in normal samples in each tissue plotted against the malignancy continuum. Samples are colored based on if they are from different disease stage.ATC: Anaplastic thyroid cancer
HT: Hashimoto's thyroiditis
PTC: Papillary thyroid cancer
∗log2FC in expression of this searched gene in stem-like cells from each diseased tissue sample relative to stem-like cells in normal samples in each tissue plotted against the malignancy continuum. Samples are colored based on if they are from different disease stage.

Top

Malignant transformation related pathway analysis

check buttonFind out the enriched GO biological processes and KEGG pathways involved in transition from healthy to precancer to cancer
check button Figure of enriched GO biological processes.
TissueDisease StageEnriched GO biological Processes
ColorectumADGO analysis - Figure of enriched GO biological processes: Top 15 enriched GO BP terms are showed in the bar plot of each disease state in each tissue. Each row represents a significant GO biological process which is colored according to the -log10(p.adjust).
ColorectumSERGO analysis - Figure of enriched GO biological processes: Top 15 enriched GO BP terms are showed in the bar plot of each disease state in each tissue. Each row represents a significant GO biological process which is colored according to the -log10(p.adjust).
ColorectumMSSGO analysis - Figure of enriched GO biological processes: Top 15 enriched GO BP terms are showed in the bar plot of each disease state in each tissue. Each row represents a significant GO biological process which is colored according to the -log10(p.adjust).
ColorectumMSI-HGO analysis - Figure of enriched GO biological processes: Top 15 enriched GO BP terms are showed in the bar plot of each disease state in each tissue. Each row represents a significant GO biological process which is colored according to the -log10(p.adjust).
ColorectumFAPGO analysis - Figure of enriched GO biological processes: Top 15 enriched GO BP terms are showed in the bar plot of each disease state in each tissue. Each row represents a significant GO biological process which is colored according to the -log10(p.adjust).
∗Top 15 enriched GO BP terms are showed in the bar plot of each disease state in each tissue. Each row represents a significant GO biological process which is colored according to the -log10(p.adjust).
Page: 1 2 3 4 5 6 7 8 9 

check button Enriched GO biological processes.
GO IDTissueDisease StageDescriptionGene RatioBg Ratiopvaluep.adjustCount
GO:001076115ThyroidPTCfibroblast migration28/596847/187238.25e-057.00e-0428
GO:0061458112ThyroidPTCreproductive system development173/5968427/187238.70e-057.23e-04173
GO:0048608111ThyroidPTCreproductive structure development170/5968424/187231.86e-041.41e-03170
GO:005109115ThyroidPTCpositive regulation of DNA-binding transcription factor activity107/5968260/187239.44e-045.70e-03107
GO:00603244ThyroidPTCface development24/596844/187231.52e-038.49e-0324
GO:00603255ThyroidPTCface morphogenesis17/596828/187231.55e-038.63e-0317
GO:00101713ThyroidPTCbody morphogenesis23/596843/187232.66e-031.35e-0223
GO:00603234ThyroidPTChead morphogenesis18/596832/187233.72e-031.79e-0218
GO:004654612ThyroidPTCdevelopment of primary male sexual characteristics60/5968142/187235.79e-032.61e-0260
GO:00352648ThyroidPTCmulticellular organism growth56/5968132/187236.79e-032.92e-0256
GO:199082310ThyroidPTCresponse to leukemia inhibitory factor42/596895/187237.69e-033.27e-0242
GO:000858412ThyroidPTCmale gonad development59/5968141/187237.88e-033.33e-0259
GO:199083010ThyroidPTCcellular response to leukemia inhibitory factor41/596894/187231.10e-024.38e-0241
GO:000166731ThyroidATCameboidal-type cell migration228/6293475/187233.72e-111.22e-09228
GO:004873233ThyroidATCgland development210/6293436/187231.50e-104.59e-09210
GO:000188927ThyroidATCliver development85/6293147/187231.37e-093.43e-0885
GO:006100827ThyroidATChepaticobiliary system development86/6293150/187231.96e-094.78e-0886
GO:000182222ThyroidATCkidney development146/6293293/187235.81e-091.28e-07146
GO:000165522ThyroidATCurogenital system development164/6293338/187237.92e-091.70e-07164
GO:007200122ThyroidATCrenal system development149/6293302/187239.48e-091.99e-07149
Page: 1 2 3 4 5 6 7 8 9 10 11 12 13 14 15 16 17 18 19 20 21 

check button Enriched KEGG pathways.
Pathway IDTissueDisease StageDescriptionGene RatioBg Ratiopvaluep.adjustqvalueCount
Page: 1 

Top

Cell-cell communication analysis

check buttonIdentification of potential cell-cell interactions between two cell types and their ligand-receptor pairs for different disease states
LigandReceptorLRpairPathwayTissueDisease Stage
Page: 1 

Top

Single-cell gene regulatory network inference analysis

check buttonFind out the significant the regulons (TFs) and the target genes of each regulon across cell types for different disease states
TFCell TypeTissueDisease StageTarget GeneRSSRegulon Activity
ARID5BBMEMColorectumMSI-HANKRD44,SSPN,BCL2, etc.2.02e-01The dot plots of a searched regulon are shown for all cell subpopulations in each disease state of each tissue based on the regulon specific score inferred using pySCENIC and by calculating the average expression.
ARID5BGLANEndometriumEECTHBS1,GREM1,HBEGF, etc.2.82e-01The dot plots of a searched regulon are shown for all cell subpopulations in each disease state of each tissue based on the regulon specific score inferred using pySCENIC and by calculating the average expression.
ARID5BTREGLungAAHTRAT1,RHOH,PVT1, etc.5.91e-02The dot plots of a searched regulon are shown for all cell subpopulations in each disease state of each tissue based on the regulon specific score inferred using pySCENIC and by calculating the average expression.
ARID5BCD4TNLungAAHTRAT1,RHOH,PVT1, etc.6.15e-03The dot plots of a searched regulon are shown for all cell subpopulations in each disease state of each tissue based on the regulon specific score inferred using pySCENIC and by calculating the average expression.
ARID5BMALTBOral cavityLPSMAP2,ELF1,RHOH, etc.5.14e-02The dot plots of a searched regulon are shown for all cell subpopulations in each disease state of each tissue based on the regulon specific score inferred using pySCENIC and by calculating the average expression.
ARID5BTREGOral cavityNEOLPSMAP2,ELF1,RHOH, etc.2.12e-01The dot plots of a searched regulon are shown for all cell subpopulations in each disease state of each tissue based on the regulon specific score inferred using pySCENIC and by calculating the average expression.
∗The dot plots of a searched regulon are shown for all cell subpopulations in each disease state of each tissue based on the regulon specific score inferred using pySCENIC and by calculating the average expression.
Page: 1 

Top

Somatic mutation of malignant transformation related genes

check buttonAnnotation of somatic variants for genes involved in malignant transformation
Hugo SymbolVariant ClassVariant ClassificationdbSNP RSHGVScHGVSpHGVSp ShortSWISSPROTBIOTYPESIFTPolyPhenTumor Sample BarcodeTissueHistologySexAgeStageTherapy TypesDrugsOutcome
ARID5BSNVMissense_Mutationc.1591N>Cp.Glu531Glnp.E531QQ14865protein_codingtolerated(0.3)benign(0.195)TCGA-A2-A0EQ-01Breastbreast invasive carcinomaFemale<65I/IIChemotherapyadriamycinSD
ARID5BSNVMissense_Mutationc.376N>Ap.Ala126Thrp.A126TQ14865protein_codingtolerated(0.08)benign(0.003)TCGA-A8-A09Z-01Breastbreast invasive carcinomaFemale>=65I/IIUnknownUnknownSD
ARID5BSNVMissense_Mutationc.2843N>Ap.Arg948Glnp.R948QQ14865protein_codingtolerated(0.42)possibly_damaging(0.47)TCGA-BH-A0HF-01Breastbreast invasive carcinomaFemale>=65I/IIHormone TherapyarimidexSD
ARID5BSNVMissense_Mutationc.3464N>Ap.Gly1155Glup.G1155EQ14865protein_codingdeleterious(0.03)benign(0.204)TCGA-BH-A0HF-01Breastbreast invasive carcinomaFemale>=65I/IIHormone TherapyarimidexSD
ARID5BSNVMissense_Mutationnovelc.3344N>Ap.Leu1115Hisp.L1115HQ14865protein_codingdeleterious(0)probably_damaging(0.998)TCGA-BH-A1FN-01Breastbreast invasive carcinomaFemale<65I/IIUnknownUnknownPD
ARID5BSNVMissense_Mutationc.2175N>Cp.Arg725Serp.R725SQ14865protein_codingtolerated(0.42)benign(0.078)TCGA-D8-A1JF-01Breastbreast invasive carcinomaFemale>=65III/IVUnknownUnknownSD
ARID5BSNVMissense_Mutationc.652N>Tp.Arg218Trpp.R218WQ14865protein_codingdeleterious(0.01)benign(0.445)TCGA-D8-A1Y0-01Breastbreast invasive carcinomaFemale>=65III/IVChemotherapycyclophosphamide+methotrexatum+fluorouracillumSD
ARID5BSNVMissense_Mutationc.785G>Ap.Arg262Lysp.R262KQ14865protein_codingdeleterious(0.02)benign(0.204)TCGA-GM-A2D9-01Breastbreast invasive carcinomaFemale>=65I/IIHormone TherapyarimidexSD
ARID5BinsertionFrame_Shift_Insnovelc.1958_1959insCTTTACTTTTTTCTGCCTAp.Asp655ThrfsTer7p.D655Tfs*7Q14865protein_codingTCGA-BH-A0EE-01Breastbreast invasive carcinomaFemale>=65I/IIChemotherapydocetaxelSD
ARID5BSNVMissense_Mutationnovelc.1519C>Tp.Pro507Serp.P507SQ14865protein_codingtolerated(0.68)benign(0)TCGA-2W-A8YY-01Cervixcervical & endocervical cancerFemale<65I/IIChemotherapycisplatinCR
Page: 1 2 3 4 5 6 7 8 9 10 11 12 13 14 15 16 

Top

Related drugs of malignant transformation related genes

check buttonIdentification of chemicals and drugs interact with genes involved in malignant transfromation
(DGIdb 4.0)
Entrez IDSymbolCategoryInteraction TypesDrug Claim NameDrug NamePMIDs
84159ARID5BCLINICALLY ACTIONABLEhaloperidolHALOPERIDOL27023437
84159ARID5BCLINICALLY ACTIONABLEmethotrexateMETHOTREXATE24712521
Page: 1