
|
|||||
|
 | |
| |
| |
| |
| |
| |
|
Gene: AMH |
Gene summary for AMH |
| Gene information | Species | Human | Gene symbol | AMH | Gene ID | 268 |
| Gene name | anti-Mullerian hormone | |
| Gene Alias | MIF | |
| Cytomap | 19p13.3 | |
| Gene Type | protein-coding | GO ID | GO:0000003 | UniProtAcc | P03971 |
Top |
Malignant transformation analysis |
| Identification of the aberrant gene expression in precancerous and cancerous lesions by comparing the gene expression of stem-like cells in diseased tissues with normal stem cells |
| Entrez ID | Symbol | Replicates | Species | Organ | Tissue | Adj P-value | Log2FC | Malignancy |
| 268 | AMH | C38 | Human | Oral cavity | OSCC | 5.51e-08 | 5.68e-01 | 0.172 |
| 268 | AMH | LN38 | Human | Oral cavity | OSCC | 4.47e-05 | 6.16e-01 | 0.168 |
| Page: 1 |
| Tissue | Expression Dynamics | Abbreviation |
| Oral Cavity | 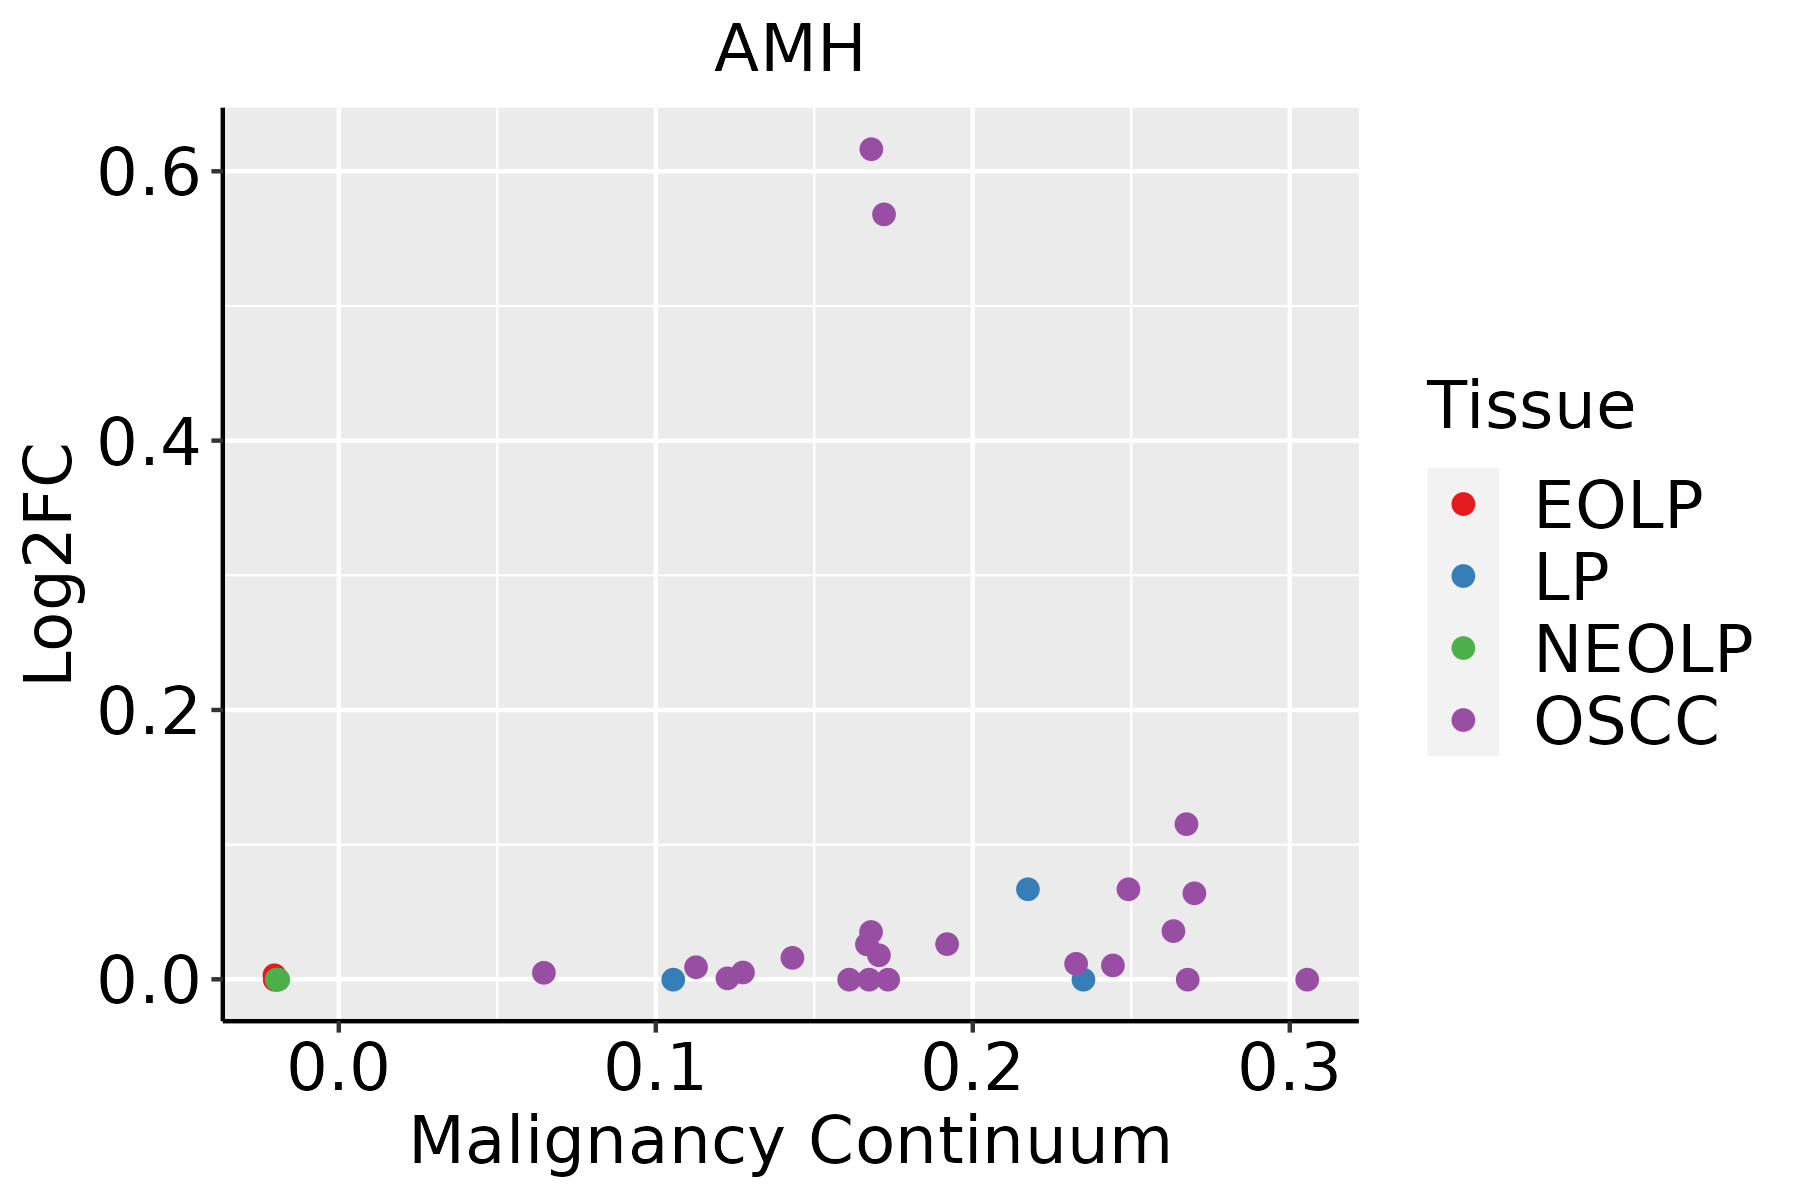 | EOLP: Erosive Oral lichen planus |
| LP: leukoplakia | ||
| NEOLP: Non-erosive oral lichen planus | ||
| OSCC: Oral squamous cell carcinoma |
| ∗log2FC in expression of this searched gene in stem-like cells from each diseased tissue sample relative to stem-like cells in normal samples in each tissue plotted against the malignancy continuum. Samples are colored based on if they are from different disease stage. |
Top |
Malignant transformation related pathway analysis |
| Find out the enriched GO biological processes and KEGG pathways involved in transition from healthy to precancer to cancer |
| Tissue | Disease Stage | Enriched GO biological Processes |
| Colorectum | AD |  |
| Colorectum | SER |  |
| Colorectum | MSS |  |
| Colorectum | MSI-H |  |
| Colorectum | FAP |  |
| ∗Top 15 enriched GO BP terms are showed in the bar plot of each disease state in each tissue. Each row represents a significant GO biological process which is colored according to the -log10(p.adjust). |
| Page: 1 2 3 4 5 6 7 8 9 |
| GO ID | Tissue | Disease Stage | Description | Gene Ratio | Bg Ratio | pvalue | p.adjust | Count |
| GO:000630212 | Thyroid | ATC | double-strand break repair | 110/6293 | 251/18723 | 4.48e-04 | 2.65e-03 | 110 |
| GO:005160712 | Thyroid | ATC | defense response to virus | 115/6293 | 265/18723 | 5.31e-04 | 3.09e-03 | 115 |
| GO:014054612 | Thyroid | ATC | defense response to symbiont | 115/6293 | 265/18723 | 5.31e-04 | 3.09e-03 | 115 |
| GO:006033811 | Thyroid | ATC | regulation of type I interferon-mediated signaling pathway | 22/6293 | 36/18723 | 6.58e-04 | 3.73e-03 | 22 |
| GO:004508813 | Thyroid | ATC | regulation of innate immune response | 94/6293 | 218/18723 | 2.05e-03 | 9.71e-03 | 94 |
| GO:000283213 | Thyroid | ATC | negative regulation of response to biotic stimulus | 49/6293 | 108/18723 | 7.19e-03 | 2.84e-02 | 49 |
| GO:009030511 | Thyroid | ATC | nucleic acid phosphodiester bond hydrolysis | 107/6293 | 261/18723 | 7.21e-03 | 2.84e-02 | 107 |
| GO:000920013 | Thyroid | ATC | deoxyribonucleoside triphosphate metabolic process | 11/6293 | 17/18723 | 8.56e-03 | 3.26e-02 | 11 |
| GO:19011363 | Thyroid | ATC | carbohydrate derivative catabolic process | 73/6293 | 172/18723 | 9.43e-03 | 3.47e-02 | 73 |
| GO:00725232 | Thyroid | ATC | purine-containing compound catabolic process | 26/6293 | 52/18723 | 1.05e-02 | 3.82e-02 | 26 |
| GO:00603394 | Thyroid | ATC | negative regulation of type I interferon-mediated signaling pathway | 12/6293 | 20/18723 | 1.39e-02 | 4.81e-02 | 12 |
| Page: 1 2 3 4 5 6 7 8 9 10 11 12 13 14 15 16 17 18 19 |
| Pathway ID | Tissue | Disease Stage | Description | Gene Ratio | Bg Ratio | pvalue | p.adjust | qvalue | Count |
| hsa0439016 | Oral cavity | OSCC | Hippo signaling pathway | 86/3704 | 157/8465 | 3.30e-03 | 8.24e-03 | 4.20e-03 | 86 |
| hsa043506 | Oral cavity | OSCC | TGF-beta signaling pathway | 60/3704 | 108/8465 | 8.66e-03 | 1.97e-02 | 1.00e-02 | 60 |
| hsa0439017 | Oral cavity | OSCC | Hippo signaling pathway | 86/3704 | 157/8465 | 3.30e-03 | 8.24e-03 | 4.20e-03 | 86 |
| hsa0435013 | Oral cavity | OSCC | TGF-beta signaling pathway | 60/3704 | 108/8465 | 8.66e-03 | 1.97e-02 | 1.00e-02 | 60 |
| Page: 1 |
Top |
Cell-cell communication analysis |
| Identification of potential cell-cell interactions between two cell types and their ligand-receptor pairs for different disease states |
| Ligand | Receptor | LRpair | Pathway | Tissue | Disease Stage |
| Page: 1 |
Top |
Single-cell gene regulatory network inference analysis |
| Find out the significant the regulons (TFs) and the target genes of each regulon across cell types for different disease states |
| TF | Cell Type | Tissue | Disease Stage | Target Gene | RSS | Regulon Activity |
| ∗The dot plots of a searched regulon are shown for all cell subpopulations in each disease state of each tissue based on the regulon specific score inferred using pySCENIC and by calculating the average expression. |
| Page: 1 |
Top |
Somatic mutation of malignant transformation related genes |
| Annotation of somatic variants for genes involved in malignant transformation |
| Hugo Symbol | Variant Class | Variant Classification | dbSNP RS | HGVSc | HGVSp | HGVSp Short | SWISSPROT | BIOTYPE | SIFT | PolyPhen | Tumor Sample Barcode | Tissue | Histology | Sex | Age | Stage | Therapy Types | Drugs | Outcome |
| AMH | SNV | Missense_Mutation | novel | c.1441G>A | p.Glu481Lys | p.E481K | P03971 | protein_coding | deleterious(0.05) | probably_damaging(0.969) | TCGA-E9-A2JS-01 | Breast | breast invasive carcinoma | Female | >=65 | I/II | Chemotherapy | cyclophosphamide | PD |
| AMH | SNV | Missense_Mutation | c.509N>A | p.Pro170His | p.P170H | P03971 | protein_coding | tolerated(0.06) | benign(0.037) | TCGA-AZ-6598-01 | Colorectum | colon adenocarcinoma | Female | >=65 | I/II | Unknown | Unknown | SD | |
| AMH | SNV | Missense_Mutation | rs371130597 | c.346N>T | p.Arg116Trp | p.R116W | P03971 | protein_coding | deleterious(0) | benign(0.35) | TCGA-CM-4746-01 | Colorectum | colon adenocarcinoma | Male | <65 | I/II | Unknown | Unknown | SD |
| AMH | insertion | Frame_Shift_Ins | rs769922506 | c.208dupC | p.Leu70ProfsTer11 | p.L70Pfs*11 | P03971 | protein_coding | TCGA-AZ-4615-01 | Colorectum | colon adenocarcinoma | Male | >=65 | III/IV | Chemotherapy | xeloda | PD | ||
| AMH | SNV | Missense_Mutation | novel | c.41C>A | p.Ser14Tyr | p.S14Y | P03971 | protein_coding | tolerated_low_confidence(0.59) | benign(0.086) | TCGA-EO-A22U-01 | Endometrium | uterine corpus endometrioid carcinoma | Female | >=65 | I/II | Unknown | Unknown | SD |
| AMH | deletion | Frame_Shift_Del | c.203delN | p.Leu70CysfsTer7 | p.L70Cfs*7 | P03971 | protein_coding | TCGA-AX-A2HG-01 | Endometrium | uterine corpus endometrioid carcinoma | Female | <65 | I/II | Unknown | Unknown | SD | |||
| AMH | insertion | Frame_Shift_Ins | novel | c.470_471insC | p.Glu160ArgfsTer14 | p.E160Rfs*14 | P03971 | protein_coding | TCGA-B5-A1MW-01 | Endometrium | uterine corpus endometrioid carcinoma | Female | <65 | I/II | Unknown | Unknown | PD | ||
| AMH | insertion | Frame_Shift_Ins | novel | c.283dupC | p.Arg95ProfsTer13 | p.R95Pfs*13 | P03971 | protein_coding | TCGA-DF-A2KY-01 | Endometrium | uterine corpus endometrioid carcinoma | Female | <65 | III/IV | Chemotherapy | carboplatin | SD | ||
| AMH | SNV | Missense_Mutation | c.356N>T | p.Gly119Val | p.G119V | P03971 | protein_coding | tolerated(0.05) | benign(0.297) | TCGA-ED-A7XP-01 | Liver | liver hepatocellular carcinoma | Female | <65 | I/II | Unknown | Unknown | PD | |
| AMH | SNV | Missense_Mutation | novel | c.1438N>T | p.Pro480Ser | p.P480S | P03971 | protein_coding | deleterious(0) | probably_damaging(0.999) | TCGA-55-7576-01 | Lung | lung adenocarcinoma | Male | <65 | I/II | Chemotherapy | alimta | CR |
| Page: 1 2 |
Top |
Related drugs of malignant transformation related genes |
| Identification of chemicals and drugs interact with genes involved in malignant transfromation |
| (DGIdb 4.0) |
| Entrez ID | Symbol | Category | Interaction Types | Drug Claim Name | Drug Name | PMIDs |
| 268 | AMH | GROWTH FACTOR, HORMONE ACTIVITY, DRUGGABLE GENOME, TRANSCRIPTION FACTOR | DES | DIETHYLSTILBESTROL | 9751506 | |
| 268 | AMH | GROWTH FACTOR, HORMONE ACTIVITY, DRUGGABLE GENOME, TRANSCRIPTION FACTOR | GONADOTROPINS | 347363,8810722 | ||
| 268 | AMH | GROWTH FACTOR, HORMONE ACTIVITY, DRUGGABLE GENOME, TRANSCRIPTION FACTOR | HUMAN CHORIONIC GONADOTROPIN | 10443662 | ||
| 268 | AMH | GROWTH FACTOR, HORMONE ACTIVITY, DRUGGABLE GENOME, TRANSCRIPTION FACTOR | DIETHYLSTILBESTROL | DIETHYLSTILBESTROL | 2286533 | |
| 268 | AMH | GROWTH FACTOR, HORMONE ACTIVITY, DRUGGABLE GENOME, TRANSCRIPTION FACTOR | TESTOSTERONE | TESTOSTERONE | 11248089,11545286,1292985,14584782,11315948,7962305,7818099 | |
| 268 | AMH | GROWTH FACTOR, HORMONE ACTIVITY, DRUGGABLE GENOME, TRANSCRIPTION FACTOR | RETINOIC ACID | 8326606,7815634 | ||
| 268 | AMH | GROWTH FACTOR, HORMONE ACTIVITY, DRUGGABLE GENOME, TRANSCRIPTION FACTOR | HORMONES | 12428210 | ||
| 268 | AMH | GROWTH FACTOR, HORMONE ACTIVITY, DRUGGABLE GENOME, TRANSCRIPTION FACTOR | ETHINYL ESTRADIOL | 4049280 |
| Page: 1 |

Copyright 2023-Present -The University of Texas Health Science Center at Houston |