
|
|||||
|
 | |
| |
| |
| |
| |
| |
|
Gene: ACD |
Gene summary for ACD |
| Gene information | Species | Human | Gene symbol | ACD | Gene ID | 65057 |
| Gene name | ACD shelterin complex subunit and telomerase recruitment factor | |
| Gene Alias | PIP1 | |
| Cytomap | 16q22.1 | |
| Gene Type | protein-coding | GO ID | GO:0000723 | UniProtAcc | Q96AP0 |
Top |
Malignant transformation analysis |
| Identification of the aberrant gene expression in precancerous and cancerous lesions by comparing the gene expression of stem-like cells in diseased tissues with normal stem cells |
| Entrez ID | Symbol | Replicates | Species | Organ | Tissue | Adj P-value | Log2FC | Malignancy |
| 65057 | ACD | LZE4T | Human | Esophagus | ESCC | 4.48e-08 | 1.68e-01 | 0.0811 |
| 65057 | ACD | LZE7T | Human | Esophagus | ESCC | 8.51e-08 | 6.98e-01 | 0.0667 |
| 65057 | ACD | LZE8T | Human | Esophagus | ESCC | 8.61e-08 | 2.01e-01 | 0.067 |
| 65057 | ACD | LZE20T | Human | Esophagus | ESCC | 2.95e-03 | 8.92e-02 | 0.0662 |
| 65057 | ACD | LZE22T | Human | Esophagus | ESCC | 1.69e-03 | 4.51e-01 | 0.068 |
| 65057 | ACD | LZE24T | Human | Esophagus | ESCC | 2.87e-22 | 4.15e-01 | 0.0596 |
| 65057 | ACD | LZE21T | Human | Esophagus | ESCC | 1.76e-04 | 3.23e-01 | 0.0655 |
| 65057 | ACD | LZE6T | Human | Esophagus | ESCC | 1.33e-02 | 2.02e-01 | 0.0845 |
| 65057 | ACD | P1T-E | Human | Esophagus | ESCC | 7.31e-13 | 4.61e-01 | 0.0875 |
| 65057 | ACD | P2T-E | Human | Esophagus | ESCC | 1.06e-20 | 3.55e-01 | 0.1177 |
| 65057 | ACD | P4T-E | Human | Esophagus | ESCC | 5.28e-25 | 5.89e-01 | 0.1323 |
| 65057 | ACD | P5T-E | Human | Esophagus | ESCC | 6.63e-19 | 4.29e-01 | 0.1327 |
| 65057 | ACD | P8T-E | Human | Esophagus | ESCC | 8.85e-34 | 6.47e-01 | 0.0889 |
| 65057 | ACD | P9T-E | Human | Esophagus | ESCC | 2.92e-12 | 2.14e-01 | 0.1131 |
| 65057 | ACD | P10T-E | Human | Esophagus | ESCC | 3.78e-17 | 2.84e-01 | 0.116 |
| 65057 | ACD | P11T-E | Human | Esophagus | ESCC | 5.43e-12 | 4.38e-01 | 0.1426 |
| 65057 | ACD | P12T-E | Human | Esophagus | ESCC | 3.04e-18 | 2.56e-01 | 0.1122 |
| 65057 | ACD | P15T-E | Human | Esophagus | ESCC | 1.18e-16 | 3.27e-01 | 0.1149 |
| 65057 | ACD | P16T-E | Human | Esophagus | ESCC | 9.04e-21 | 3.48e-01 | 0.1153 |
| 65057 | ACD | P17T-E | Human | Esophagus | ESCC | 1.04e-14 | 5.93e-01 | 0.1278 |
| Page: 1 2 3 4 5 |
| Tissue | Expression Dynamics | Abbreviation |
| Esophagus | 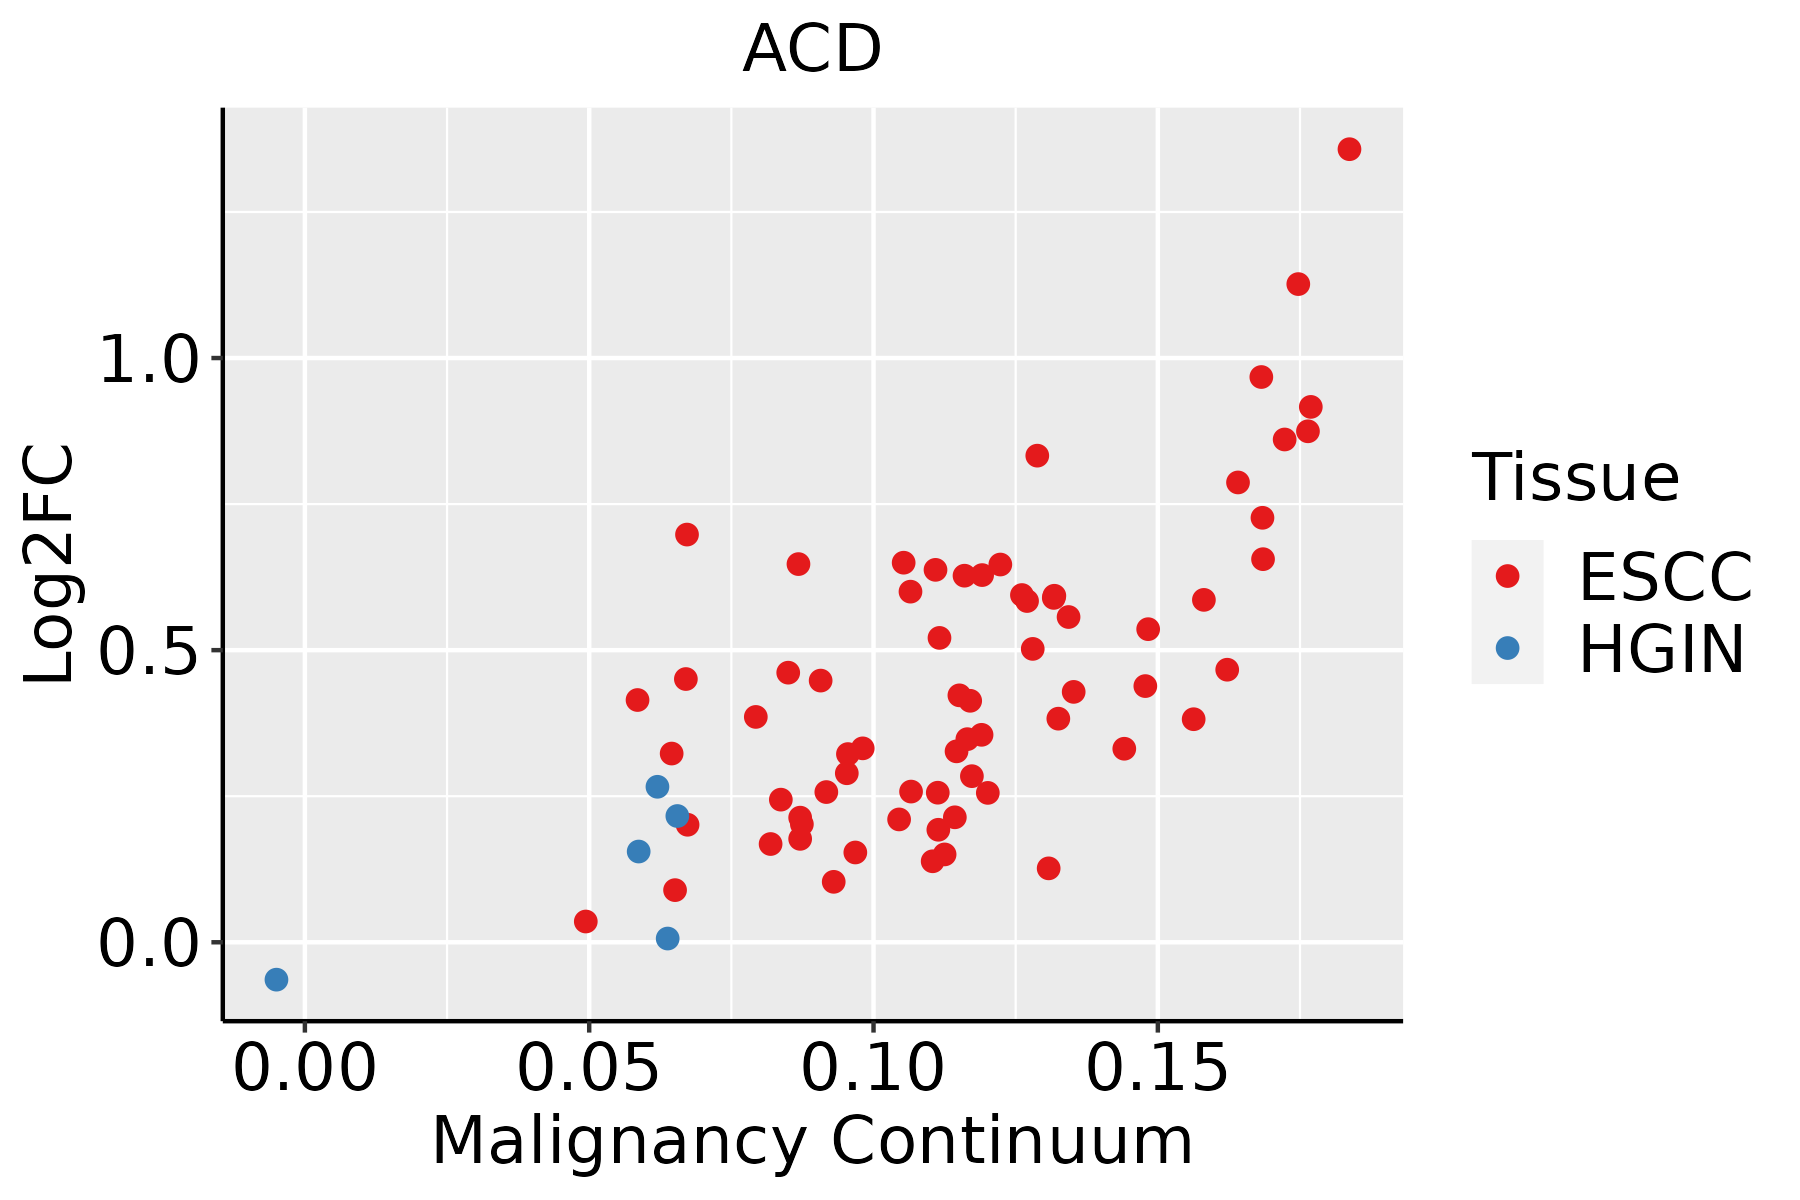 | ESCC: Esophageal squamous cell carcinoma |
| HGIN: High-grade intraepithelial neoplasias | ||
| LGIN: Low-grade intraepithelial neoplasias | ||
| Liver | 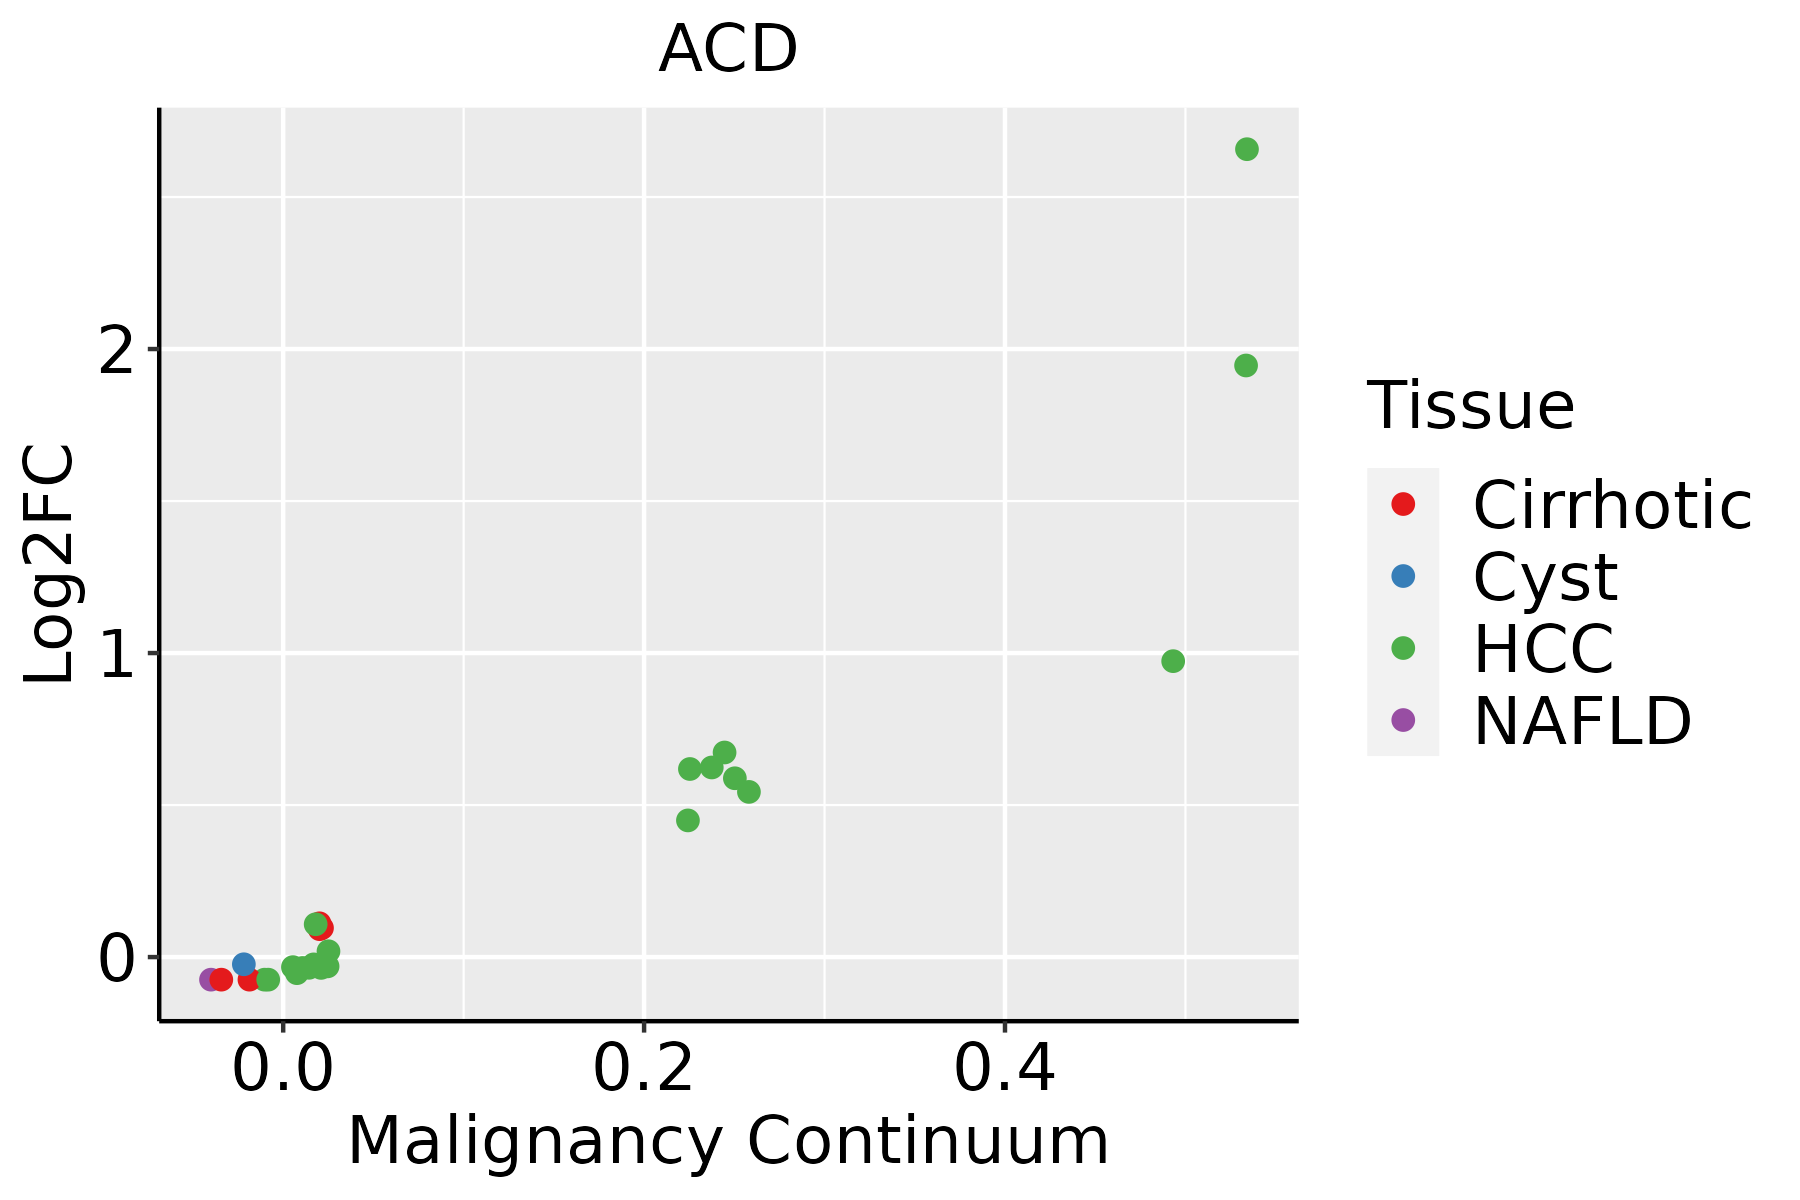 | HCC: Hepatocellular carcinoma |
| NAFLD: Non-alcoholic fatty liver disease | ||
| Oral Cavity | 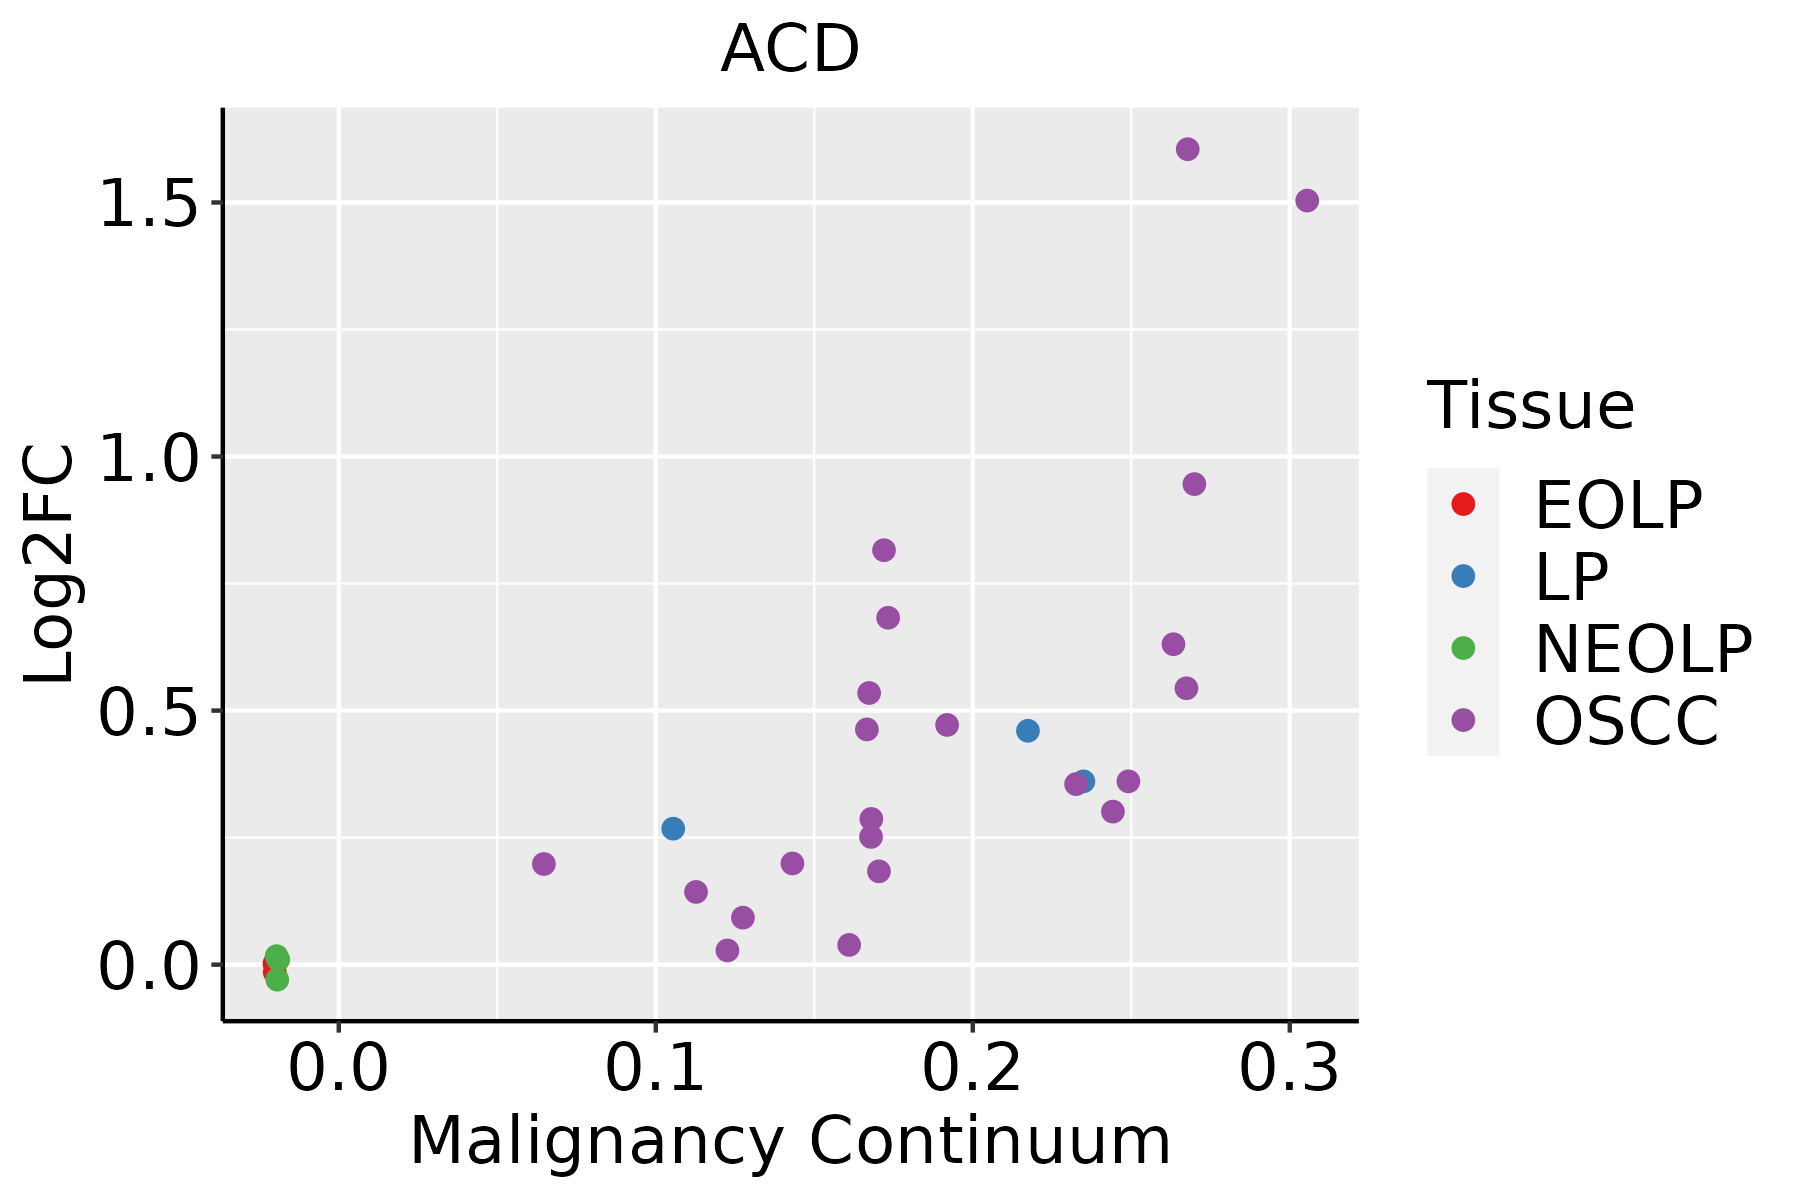 | EOLP: Erosive Oral lichen planus |
| LP: leukoplakia | ||
| NEOLP: Non-erosive oral lichen planus | ||
| OSCC: Oral squamous cell carcinoma |
| ∗log2FC in expression of this searched gene in stem-like cells from each diseased tissue sample relative to stem-like cells in normal samples in each tissue plotted against the malignancy continuum. Samples are colored based on if they are from different disease stage. |
Top |
Malignant transformation related pathway analysis |
| Find out the enriched GO biological processes and KEGG pathways involved in transition from healthy to precancer to cancer |
| Tissue | Disease Stage | Enriched GO biological Processes |
| Colorectum | AD |  |
| Colorectum | SER |  |
| Colorectum | MSS |  |
| Colorectum | MSI-H |  |
| Colorectum | FAP |  |
| ∗Top 15 enriched GO BP terms are showed in the bar plot of each disease state in each tissue. Each row represents a significant GO biological process which is colored according to the -log10(p.adjust). |
| Page: 1 2 3 4 5 6 7 8 9 |
| GO ID | Tissue | Disease Stage | Description | Gene Ratio | Bg Ratio | pvalue | p.adjust | Count |
| GO:200027812 | Liver | HCC | regulation of DNA biosynthetic process | 64/7958 | 106/18723 | 1.53e-04 | 1.23e-03 | 64 |
| GO:190435621 | Liver | HCC | regulation of telomere maintenance via telomere lengthening | 40/7958 | 61/18723 | 2.30e-04 | 1.75e-03 | 40 |
| GO:003220611 | Liver | HCC | positive regulation of telomere maintenance | 35/7958 | 52/18723 | 2.63e-04 | 1.94e-03 | 35 |
| GO:007019811 | Liver | HCC | protein localization to chromosome, telomeric region | 22/7958 | 29/18723 | 2.73e-04 | 1.98e-03 | 22 |
| GO:00353841 | Liver | HCC | thioester biosynthetic process | 31/7958 | 45/18723 | 3.11e-04 | 2.21e-03 | 31 |
| GO:00716161 | Liver | HCC | acyl-CoA biosynthetic process | 31/7958 | 45/18723 | 3.11e-04 | 2.21e-03 | 31 |
| GO:00718975 | Liver | HCC | DNA biosynthetic process | 99/7958 | 180/18723 | 4.66e-04 | 3.08e-03 | 99 |
| GO:190435812 | Liver | HCC | positive regulation of telomere maintenance via telomere lengthening | 26/7958 | 37/18723 | 5.88e-04 | 3.74e-03 | 26 |
| GO:00345021 | Liver | HCC | protein localization to chromosome | 55/7958 | 92/18723 | 6.12e-04 | 3.82e-03 | 55 |
| GO:003221211 | Liver | HCC | positive regulation of telomere maintenance via telomerase | 24/7958 | 34/18723 | 8.62e-04 | 5.13e-03 | 24 |
| GO:200057312 | Liver | HCC | positive regulation of DNA biosynthetic process | 41/7958 | 66/18723 | 1.02e-03 | 5.86e-03 | 41 |
| GO:00353371 | Liver | HCC | fatty-acyl-CoA metabolic process | 26/7958 | 38/18723 | 1.11e-03 | 6.33e-03 | 26 |
| GO:0006665 | Liver | HCC | sphingolipid metabolic process | 85/7958 | 155/18723 | 1.27e-03 | 6.92e-03 | 85 |
| GO:001660121 | Liver | HCC | Rac protein signal transduction | 28/7958 | 42/18723 | 1.35e-03 | 7.26e-03 | 28 |
| GO:000726621 | Liver | HCC | Rho protein signal transduction | 76/7958 | 137/18723 | 1.46e-03 | 7.75e-03 | 76 |
| GO:0046467 | Liver | HCC | membrane lipid biosynthetic process | 78/7958 | 142/18723 | 1.85e-03 | 9.46e-03 | 78 |
| GO:00322001 | Liver | HCC | telomere organization | 86/7958 | 159/18723 | 2.06e-03 | 1.04e-02 | 86 |
| GO:00016553 | Liver | HCC | urogenital system development | 170/7958 | 338/18723 | 2.15e-03 | 1.08e-02 | 170 |
| GO:000725412 | Liver | HCC | JNK cascade | 89/7958 | 167/18723 | 3.09e-03 | 1.44e-02 | 89 |
| GO:1901568 | Liver | HCC | fatty acid derivative metabolic process | 43/7958 | 74/18723 | 4.85e-03 | 2.04e-02 | 43 |
| Page: 1 2 3 4 5 6 7 8 9 10 11 12 13 14 15 16 17 18 19 20 21 22 23 24 25 26 27 28 29 30 31 |
| Pathway ID | Tissue | Disease Stage | Description | Gene Ratio | Bg Ratio | pvalue | p.adjust | qvalue | Count |
| Page: 1 |
Top |
Cell-cell communication analysis |
| Identification of potential cell-cell interactions between two cell types and their ligand-receptor pairs for different disease states |
| Ligand | Receptor | LRpair | Pathway | Tissue | Disease Stage |
| Page: 1 |
Top |
Single-cell gene regulatory network inference analysis |
| Find out the significant the regulons (TFs) and the target genes of each regulon across cell types for different disease states |
| TF | Cell Type | Tissue | Disease Stage | Target Gene | RSS | Regulon Activity |
| ∗The dot plots of a searched regulon are shown for all cell subpopulations in each disease state of each tissue based on the regulon specific score inferred using pySCENIC and by calculating the average expression. |
| Page: 1 |
Top |
Somatic mutation of malignant transformation related genes |
| Annotation of somatic variants for genes involved in malignant transformation |
| Hugo Symbol | Variant Class | Variant Classification | dbSNP RS | HGVSc | HGVSp | HGVSp Short | SWISSPROT | BIOTYPE | SIFT | PolyPhen | Tumor Sample Barcode | Tissue | Histology | Sex | Age | Stage | Therapy Types | Drugs | Outcome |
| ACD | SNV | Missense_Mutation | c.229N>G | p.Pro77Ala | p.P77A | Q96AP0 | protein_coding | tolerated_low_confidence(0.84) | benign(0) | TCGA-E9-A1NA-01 | Breast | breast invasive carcinoma | Female | <65 | I/II | Chemotherapy | cyclophosphamide | SD | |
| ACD | deletion | Frame_Shift_Del | novel | c.1359delA | p.Lys453AsnfsTer10 | p.K453Nfs*10 | Q96AP0 | protein_coding | TCGA-EW-A2FV-01 | Breast | breast invasive carcinoma | Female | <65 | III/IV | Chemotherapy | docetaxel | SD | ||
| ACD | SNV | Missense_Mutation | c.874N>T | p.His292Tyr | p.H292Y | Q96AP0 | protein_coding | deleterious(0.01) | benign(0.091) | TCGA-EK-A2RA-01 | Cervix | cervical & endocervical cancer | Female | >=65 | I/II | Unknown | Unknown | SD | |
| ACD | SNV | Missense_Mutation | c.1006N>A | p.Glu336Lys | p.E336K | Q96AP0 | protein_coding | tolerated(0.07) | benign(0.078) | TCGA-FU-A5XV-01 | Cervix | cervical & endocervical cancer | Female | <65 | III/IV | Unknown | Unknown | SD | |
| ACD | insertion | Frame_Shift_Ins | novel | c.1206_1207insTGCTCAC | p.Pro403CysfsTer38 | p.P403Cfs*38 | Q96AP0 | protein_coding | TCGA-DS-A1OB-01 | Cervix | cervical & endocervical cancer | Female | <65 | I/II | Chemotherapy | carboplatin | PD | ||
| ACD | SNV | Missense_Mutation | rs747913250 | c.1405N>T | p.Arg469Trp | p.R469W | Q96AP0 | protein_coding | tolerated(0.25) | benign(0) | TCGA-AA-3663-01 | Colorectum | colon adenocarcinoma | Male | <65 | I/II | Unknown | Unknown | SD |
| ACD | SNV | Missense_Mutation | rs762262197 | c.1261C>T | p.Arg421Cys | p.R421C | Q96AP0 | protein_coding | tolerated(0.19) | benign(0.057) | TCGA-AZ-6598-01 | Colorectum | colon adenocarcinoma | Female | >=65 | I/II | Unknown | Unknown | SD |
| ACD | SNV | Missense_Mutation | c.469G>A | p.Val157Met | p.V157M | Q96AP0 | protein_coding | tolerated(0.07) | probably_damaging(0.957) | TCGA-CK-4951-01 | Colorectum | colon adenocarcinoma | Female | >=65 | I/II | Unknown | Unknown | PD | |
| ACD | SNV | Missense_Mutation | c.1217N>A | p.Cys406Tyr | p.C406Y | Q96AP0 | protein_coding | deleterious(0.04) | possibly_damaging(0.867) | TCGA-F4-6570-01 | Colorectum | colon adenocarcinoma | Female | >=65 | I/II | Unknown | Unknown | SD | |
| ACD | SNV | Missense_Mutation | rs781117606 | c.1409N>T | p.Pro470Leu | p.P470L | Q96AP0 | protein_coding | tolerated(0.09) | benign(0) | TCGA-G4-6306-01 | Colorectum | colon adenocarcinoma | Male | >=65 | I/II | Unknown | Unknown | SD |
| Page: 1 2 3 4 |
Top |
Related drugs of malignant transformation related genes |
| Identification of chemicals and drugs interact with genes involved in malignant transfromation |
| (DGIdb 4.0) |
| Entrez ID | Symbol | Category | Interaction Types | Drug Claim Name | Drug Name | PMIDs |
| Page: 1 |

Copyright 2023-Present -The University of Texas Health Science Center at Houston |