
|
|||||
|
 | |
| |
| |
| |
| |
| |
|
Gene: TMEM5 |
Gene summary for TMEM5 |
| Gene information | Species | Human | Gene symbol | TMEM5 | Gene ID | 10329 |
| Gene name | ribitol xylosyltransferase 1 | |
| Gene Alias | HP10481 | |
| Cytomap | 12q14.2 | |
| Gene Type | protein-coding | GO ID | GO:0006464 | UniProtAcc | G3V1K2 |
Top |
Malignant transformation analysis |
| Identification of the aberrant gene expression in precancerous and cancerous lesions by comparing the gene expression of stem-like cells in diseased tissues with normal stem cells |
| Entrez ID | Symbol | Replicates | Species | Organ | Tissue | Adj P-value | Log2FC | Malignancy |
| 10329 | TMEM5 | P1T-E | Human | Esophagus | ESCC | 6.83e-08 | 4.35e-01 | 0.0875 |
| 10329 | TMEM5 | P2T-E | Human | Esophagus | ESCC | 1.54e-56 | 1.00e+00 | 0.1177 |
| 10329 | TMEM5 | P4T-E | Human | Esophagus | ESCC | 1.16e-16 | 4.26e-01 | 0.1323 |
| 10329 | TMEM5 | P5T-E | Human | Esophagus | ESCC | 2.59e-11 | 2.34e-01 | 0.1327 |
| 10329 | TMEM5 | P8T-E | Human | Esophagus | ESCC | 8.13e-22 | 4.88e-01 | 0.0889 |
| 10329 | TMEM5 | P9T-E | Human | Esophagus | ESCC | 5.17e-15 | 2.90e-01 | 0.1131 |
| 10329 | TMEM5 | P10T-E | Human | Esophagus | ESCC | 1.70e-32 | 5.60e-01 | 0.116 |
| 10329 | TMEM5 | P11T-E | Human | Esophagus | ESCC | 2.67e-12 | 3.16e-01 | 0.1426 |
| 10329 | TMEM5 | P12T-E | Human | Esophagus | ESCC | 1.35e-10 | 2.77e-01 | 0.1122 |
| 10329 | TMEM5 | P15T-E | Human | Esophagus | ESCC | 8.76e-18 | 3.60e-01 | 0.1149 |
| 10329 | TMEM5 | P16T-E | Human | Esophagus | ESCC | 2.57e-27 | 5.21e-01 | 0.1153 |
| 10329 | TMEM5 | P19T-E | Human | Esophagus | ESCC | 5.11e-06 | 4.58e-01 | 0.1662 |
| 10329 | TMEM5 | P20T-E | Human | Esophagus | ESCC | 9.38e-21 | 4.92e-01 | 0.1124 |
| 10329 | TMEM5 | P21T-E | Human | Esophagus | ESCC | 2.45e-25 | 4.03e-01 | 0.1617 |
| 10329 | TMEM5 | P22T-E | Human | Esophagus | ESCC | 6.88e-35 | 5.14e-01 | 0.1236 |
| 10329 | TMEM5 | P23T-E | Human | Esophagus | ESCC | 6.57e-24 | 6.02e-01 | 0.108 |
| 10329 | TMEM5 | P24T-E | Human | Esophagus | ESCC | 1.05e-15 | 2.40e-01 | 0.1287 |
| 10329 | TMEM5 | P26T-E | Human | Esophagus | ESCC | 3.17e-23 | 4.70e-01 | 0.1276 |
| 10329 | TMEM5 | P27T-E | Human | Esophagus | ESCC | 6.41e-13 | 3.45e-01 | 0.1055 |
| 10329 | TMEM5 | P28T-E | Human | Esophagus | ESCC | 2.93e-17 | 3.83e-01 | 0.1149 |
| Page: 1 2 3 4 |
| Tissue | Expression Dynamics | Abbreviation |
| Esophagus | 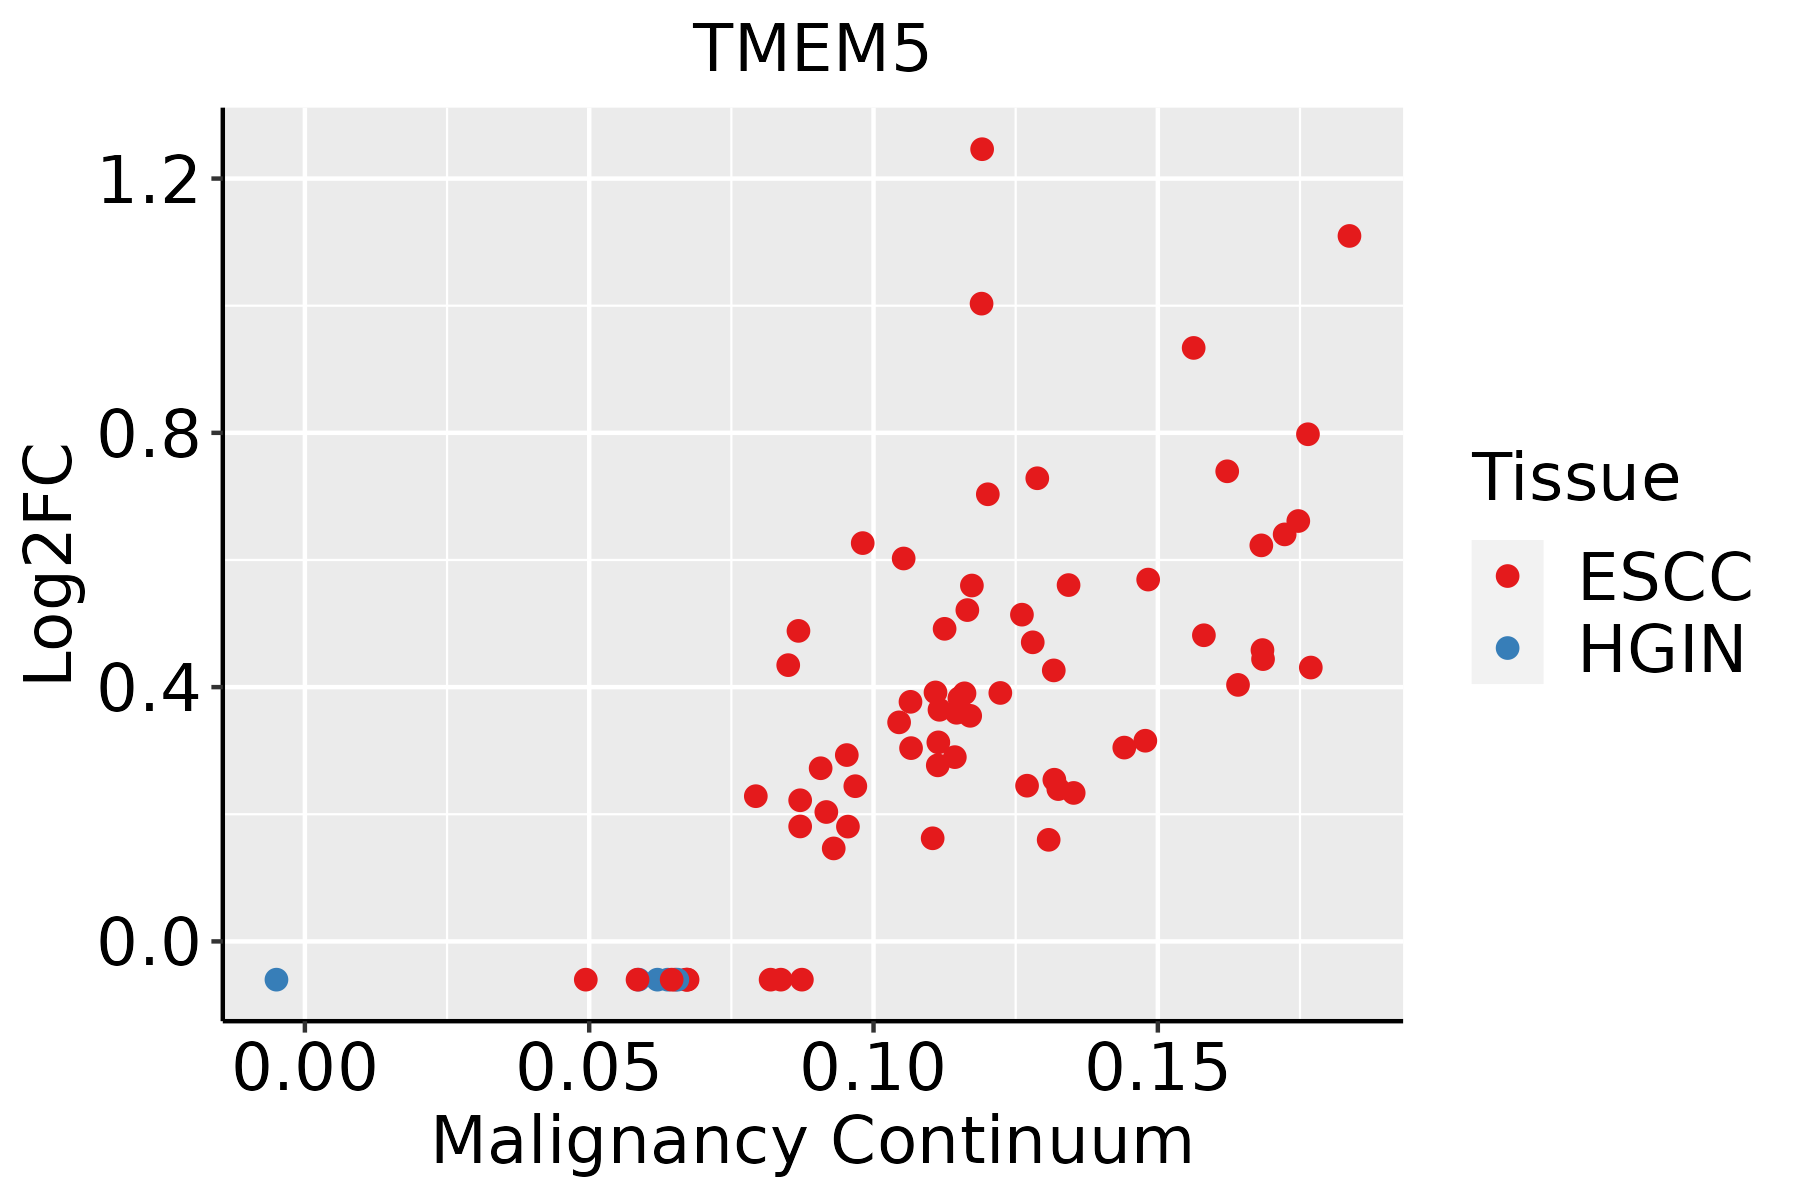 | ESCC: Esophageal squamous cell carcinoma |
| HGIN: High-grade intraepithelial neoplasias | ||
| LGIN: Low-grade intraepithelial neoplasias | ||
| Oral Cavity |  | EOLP: Erosive Oral lichen planus |
| LP: leukoplakia | ||
| NEOLP: Non-erosive oral lichen planus | ||
| OSCC: Oral squamous cell carcinoma | ||
| Skin | 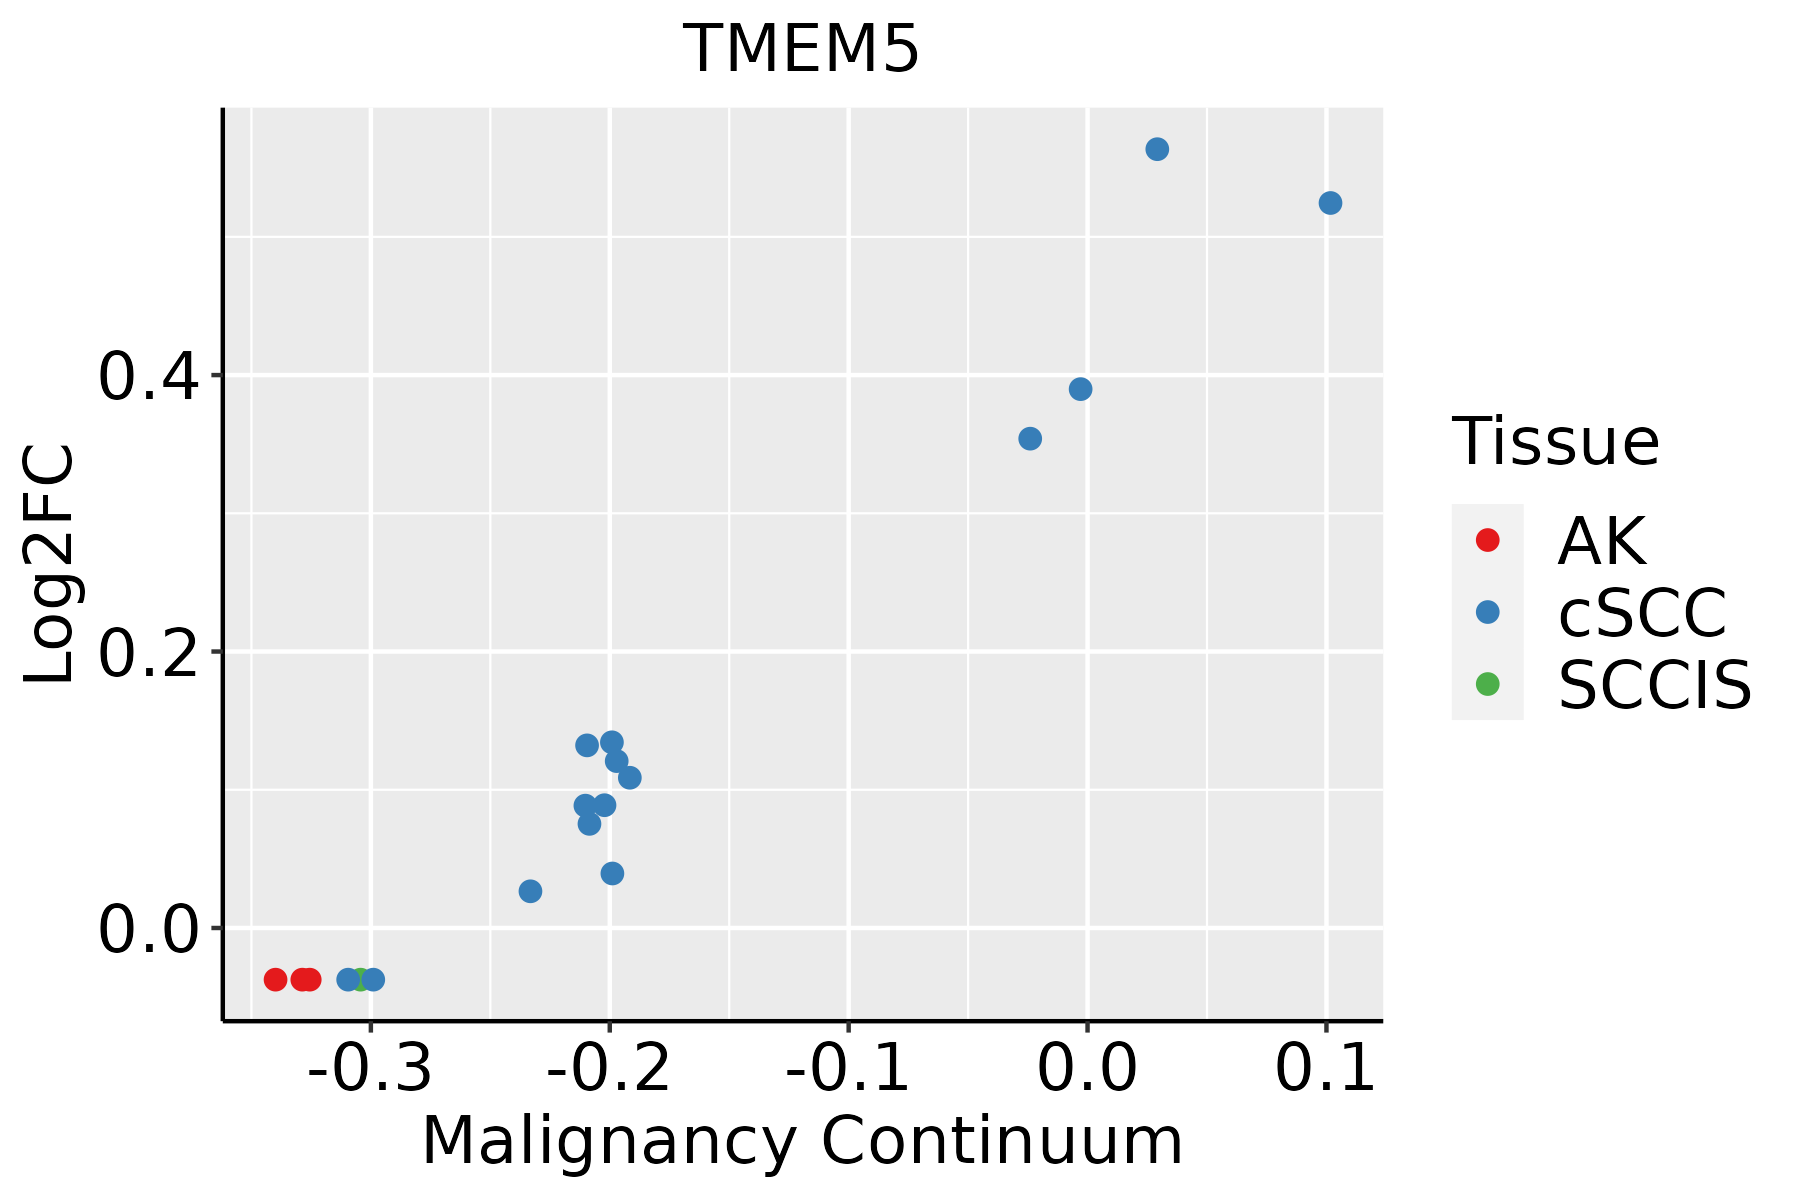 | AK: Actinic keratosis |
| cSCC: Cutaneous squamous cell carcinoma | ||
| SCCIS:squamous cell carcinoma in situ |
| ∗log2FC in expression of this searched gene in stem-like cells from each diseased tissue sample relative to stem-like cells in normal samples in each tissue plotted against the malignancy continuum. Samples are colored based on if they are from different disease stage. |
Top |
Malignant transformation related pathway analysis |
| Find out the enriched GO biological processes and KEGG pathways involved in transition from healthy to precancer to cancer |
| Tissue | Disease Stage | Enriched GO biological Processes |
| Colorectum | AD |  |
| Colorectum | SER |  |
| Colorectum | MSS |  |
| Colorectum | MSI-H |  |
| Colorectum | FAP |  |
| ∗Top 15 enriched GO BP terms are showed in the bar plot of each disease state in each tissue. Each row represents a significant GO biological process which is colored according to the -log10(p.adjust). |
| Page: 1 2 3 4 5 6 7 8 9 |
| GO ID | Tissue | Disease Stage | Description | Gene Ratio | Bg Ratio | pvalue | p.adjust | Count |
| GO:000703414 | Prostate | Tumor | vacuolar transport | 48/3246 | 157/18723 | 3.18e-05 | 3.78e-04 | 48 |
| GO:001648512 | Prostate | Tumor | protein processing | 63/3246 | 225/18723 | 4.40e-05 | 4.98e-04 | 63 |
| GO:001050814 | Prostate | Tumor | positive regulation of autophagy | 39/3246 | 124/18723 | 8.56e-05 | 8.53e-04 | 39 |
| GO:190437515 | Prostate | Tumor | regulation of protein localization to cell periphery | 39/3246 | 125/18723 | 1.04e-04 | 1.00e-03 | 39 |
| GO:001619713 | Prostate | Tumor | endosomal transport | 62/3246 | 230/18723 | 1.65e-04 | 1.47e-03 | 62 |
| GO:190382812 | Prostate | Tumor | negative regulation of cellular protein localization | 36/3246 | 117/18723 | 2.55e-04 | 2.14e-03 | 36 |
| GO:007198512 | Prostate | Tumor | multivesicular body sorting pathway | 15/3246 | 37/18723 | 7.46e-04 | 5.14e-03 | 15 |
| GO:003250913 | Prostate | Tumor | endosome transport via multivesicular body sorting pathway | 12/3246 | 31/18723 | 3.92e-03 | 1.99e-02 | 12 |
| GO:004532412 | Prostate | Tumor | late endosome to vacuole transport | 10/3246 | 25/18723 | 6.30e-03 | 2.89e-02 | 10 |
| GO:000989627 | Skin | AK | positive regulation of catabolic process | 94/1910 | 492/18723 | 1.32e-09 | 1.26e-07 | 94 |
| GO:004586127 | Skin | AK | negative regulation of proteolysis | 72/1910 | 351/18723 | 5.40e-09 | 3.90e-07 | 72 |
| GO:003133127 | Skin | AK | positive regulation of cellular catabolic process | 80/1910 | 427/18723 | 5.42e-08 | 2.76e-06 | 80 |
| GO:007265925 | Skin | AK | protein localization to plasma membrane | 59/1910 | 284/18723 | 8.01e-08 | 3.80e-06 | 59 |
| GO:199077820 | Skin | AK | protein localization to cell periphery | 66/1910 | 333/18723 | 9.18e-08 | 4.21e-06 | 66 |
| GO:190547520 | Skin | AK | regulation of protein localization to membrane | 37/1910 | 175/18723 | 1.33e-05 | 2.62e-04 | 37 |
| GO:190437520 | Skin | AK | regulation of protein localization to cell periphery | 28/1910 | 125/18723 | 4.89e-05 | 7.60e-04 | 28 |
| GO:190307620 | Skin | AK | regulation of protein localization to plasma membrane | 24/1910 | 104/18723 | 1.01e-04 | 1.33e-03 | 24 |
| GO:001619716 | Skin | AK | endosomal transport | 41/1910 | 230/18723 | 2.76e-04 | 2.93e-03 | 41 |
| GO:190382810 | Skin | AK | negative regulation of cellular protein localization | 24/1910 | 117/18723 | 6.54e-04 | 5.64e-03 | 24 |
| GO:001050618 | Skin | AK | regulation of autophagy | 51/1910 | 317/18723 | 6.97e-04 | 5.96e-03 | 51 |
| Page: 1 2 3 4 5 6 7 8 9 10 11 12 13 14 15 16 17 18 19 20 21 22 23 |
| Pathway ID | Tissue | Disease Stage | Description | Gene Ratio | Bg Ratio | pvalue | p.adjust | qvalue | Count |
| Page: 1 |
Top |
Cell-cell communication analysis |
| Identification of potential cell-cell interactions between two cell types and their ligand-receptor pairs for different disease states |
| Ligand | Receptor | LRpair | Pathway | Tissue | Disease Stage |
| Page: 1 |
Top |
Single-cell gene regulatory network inference analysis |
| Find out the significant the regulons (TFs) and the target genes of each regulon across cell types for different disease states |
| TF | Cell Type | Tissue | Disease Stage | Target Gene | RSS | Regulon Activity |
| ∗The dot plots of a searched regulon are shown for all cell subpopulations in each disease state of each tissue based on the regulon specific score inferred using pySCENIC and by calculating the average expression. |
| Page: 1 |
Top |
Somatic mutation of malignant transformation related genes |
| Annotation of somatic variants for genes involved in malignant transformation |
| Hugo Symbol | Variant Class | Variant Classification | dbSNP RS | HGVSc | HGVSp | HGVSp Short | SWISSPROT | BIOTYPE | SIFT | PolyPhen | Tumor Sample Barcode | Tissue | Histology | Sex | Age | Stage | Therapy Types | Drugs | Outcome |
| TMEM5 | SNV | Missense_Mutation | novel | c.1220N>C | p.Lys407Thr | p.K407T | Q9Y2B1 | protein_coding | deleterious(0.01) | probably_damaging(0.961) | TCGA-AN-A046-01 | Breast | breast invasive carcinoma | Female | >=65 | I/II | Unknown | Unknown | SD |
| TMEM5 | SNV | Missense_Mutation | c.287N>T | p.Thr96Ile | p.T96I | Q9Y2B1 | protein_coding | tolerated(0.11) | benign(0.003) | TCGA-BH-A0HF-01 | Breast | breast invasive carcinoma | Female | >=65 | I/II | Hormone Therapy | arimidex | SD | |
| TMEM5 | SNV | Missense_Mutation | novel | c.739G>A | p.Ala247Thr | p.A247T | Q9Y2B1 | protein_coding | deleterious(0) | probably_damaging(0.998) | TCGA-OL-A6VQ-01 | Breast | breast invasive carcinoma | Female | <65 | I/II | Unknown | Unknown | SD |
| TMEM5 | SNV | Missense_Mutation | novel | c.239G>A | p.Arg80Lys | p.R80K | Q9Y2B1 | protein_coding | tolerated(0.38) | benign(0.009) | TCGA-JW-A5VL-01 | Cervix | cervical & endocervical cancer | Female | <65 | I/II | Unknown | Unknown | SD |
| TMEM5 | SNV | Missense_Mutation | rs570064856 | c.154G>C | p.Glu52Gln | p.E52Q | Q9Y2B1 | protein_coding | tolerated(0.39) | benign(0.221) | TCGA-VS-A9UU-01 | Cervix | cervical & endocervical cancer | Female | <65 | I/II | Chemotherapy | cisplatin | CR |
| TMEM5 | SNV | Missense_Mutation | c.559N>G | p.Leu187Val | p.L187V | Q9Y2B1 | protein_coding | deleterious(0) | possibly_damaging(0.861) | TCGA-AA-3977-01 | Colorectum | colon adenocarcinoma | Male | >=65 | I/II | Unknown | Unknown | SD | |
| TMEM5 | SNV | Missense_Mutation | c.559N>G | p.Leu187Val | p.L187V | Q9Y2B1 | protein_coding | deleterious(0) | possibly_damaging(0.861) | TCGA-CA-6717-01 | Colorectum | colon adenocarcinoma | Male | <65 | I/II | Chemotherapy | oxaliplatin | CR | |
| TMEM5 | SNV | Missense_Mutation | novel | c.724N>C | p.Trp242Arg | p.W242R | Q9Y2B1 | protein_coding | deleterious(0) | probably_damaging(0.999) | TCGA-AG-A002-01 | Colorectum | rectum adenocarcinoma | Male | <65 | I/II | Unknown | Unknown | SD |
| TMEM5 | SNV | Missense_Mutation | novel | c.1133N>T | p.Ser378Phe | p.S378F | Q9Y2B1 | protein_coding | deleterious(0.02) | possibly_damaging(0.568) | TCGA-A5-A2K5-01 | Endometrium | uterine corpus endometrioid carcinoma | Female | >=65 | I/II | Unknown | Unknown | SD |
| TMEM5 | SNV | Missense_Mutation | novel | c.316G>A | p.Ala106Thr | p.A106T | Q9Y2B1 | protein_coding | deleterious(0.03) | probably_damaging(0.998) | TCGA-AJ-A2QO-01 | Endometrium | uterine corpus endometrioid carcinoma | Female | >=65 | I/II | Unknown | Unknown | SD |
| Page: 1 2 3 4 5 |
Top |
Related drugs of malignant transformation related genes |
| Identification of chemicals and drugs interact with genes involved in malignant transfromation |
| (DGIdb 4.0) |
| Entrez ID | Symbol | Category | Interaction Types | Drug Claim Name | Drug Name | PMIDs |
| Page: 1 |

Copyright 2023-Present -The University of Texas Health Science Center at Houston |