
|
|||||
|
 | |
| |
| |
| |
| |
| |
|
Gene: STUB1 |
Gene summary for STUB1 |
| Gene information | Species | Human | Gene symbol | STUB1 | Gene ID | 10273 |
| Gene name | STIP1 homology and U-box containing protein 1 | |
| Gene Alias | CHIP | |
| Cytomap | 16p13.3 | |
| Gene Type | protein-coding | GO ID | GO:0000209 | UniProtAcc | Q9UNE7 |
Top |
Malignant transformation analysis |
| Identification of the aberrant gene expression in precancerous and cancerous lesions by comparing the gene expression of stem-like cells in diseased tissues with normal stem cells |
| Entrez ID | Symbol | Replicates | Species | Organ | Tissue | Adj P-value | Log2FC | Malignancy |
| 10273 | STUB1 | GSM4909280 | Human | Breast | Precancer | 3.94e-02 | -4.40e-01 | 0.0305 |
| 10273 | STUB1 | GSM4909293 | Human | Breast | IDC | 1.15e-09 | 3.65e-01 | 0.1581 |
| 10273 | STUB1 | GSM4909294 | Human | Breast | IDC | 3.88e-05 | 2.36e-01 | 0.2022 |
| 10273 | STUB1 | GSM4909296 | Human | Breast | IDC | 3.47e-06 | -1.82e-02 | 0.1524 |
| 10273 | STUB1 | GSM4909297 | Human | Breast | IDC | 1.23e-12 | -1.26e-01 | 0.1517 |
| 10273 | STUB1 | GSM4909298 | Human | Breast | IDC | 1.29e-02 | 1.96e-01 | 0.1551 |
| 10273 | STUB1 | GSM4909304 | Human | Breast | IDC | 1.87e-36 | 6.72e-01 | 0.1636 |
| 10273 | STUB1 | GSM4909306 | Human | Breast | IDC | 5.80e-31 | 6.32e-01 | 0.1564 |
| 10273 | STUB1 | GSM4909308 | Human | Breast | IDC | 1.41e-05 | 2.72e-01 | 0.158 |
| 10273 | STUB1 | GSM4909311 | Human | Breast | IDC | 2.45e-24 | -1.95e-01 | 0.1534 |
| 10273 | STUB1 | GSM4909312 | Human | Breast | IDC | 9.05e-10 | 5.95e-02 | 0.1552 |
| 10273 | STUB1 | GSM4909313 | Human | Breast | IDC | 1.15e-02 | 1.80e-01 | 0.0391 |
| 10273 | STUB1 | GSM4909315 | Human | Breast | IDC | 4.26e-02 | 2.37e-01 | 0.21 |
| 10273 | STUB1 | GSM4909316 | Human | Breast | IDC | 4.76e-07 | 4.39e-01 | 0.21 |
| 10273 | STUB1 | GSM4909317 | Human | Breast | IDC | 6.34e-07 | 3.51e-01 | 0.1355 |
| 10273 | STUB1 | GSM4909318 | Human | Breast | IDC | 8.44e-04 | 4.32e-01 | 0.2031 |
| 10273 | STUB1 | GSM4909319 | Human | Breast | IDC | 8.57e-45 | 2.58e-01 | 0.1563 |
| 10273 | STUB1 | GSM4909320 | Human | Breast | IDC | 4.58e-05 | 1.50e-01 | 0.1575 |
| 10273 | STUB1 | GSM4909321 | Human | Breast | IDC | 5.50e-18 | 1.69e-01 | 0.1559 |
| 10273 | STUB1 | brca1 | Human | Breast | Precancer | 6.08e-13 | 4.24e-01 | -0.0338 |
| Page: 1 2 3 4 5 6 7 8 9 |
| Tissue | Expression Dynamics | Abbreviation |
| Breast | 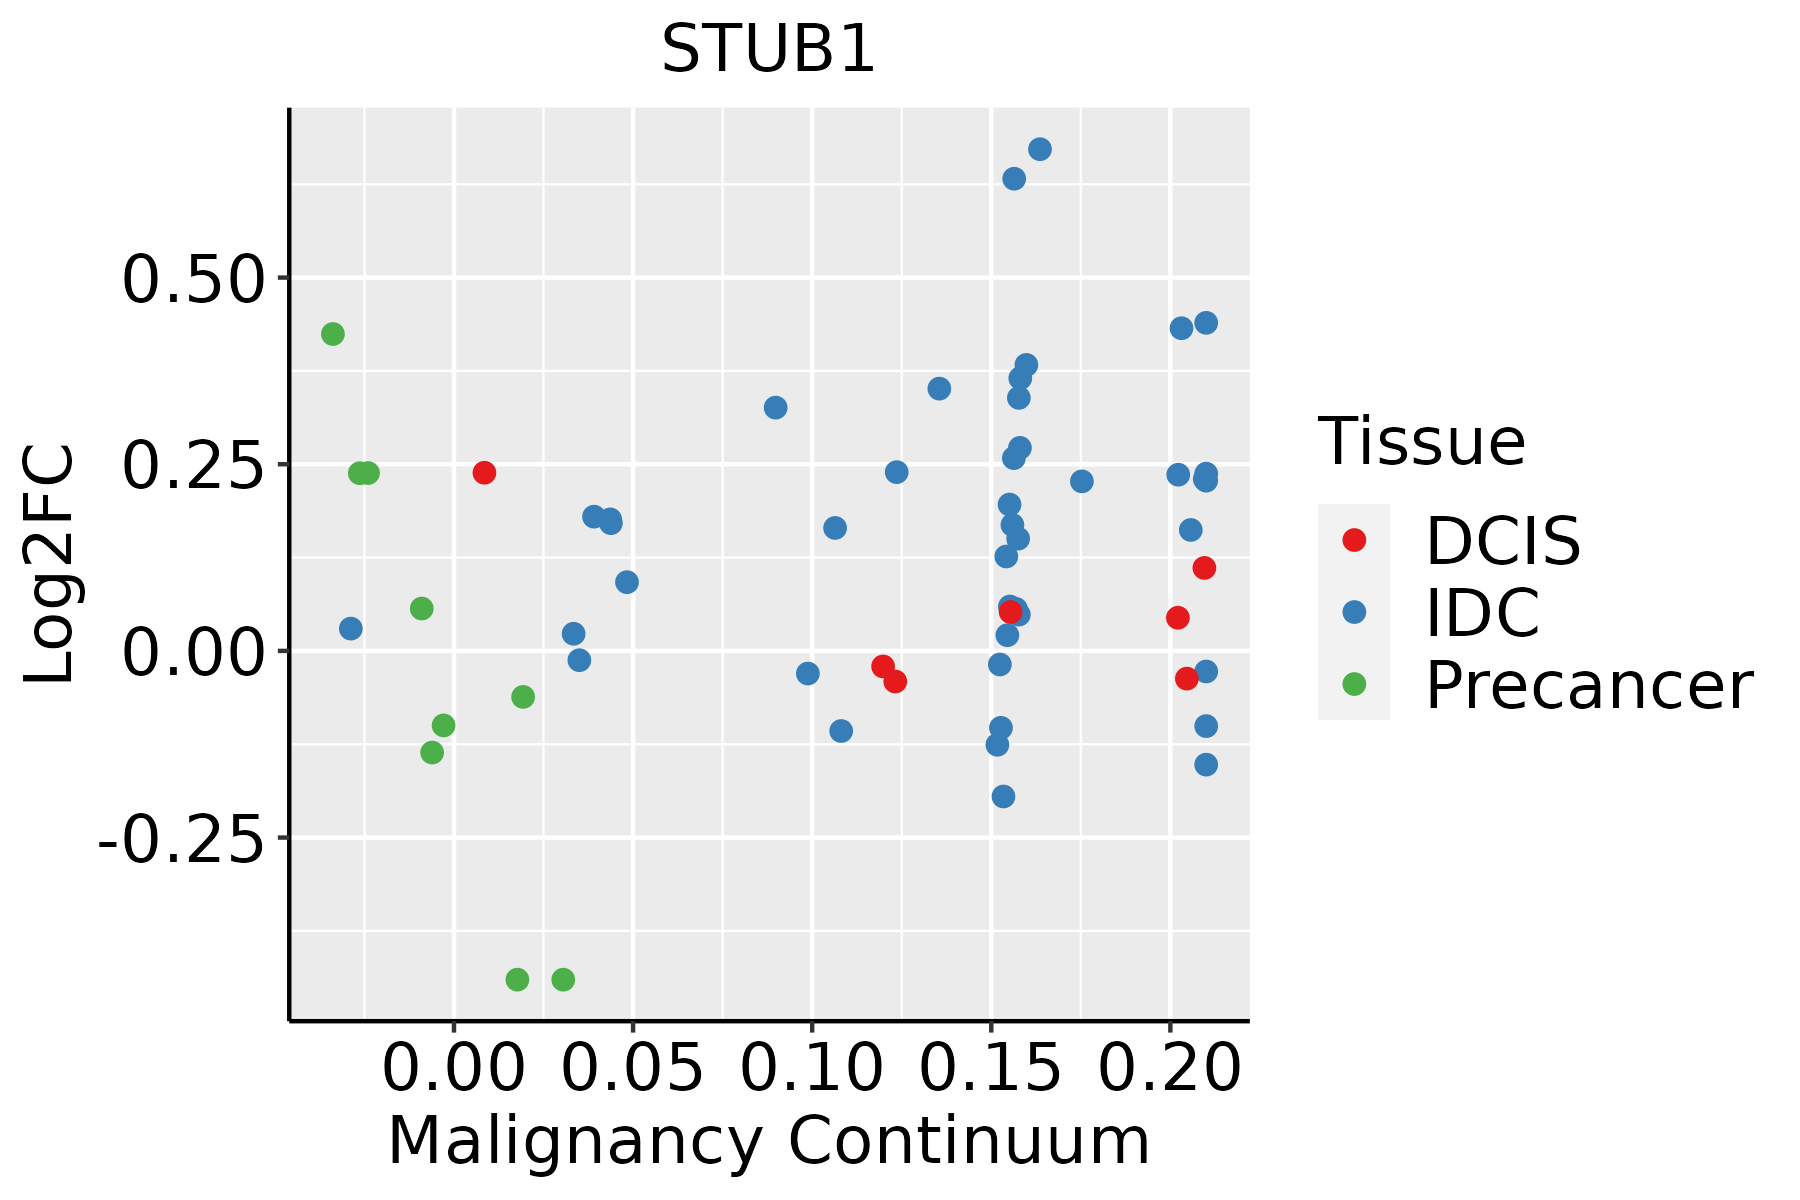 | IDC: Invasive ductal carcinoma |
| DCIS: Ductal carcinoma in situ | ||
| Precancer(BRCA1-mut): Precancerous lesion from BRCA1 mutation carriers | ||
| Endometrium | 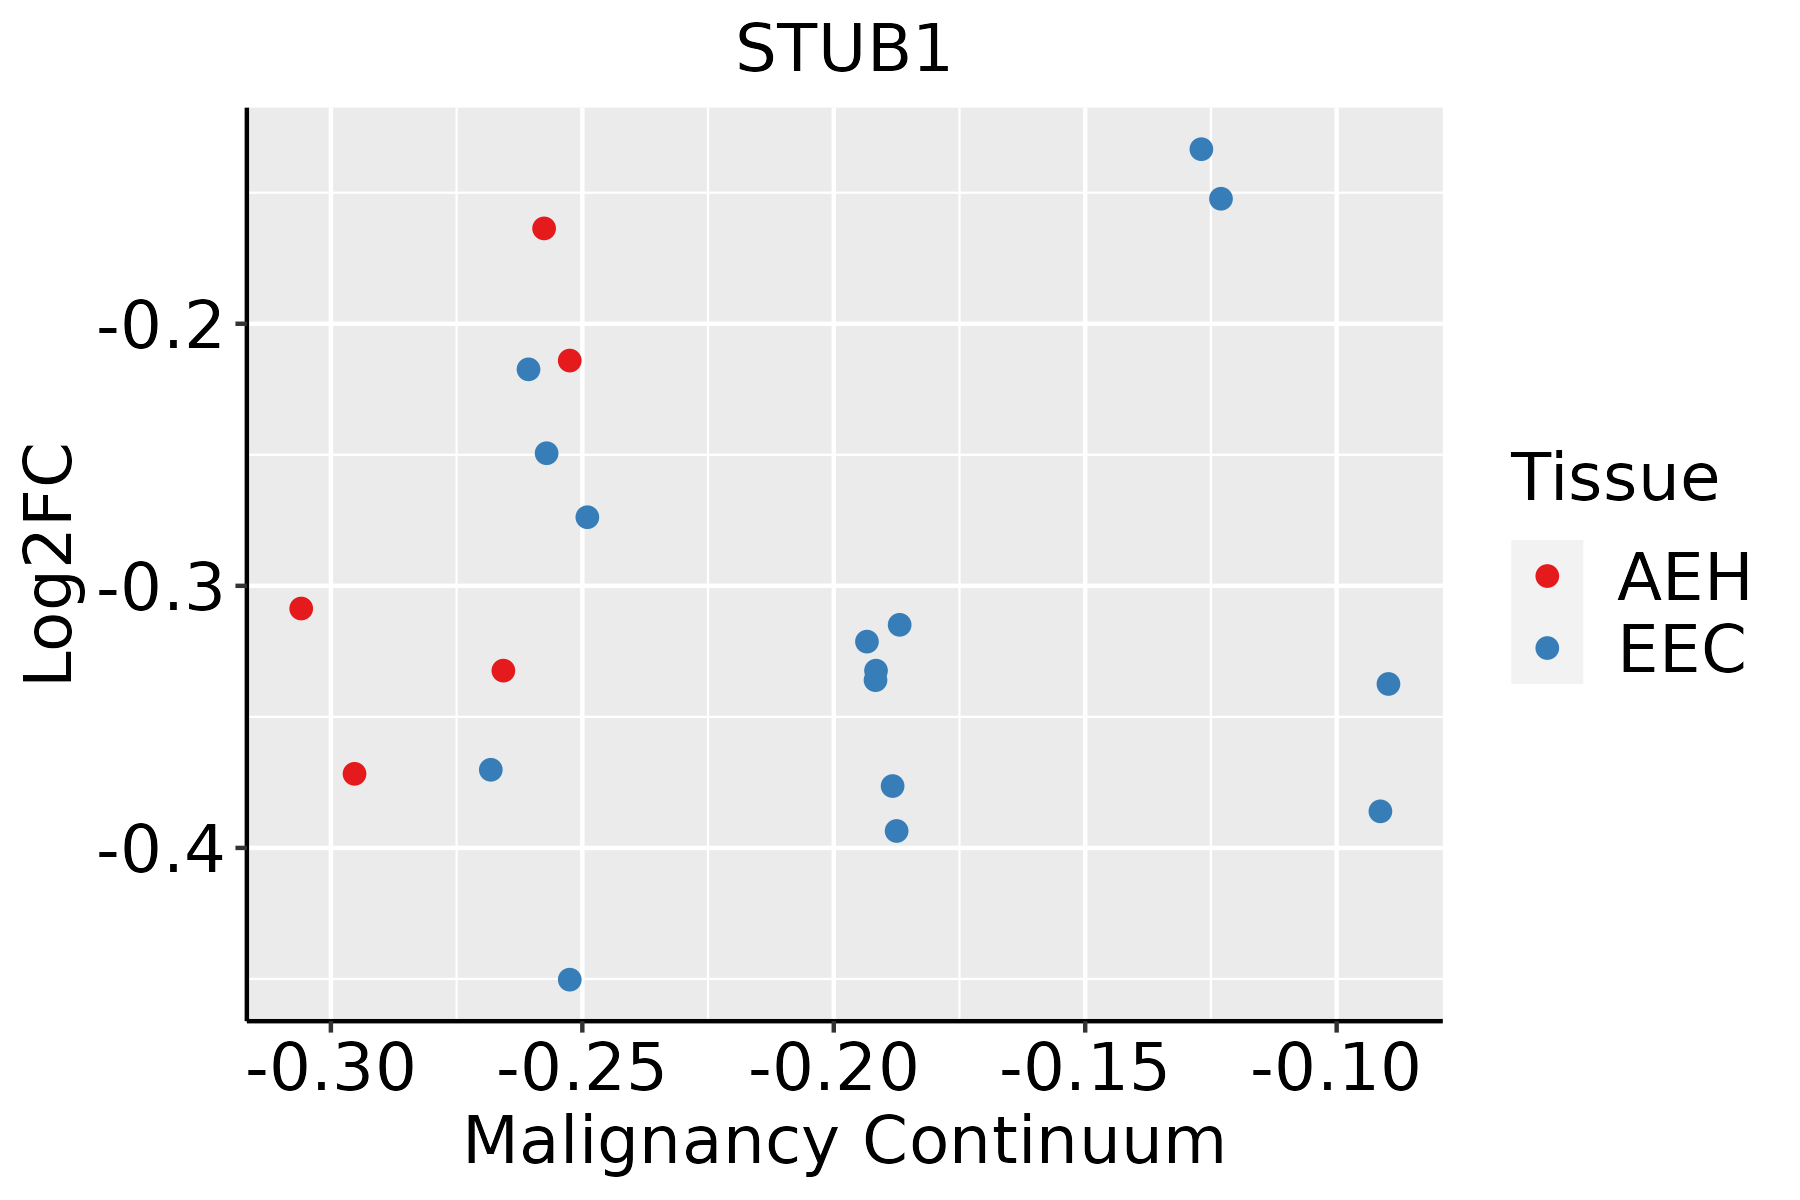 | AEH: Atypical endometrial hyperplasia |
| EEC: Endometrioid Cancer | ||
| Esophagus | 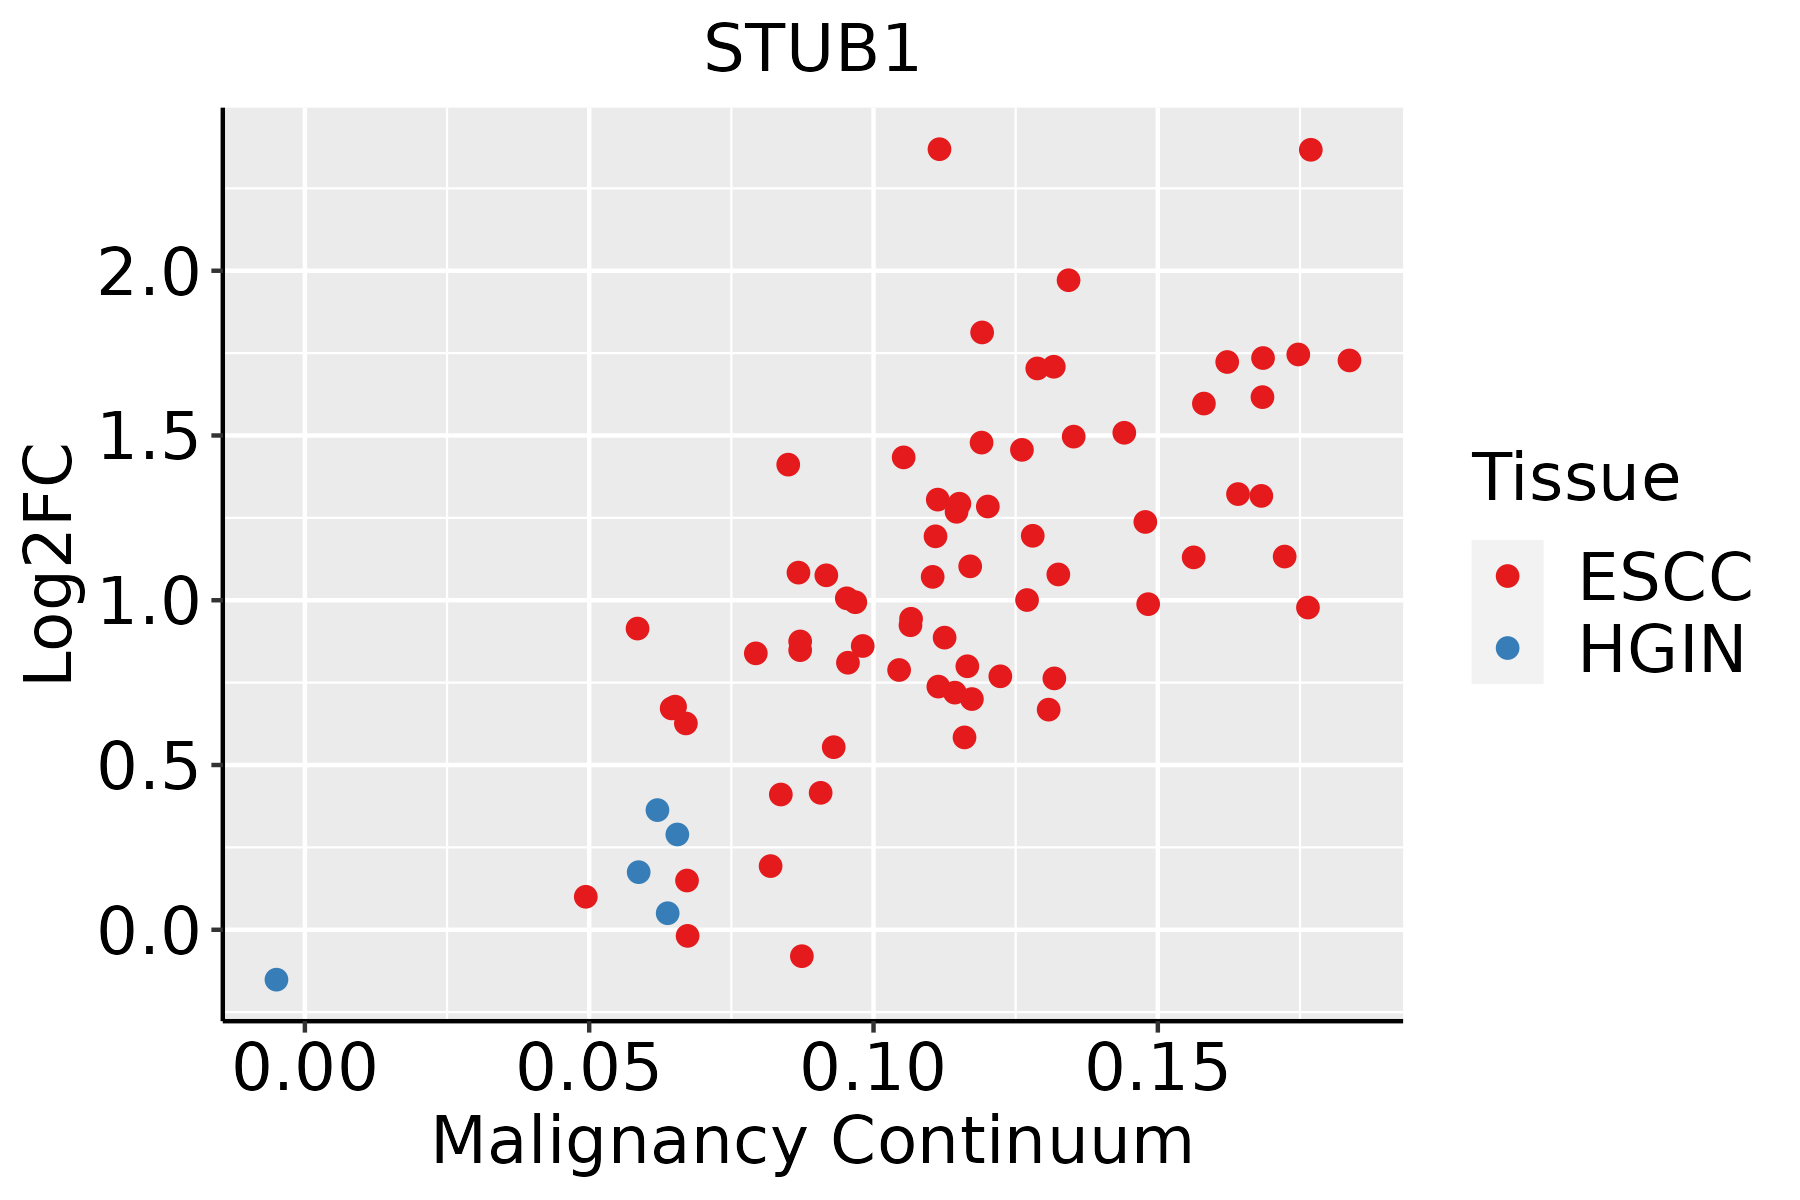 | ESCC: Esophageal squamous cell carcinoma |
| HGIN: High-grade intraepithelial neoplasias | ||
| LGIN: Low-grade intraepithelial neoplasias | ||
| Liver | 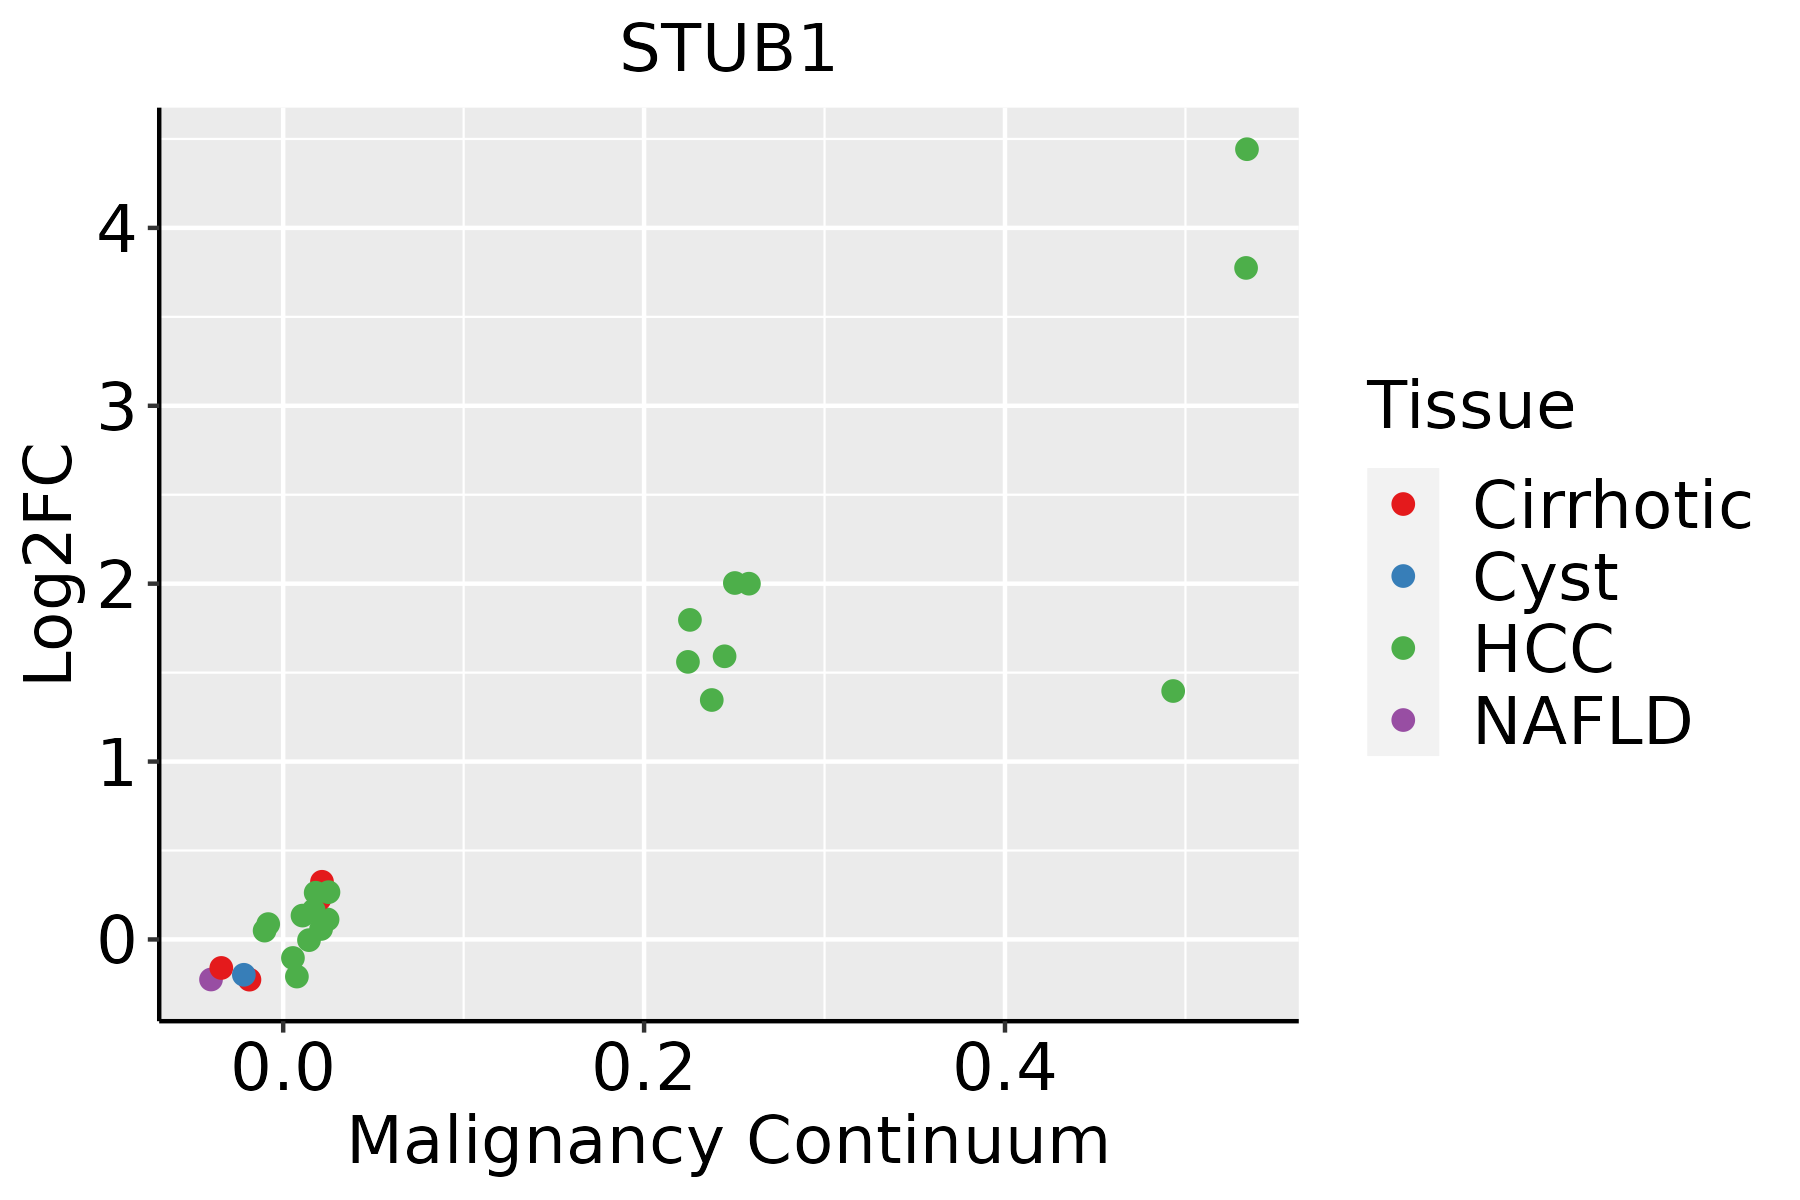 | HCC: Hepatocellular carcinoma |
| NAFLD: Non-alcoholic fatty liver disease | ||
| Oral Cavity | 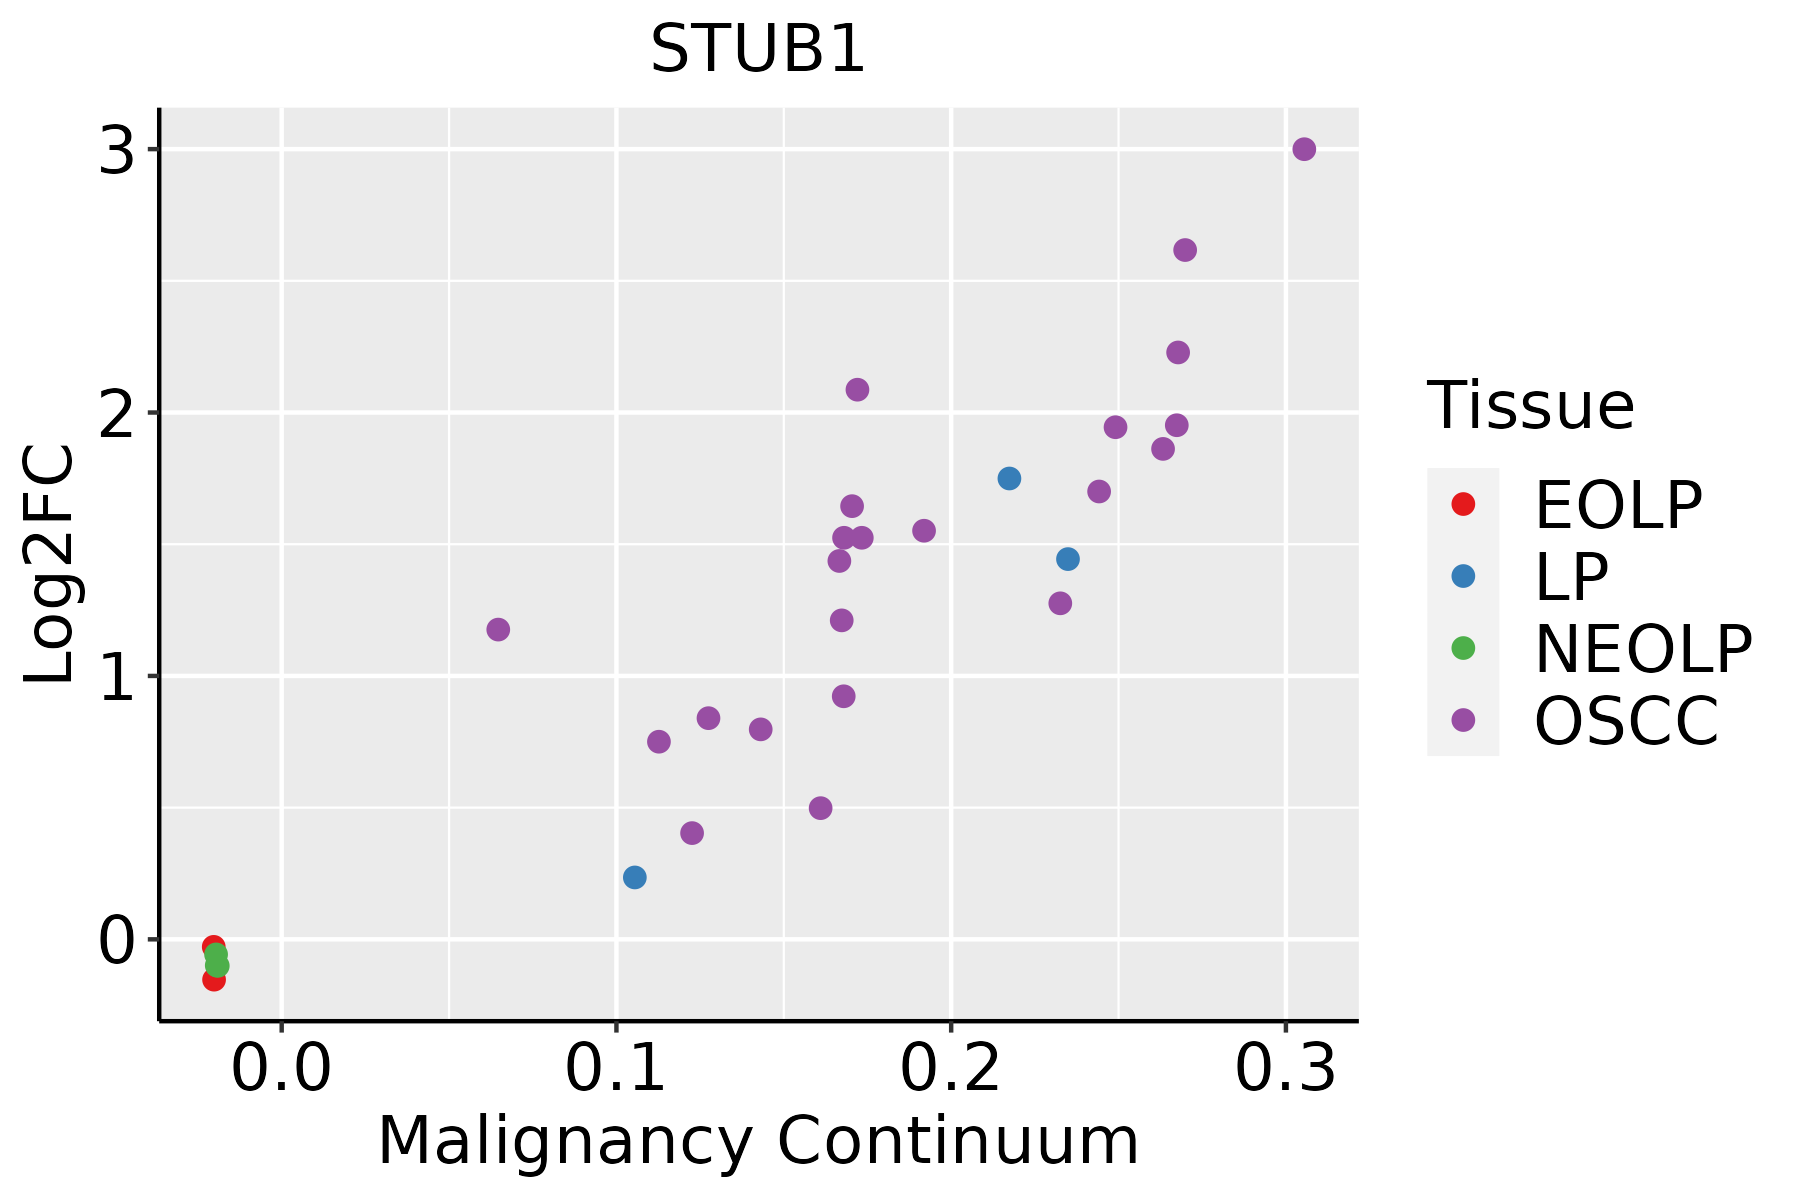 | EOLP: Erosive Oral lichen planus |
| LP: leukoplakia | ||
| NEOLP: Non-erosive oral lichen planus | ||
| OSCC: Oral squamous cell carcinoma | ||
| Prostate |  | BPH: Benign Prostatic Hyperplasia |
| Skin |  | AK: Actinic keratosis |
| cSCC: Cutaneous squamous cell carcinoma | ||
| SCCIS:squamous cell carcinoma in situ | ||
| Thyroid |  | ATC: Anaplastic thyroid cancer |
| HT: Hashimoto's thyroiditis | ||
| PTC: Papillary thyroid cancer |
| ∗log2FC in expression of this searched gene in stem-like cells from each diseased tissue sample relative to stem-like cells in normal samples in each tissue plotted against the malignancy continuum. Samples are colored based on if they are from different disease stage. |
Top |
Malignant transformation related pathway analysis |
| Find out the enriched GO biological processes and KEGG pathways involved in transition from healthy to precancer to cancer |
| Tissue | Disease Stage | Enriched GO biological Processes |
| Colorectum | AD |  |
| Colorectum | SER |  |
| Colorectum | MSS |  |
| Colorectum | MSI-H |  |
| Colorectum | FAP |  |
| ∗Top 15 enriched GO BP terms are showed in the bar plot of each disease state in each tissue. Each row represents a significant GO biological process which is colored according to the -log10(p.adjust). |
| Page: 1 2 3 4 5 6 7 8 9 |
| GO ID | Tissue | Disease Stage | Description | Gene Ratio | Bg Ratio | pvalue | p.adjust | Count |
| GO:004339312 | Liver | Cirrhotic | regulation of protein binding | 83/4634 | 196/18723 | 4.44e-08 | 1.42e-06 | 83 |
| GO:200006012 | Liver | Cirrhotic | positive regulation of ubiquitin-dependent protein catabolic process | 52/4634 | 107/18723 | 7.75e-08 | 2.30e-06 | 52 |
| GO:00313347 | Liver | Cirrhotic | positive regulation of protein-containing complex assembly | 95/4634 | 237/18723 | 1.21e-07 | 3.39e-06 | 95 |
| GO:19018005 | Liver | Cirrhotic | positive regulation of proteasomal protein catabolic process | 54/4634 | 114/18723 | 1.30e-07 | 3.57e-06 | 54 |
| GO:00704827 | Liver | Cirrhotic | response to oxygen levels | 125/4634 | 347/18723 | 1.55e-06 | 3.02e-05 | 125 |
| GO:00324366 | Liver | Cirrhotic | positive regulation of proteasomal ubiquitin-dependent protein catabolic process | 43/4634 | 90/18723 | 1.80e-06 | 3.40e-05 | 43 |
| GO:00346057 | Liver | Cirrhotic | cellular response to heat | 35/4634 | 69/18723 | 2.90e-06 | 5.16e-05 | 35 |
| GO:001921611 | Liver | Cirrhotic | regulation of lipid metabolic process | 119/4634 | 331/18723 | 3.05e-06 | 5.39e-05 | 119 |
| GO:007155911 | Liver | Cirrhotic | response to transforming growth factor beta | 96/4634 | 256/18723 | 3.55e-06 | 6.09e-05 | 96 |
| GO:00094087 | Liver | Cirrhotic | response to heat | 49/4634 | 110/18723 | 4.47e-06 | 7.42e-05 | 49 |
| GO:000020911 | Liver | Cirrhotic | protein polyubiquitination | 89/4634 | 236/18723 | 6.09e-06 | 9.80e-05 | 89 |
| GO:007156011 | Liver | Cirrhotic | cellular response to transforming growth factor beta stimulus | 93/4634 | 250/18723 | 7.34e-06 | 1.13e-04 | 93 |
| GO:00511316 | Liver | Cirrhotic | chaperone-mediated protein complex assembly | 16/4634 | 23/18723 | 7.54e-06 | 1.15e-04 | 16 |
| GO:00362937 | Liver | Cirrhotic | response to decreased oxygen levels | 113/4634 | 322/18723 | 1.87e-05 | 2.52e-04 | 113 |
| GO:00192181 | Liver | Cirrhotic | regulation of steroid metabolic process | 44/4634 | 100/18723 | 1.97e-05 | 2.62e-04 | 44 |
| GO:00016667 | Liver | Cirrhotic | response to hypoxia | 108/4634 | 307/18723 | 2.51e-05 | 3.26e-04 | 108 |
| GO:00511006 | Liver | Cirrhotic | negative regulation of binding | 63/4634 | 162/18723 | 4.54e-05 | 5.31e-04 | 63 |
| GO:00714536 | Liver | Cirrhotic | cellular response to oxygen levels | 67/4634 | 177/18723 | 7.10e-05 | 7.98e-04 | 67 |
| GO:00320914 | Liver | Cirrhotic | negative regulation of protein binding | 40/4634 | 94/18723 | 1.14e-04 | 1.14e-03 | 40 |
| GO:000651511 | Liver | Cirrhotic | protein quality control for misfolded or incompletely synthesized proteins | 16/4634 | 28/18723 | 2.53e-04 | 2.27e-03 | 16 |
| Page: 1 2 3 4 5 6 7 8 9 10 11 12 13 14 15 16 17 18 19 20 21 22 23 24 25 26 27 28 29 30 31 32 33 34 35 36 37 38 39 40 41 42 43 44 |
| Pathway ID | Tissue | Disease Stage | Description | Gene Ratio | Bg Ratio | pvalue | p.adjust | qvalue | Count |
| hsa0414118 | Breast | Precancer | Protein processing in endoplasmic reticulum | 33/684 | 174/8465 | 2.78e-06 | 3.83e-05 | 2.94e-05 | 33 |
| hsa0414119 | Breast | Precancer | Protein processing in endoplasmic reticulum | 33/684 | 174/8465 | 2.78e-06 | 3.83e-05 | 2.94e-05 | 33 |
| hsa0414124 | Breast | IDC | Protein processing in endoplasmic reticulum | 36/867 | 174/8465 | 2.73e-05 | 2.86e-04 | 2.14e-04 | 36 |
| hsa0414134 | Breast | IDC | Protein processing in endoplasmic reticulum | 36/867 | 174/8465 | 2.73e-05 | 2.86e-04 | 2.14e-04 | 36 |
| hsa0414143 | Breast | DCIS | Protein processing in endoplasmic reticulum | 36/846 | 174/8465 | 1.60e-05 | 1.91e-04 | 1.41e-04 | 36 |
| hsa0414153 | Breast | DCIS | Protein processing in endoplasmic reticulum | 36/846 | 174/8465 | 1.60e-05 | 1.91e-04 | 1.41e-04 | 36 |
| hsa0414126 | Endometrium | AEH | Protein processing in endoplasmic reticulum | 62/1197 | 174/8465 | 5.97e-13 | 1.39e-11 | 1.01e-11 | 62 |
| hsa0412016 | Endometrium | AEH | Ubiquitin mediated proteolysis | 41/1197 | 142/8465 | 3.42e-06 | 4.27e-05 | 3.13e-05 | 41 |
| hsa04141111 | Endometrium | AEH | Protein processing in endoplasmic reticulum | 62/1197 | 174/8465 | 5.97e-13 | 1.39e-11 | 1.01e-11 | 62 |
| hsa0412017 | Endometrium | AEH | Ubiquitin mediated proteolysis | 41/1197 | 142/8465 | 3.42e-06 | 4.27e-05 | 3.13e-05 | 41 |
| hsa0414127 | Endometrium | EEC | Protein processing in endoplasmic reticulum | 64/1237 | 174/8465 | 2.17e-13 | 5.09e-12 | 3.80e-12 | 64 |
| hsa0412023 | Endometrium | EEC | Ubiquitin mediated proteolysis | 41/1237 | 142/8465 | 7.86e-06 | 9.58e-05 | 7.14e-05 | 41 |
| hsa0414136 | Endometrium | EEC | Protein processing in endoplasmic reticulum | 64/1237 | 174/8465 | 2.17e-13 | 5.09e-12 | 3.80e-12 | 64 |
| hsa0412033 | Endometrium | EEC | Ubiquitin mediated proteolysis | 41/1237 | 142/8465 | 7.86e-06 | 9.58e-05 | 7.14e-05 | 41 |
| hsa04141211 | Esophagus | ESCC | Protein processing in endoplasmic reticulum | 147/4205 | 174/8465 | 3.29e-22 | 1.10e-19 | 5.64e-20 | 147 |
| hsa0412027 | Esophagus | ESCC | Ubiquitin mediated proteolysis | 122/4205 | 142/8465 | 6.53e-20 | 7.29e-18 | 3.74e-18 | 122 |
| hsa04141310 | Esophagus | ESCC | Protein processing in endoplasmic reticulum | 147/4205 | 174/8465 | 3.29e-22 | 1.10e-19 | 5.64e-20 | 147 |
| hsa0412036 | Esophagus | ESCC | Ubiquitin mediated proteolysis | 122/4205 | 142/8465 | 6.53e-20 | 7.29e-18 | 3.74e-18 | 122 |
| hsa0414114 | Liver | Cirrhotic | Protein processing in endoplasmic reticulum | 114/2530 | 174/8465 | 1.16e-22 | 9.67e-21 | 5.96e-21 | 114 |
| hsa0412021 | Liver | Cirrhotic | Ubiquitin mediated proteolysis | 72/2530 | 142/8465 | 1.32e-07 | 1.97e-06 | 1.21e-06 | 72 |
| Page: 1 2 3 |
Top |
Cell-cell communication analysis |
| Identification of potential cell-cell interactions between two cell types and their ligand-receptor pairs for different disease states |
| Ligand | Receptor | LRpair | Pathway | Tissue | Disease Stage |
| Page: 1 |
Top |
Single-cell gene regulatory network inference analysis |
| Find out the significant the regulons (TFs) and the target genes of each regulon across cell types for different disease states |
| TF | Cell Type | Tissue | Disease Stage | Target Gene | RSS | Regulon Activity |
| ∗The dot plots of a searched regulon are shown for all cell subpopulations in each disease state of each tissue based on the regulon specific score inferred using pySCENIC and by calculating the average expression. |
| Page: 1 |
Top |
Somatic mutation of malignant transformation related genes |
| Annotation of somatic variants for genes involved in malignant transformation |
| Hugo Symbol | Variant Class | Variant Classification | dbSNP RS | HGVSc | HGVSp | HGVSp Short | SWISSPROT | BIOTYPE | SIFT | PolyPhen | Tumor Sample Barcode | Tissue | Histology | Sex | Age | Stage | Therapy Types | Drugs | Outcome |
| STUB1 | SNV | Missense_Mutation | rs767441746 | c.658N>A | p.Glu220Lys | p.E220K | Q9UNE7 | protein_coding | deleterious(0.01) | probably_damaging(0.948) | TCGA-AC-A23H-01 | Breast | breast invasive carcinoma | Female | >=65 | I/II | Unknown | Unknown | PD |
| STUB1 | SNV | Missense_Mutation | c.239T>C | p.Leu80Pro | p.L80P | Q9UNE7 | protein_coding | tolerated(0.13) | possibly_damaging(0.905) | TCGA-AO-A12D-01 | Breast | breast invasive carcinoma | Female | <65 | I/II | Chemotherapy | cyclophosphamide | SD | |
| STUB1 | SNV | Missense_Mutation | novel | c.520N>A | p.Glu174Lys | p.E174K | Q9UNE7 | protein_coding | tolerated(0.12) | benign(0.015) | TCGA-BH-A0B6-01 | Breast | breast invasive carcinoma | Female | <65 | I/II | Unknown | Unknown | SD |
| STUB1 | SNV | Missense_Mutation | novel | c.712N>C | p.Glu238Gln | p.E238Q | Q9UNE7 | protein_coding | deleterious(0.01) | probably_damaging(0.993) | TCGA-PE-A5DE-01 | Breast | breast invasive carcinoma | Female | <65 | I/II | Chemotherapy | taxotere | CR |
| STUB1 | SNV | Missense_Mutation | novel | c.412G>A | p.Ala138Thr | p.A138T | Q9UNE7 | protein_coding | tolerated(0.15) | benign(0.229) | TCGA-2W-A8YY-01 | Cervix | cervical & endocervical cancer | Female | <65 | I/II | Chemotherapy | cisplatin | CR |
| STUB1 | SNV | Missense_Mutation | c.341T>C | p.Ile114Thr | p.I114T | Q9UNE7 | protein_coding | deleterious(0) | probably_damaging(0.96) | TCGA-AD-5900-01 | Colorectum | colon adenocarcinoma | Male | >=65 | I/II | Unknown | Unknown | SD | |
| STUB1 | SNV | Missense_Mutation | c.373A>G | p.Lys125Glu | p.K125E | Q9UNE7 | protein_coding | tolerated(0.08) | possibly_damaging(0.831) | TCGA-AM-5821-01 | Colorectum | colon adenocarcinoma | Female | >=65 | I/II | Unknown | Unknown | SD | |
| STUB1 | SNV | Missense_Mutation | c.424N>A | p.Ala142Thr | p.A142T | Q9UNE7 | protein_coding | deleterious(0) | probably_damaging(0.996) | TCGA-AY-6197-01 | Colorectum | colon adenocarcinoma | Male | <65 | I/II | Unknown | Unknown | SD | |
| STUB1 | SNV | Missense_Mutation | rs11642472 | c.460N>T | p.Arg154Cys | p.R154C | Q9UNE7 | protein_coding | deleterious(0) | probably_damaging(1) | TCGA-D5-6540-01 | Colorectum | colon adenocarcinoma | Male | >=65 | I/II | Unknown | Unknown | SD |
| STUB1 | SNV | Missense_Mutation | c.766N>C | p.Asp256His | p.D256H | Q9UNE7 | protein_coding | tolerated(0.06) | possibly_damaging(0.839) | TCGA-DM-A28F-01 | Colorectum | colon adenocarcinoma | Male | >=65 | III/IV | Unknown | Unknown | SD |
| Page: 1 2 3 |
Top |
Related drugs of malignant transformation related genes |
| Identification of chemicals and drugs interact with genes involved in malignant transfromation |
| (DGIdb 4.0) |
| Entrez ID | Symbol | Category | Interaction Types | Drug Claim Name | Drug Name | PMIDs |
| Page: 1 |

Copyright 2023-Present -The University of Texas Health Science Center at Houston |