
|
|||||
|
 | |
| |
| |
| |
| |
| |
|
Gene: SELENOS |
Gene summary for SELENOS |
| Gene information | Species | Human | Gene symbol | SELENOS | Gene ID | 55829 |
| Gene name | selenoprotein S | |
| Gene Alias | AD-015 | |
| Cytomap | 15q26.3 | |
| Gene Type | protein-coding | GO ID | GO:0000271 | UniProtAcc | Q9BQE4 |
Top |
Malignant transformation analysis |
| Identification of the aberrant gene expression in precancerous and cancerous lesions by comparing the gene expression of stem-like cells in diseased tissues with normal stem cells |
| Entrez ID | Symbol | Replicates | Species | Organ | Tissue | Adj P-value | Log2FC | Malignancy |
| 55829 | SELENOS | GSM4909281 | Human | Breast | IDC | 6.44e-11 | 4.14e-01 | 0.21 |
| 55829 | SELENOS | GSM4909282 | Human | Breast | IDC | 5.25e-32 | 8.01e-01 | -0.0288 |
| 55829 | SELENOS | GSM4909285 | Human | Breast | IDC | 2.52e-03 | 1.53e-01 | 0.21 |
| 55829 | SELENOS | GSM4909286 | Human | Breast | IDC | 2.99e-05 | 1.17e-01 | 0.1081 |
| 55829 | SELENOS | GSM4909287 | Human | Breast | IDC | 1.89e-05 | 3.69e-01 | 0.2057 |
| 55829 | SELENOS | GSM4909290 | Human | Breast | IDC | 2.12e-14 | 5.36e-01 | 0.2096 |
| 55829 | SELENOS | GSM4909291 | Human | Breast | IDC | 9.81e-27 | 7.99e-01 | 0.1753 |
| 55829 | SELENOS | GSM4909292 | Human | Breast | IDC | 1.19e-07 | 7.74e-01 | 0.1236 |
| 55829 | SELENOS | GSM4909293 | Human | Breast | IDC | 1.30e-04 | 9.84e-02 | 0.1581 |
| 55829 | SELENOS | GSM4909295 | Human | Breast | IDC | 1.25e-10 | 5.84e-01 | 0.0898 |
| 55829 | SELENOS | GSM4909298 | Human | Breast | IDC | 7.72e-05 | 1.92e-01 | 0.1551 |
| 55829 | SELENOS | GSM4909304 | Human | Breast | IDC | 7.69e-05 | 2.79e-01 | 0.1636 |
| 55829 | SELENOS | GSM4909305 | Human | Breast | IDC | 2.68e-05 | 3.56e-01 | 0.0436 |
| 55829 | SELENOS | GSM4909307 | Human | Breast | IDC | 4.97e-03 | 3.55e-01 | 0.1569 |
| 55829 | SELENOS | GSM4909308 | Human | Breast | IDC | 1.38e-11 | 4.08e-01 | 0.158 |
| 55829 | SELENOS | GSM4909309 | Human | Breast | IDC | 9.07e-03 | 3.01e-01 | 0.0483 |
| 55829 | SELENOS | GSM4909311 | Human | Breast | IDC | 7.48e-16 | 1.54e-01 | 0.1534 |
| 55829 | SELENOS | GSM4909312 | Human | Breast | IDC | 1.47e-08 | 4.59e-01 | 0.1552 |
| 55829 | SELENOS | GSM4909317 | Human | Breast | IDC | 2.23e-08 | 3.54e-01 | 0.1355 |
| 55829 | SELENOS | GSM4909319 | Human | Breast | IDC | 3.32e-19 | 1.12e-01 | 0.1563 |
| Page: 1 2 3 4 5 6 7 8 9 |
| Tissue | Expression Dynamics | Abbreviation |
| Breast | 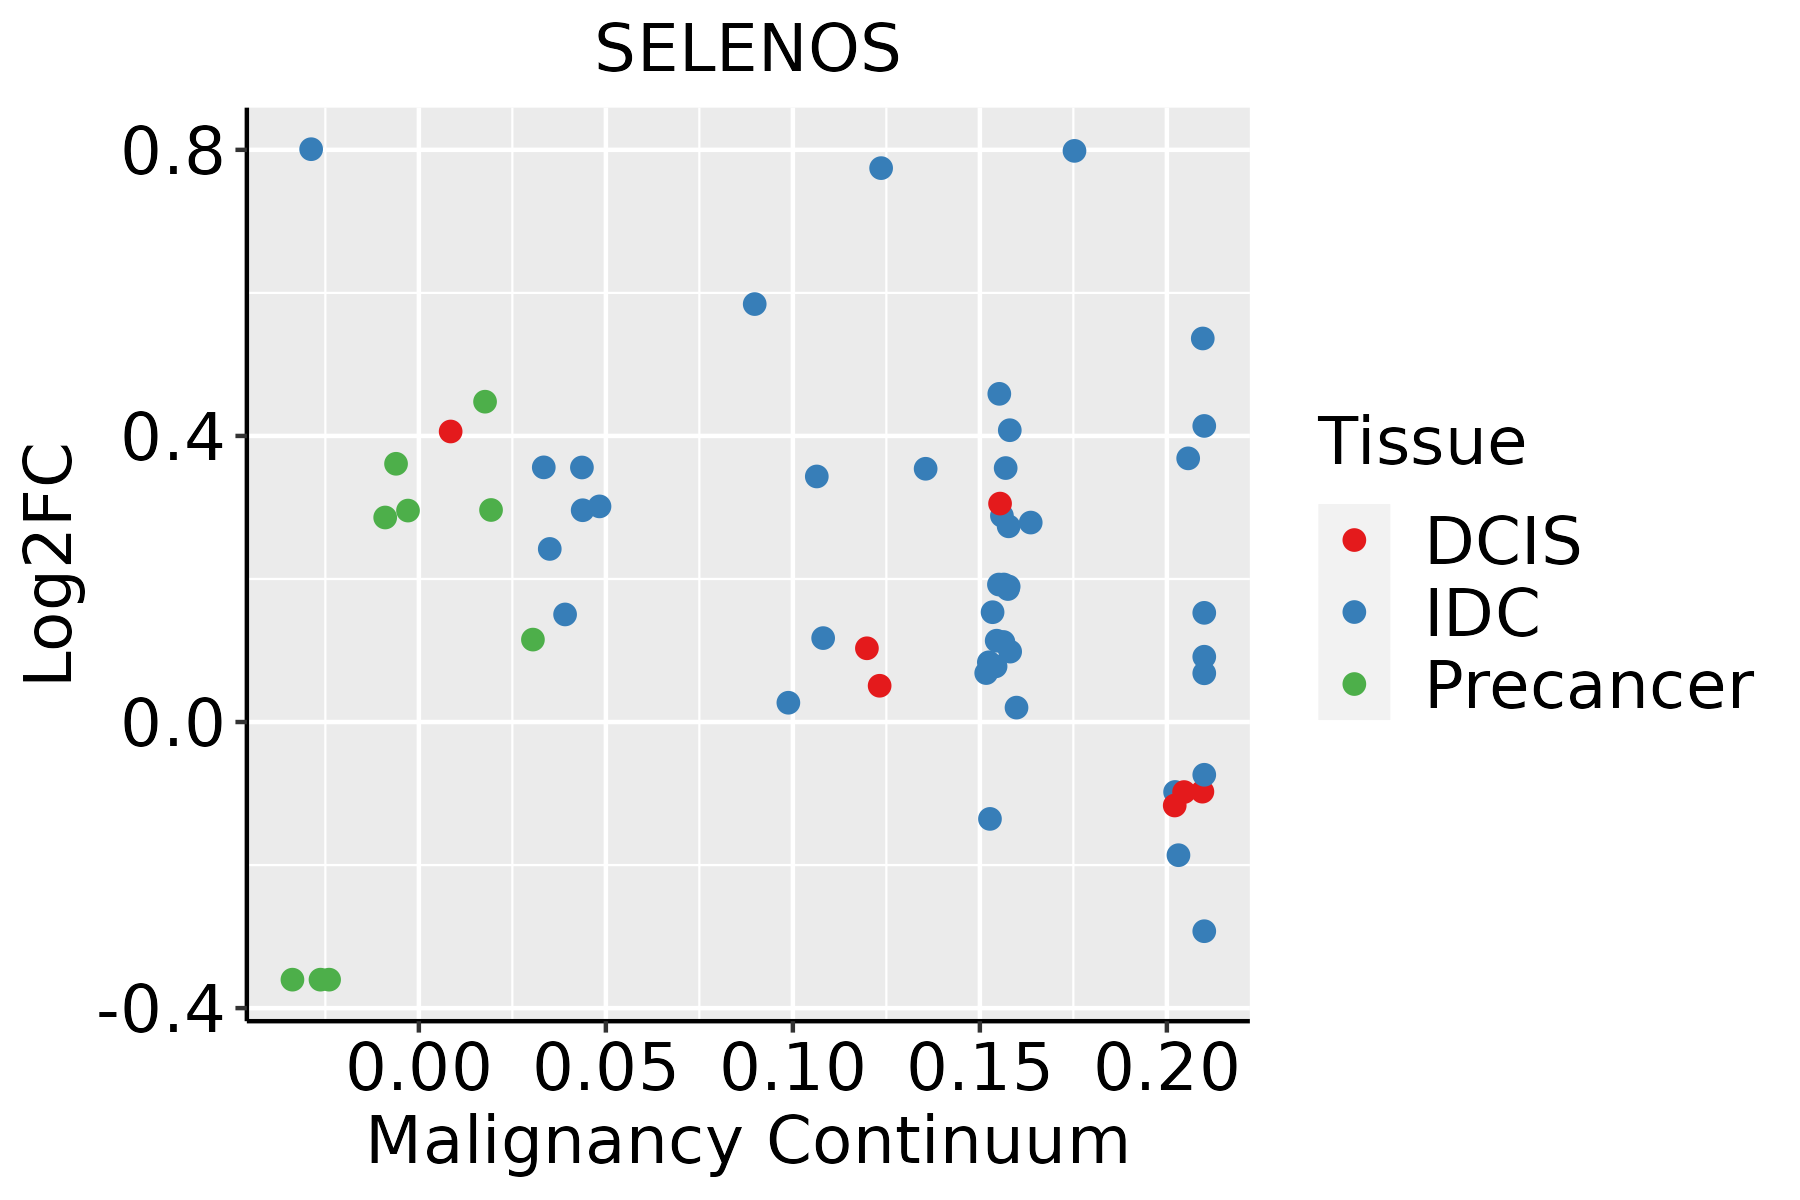 | IDC: Invasive ductal carcinoma |
| DCIS: Ductal carcinoma in situ | ||
| Precancer(BRCA1-mut): Precancerous lesion from BRCA1 mutation carriers | ||
| Cervix | 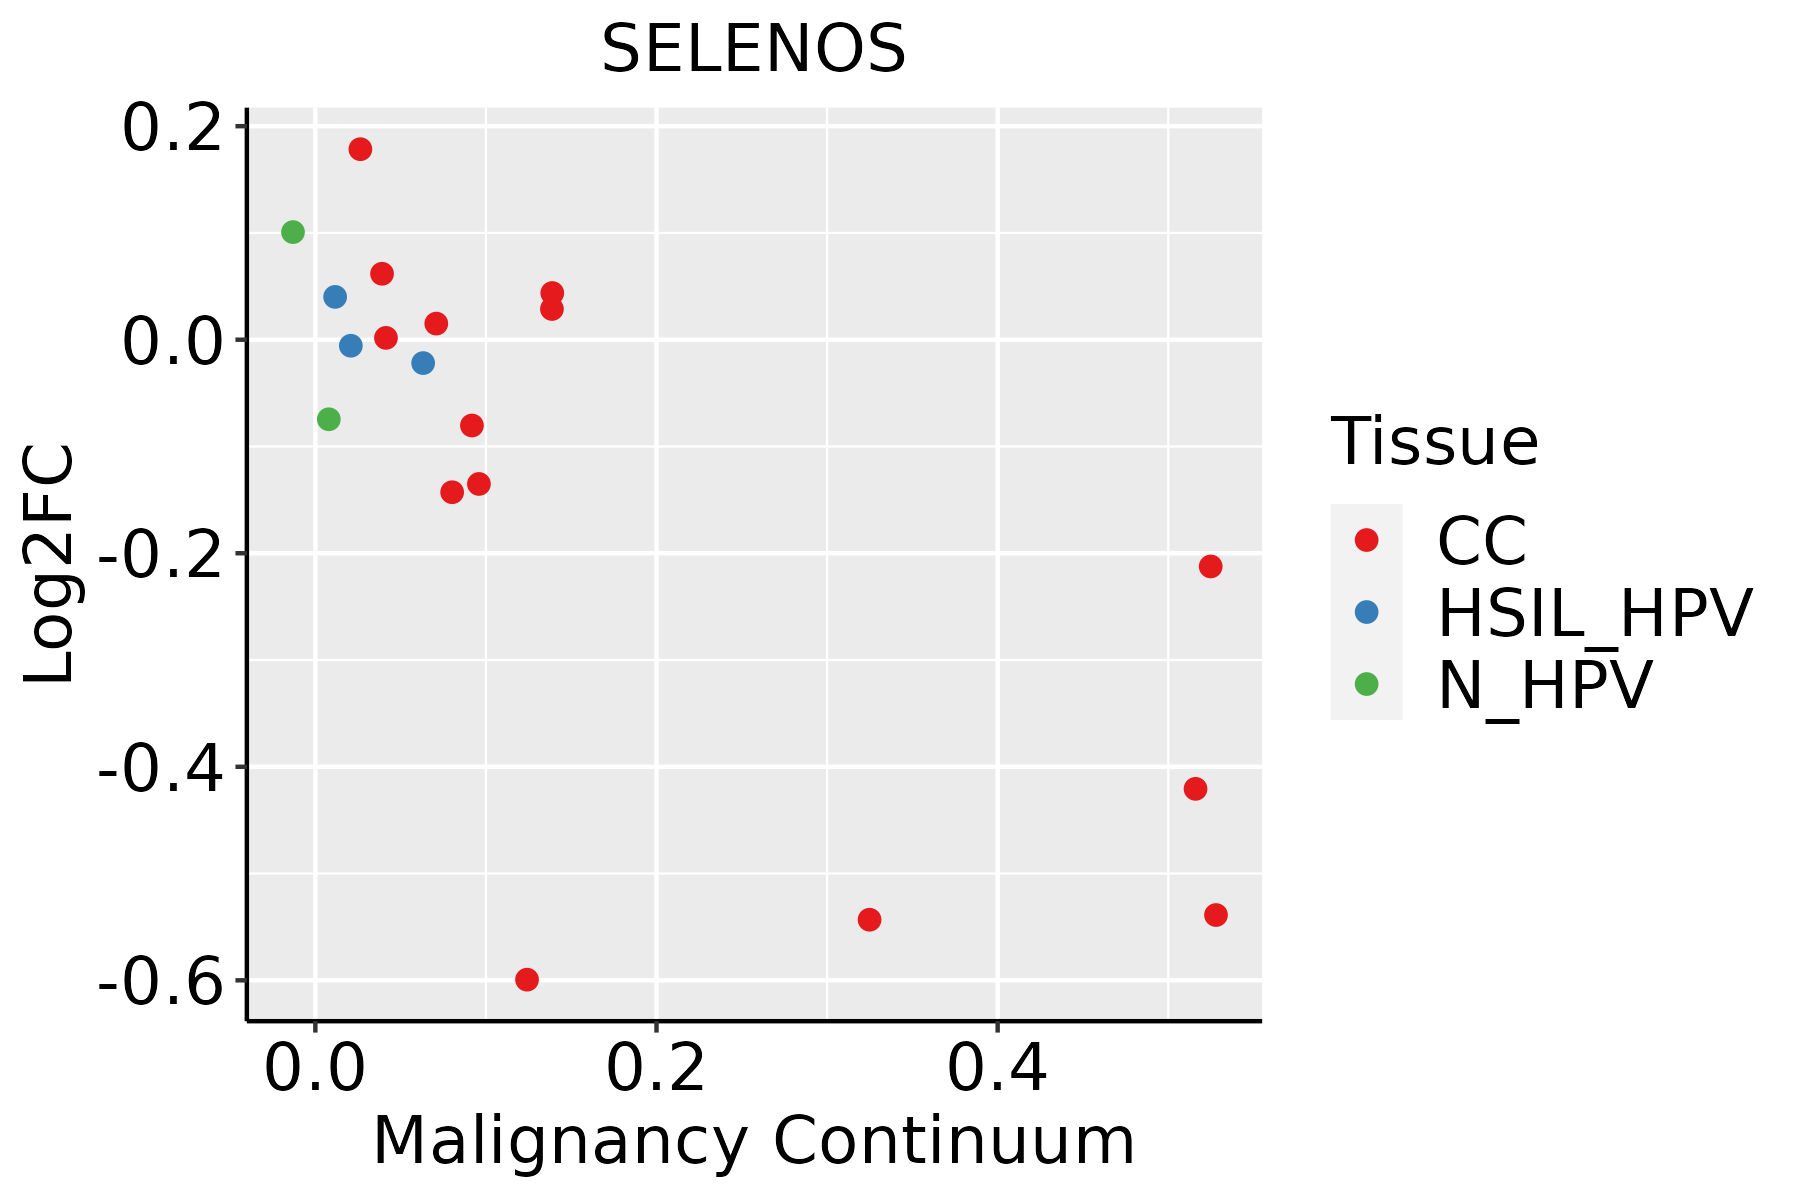 | CC: Cervix cancer |
| HSIL_HPV: HPV-infected high-grade squamous intraepithelial lesions | ||
| N_HPV: HPV-infected normal cervix | ||
| Colorectum (GSE201348) |  | FAP: Familial adenomatous polyposis |
| CRC: Colorectal cancer | ||
| Colorectum (HTA11) |  | AD: Adenomas |
| SER: Sessile serrated lesions | ||
| MSI-H: Microsatellite-high colorectal cancer | ||
| MSS: Microsatellite stable colorectal cancer | ||
| Endometrium | 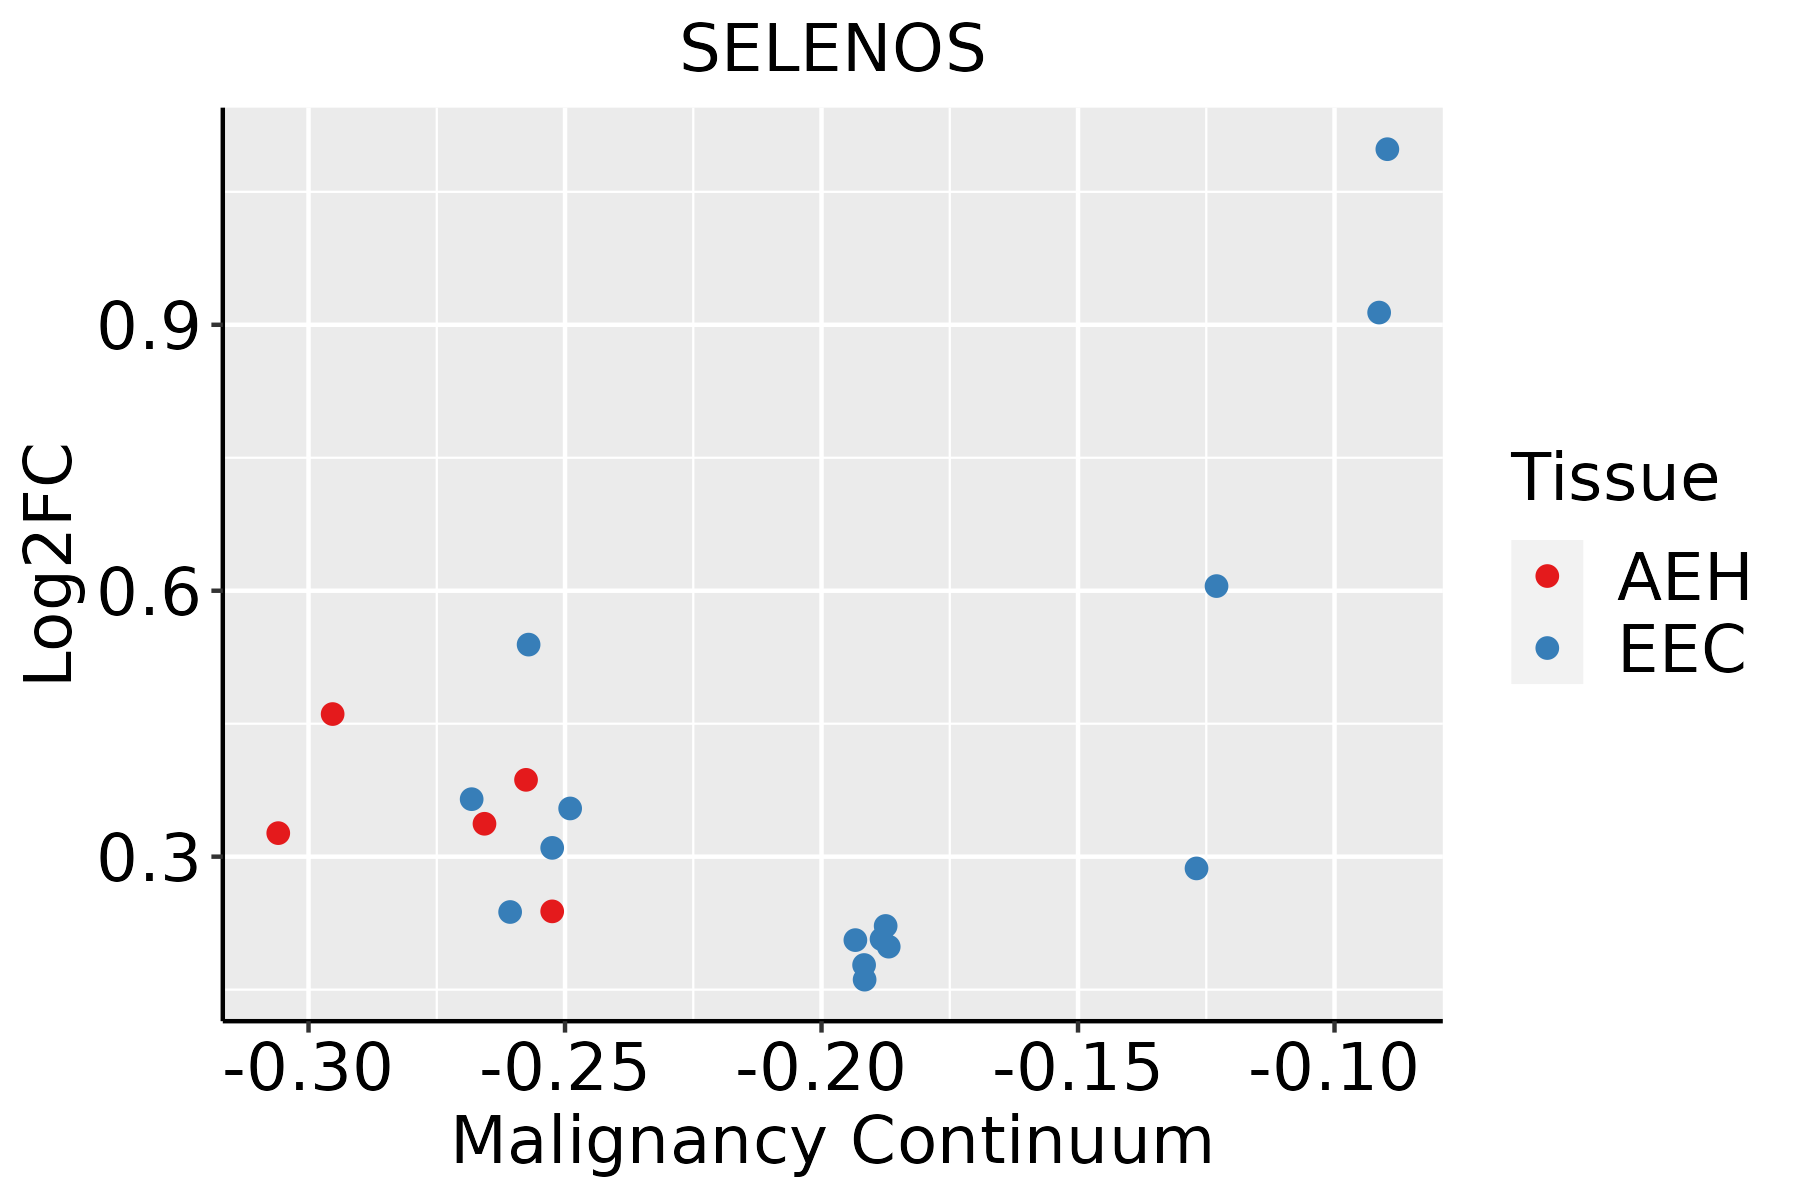 | AEH: Atypical endometrial hyperplasia |
| EEC: Endometrioid Cancer | ||
| Esophagus |  | ESCC: Esophageal squamous cell carcinoma |
| HGIN: High-grade intraepithelial neoplasias | ||
| LGIN: Low-grade intraepithelial neoplasias | ||
| GC |  | CAG: Chronic atrophic gastritis |
| CAG with IM: Chronic atrophic gastritis with intestinal metaplasia | ||
| CSG: Chronic superficial gastritis | ||
| GC: Gastric cancer | ||
| SIM: Severe intestinal metaplasia | ||
| WIM: Wild intestinal metaplasia | ||
| Liver | 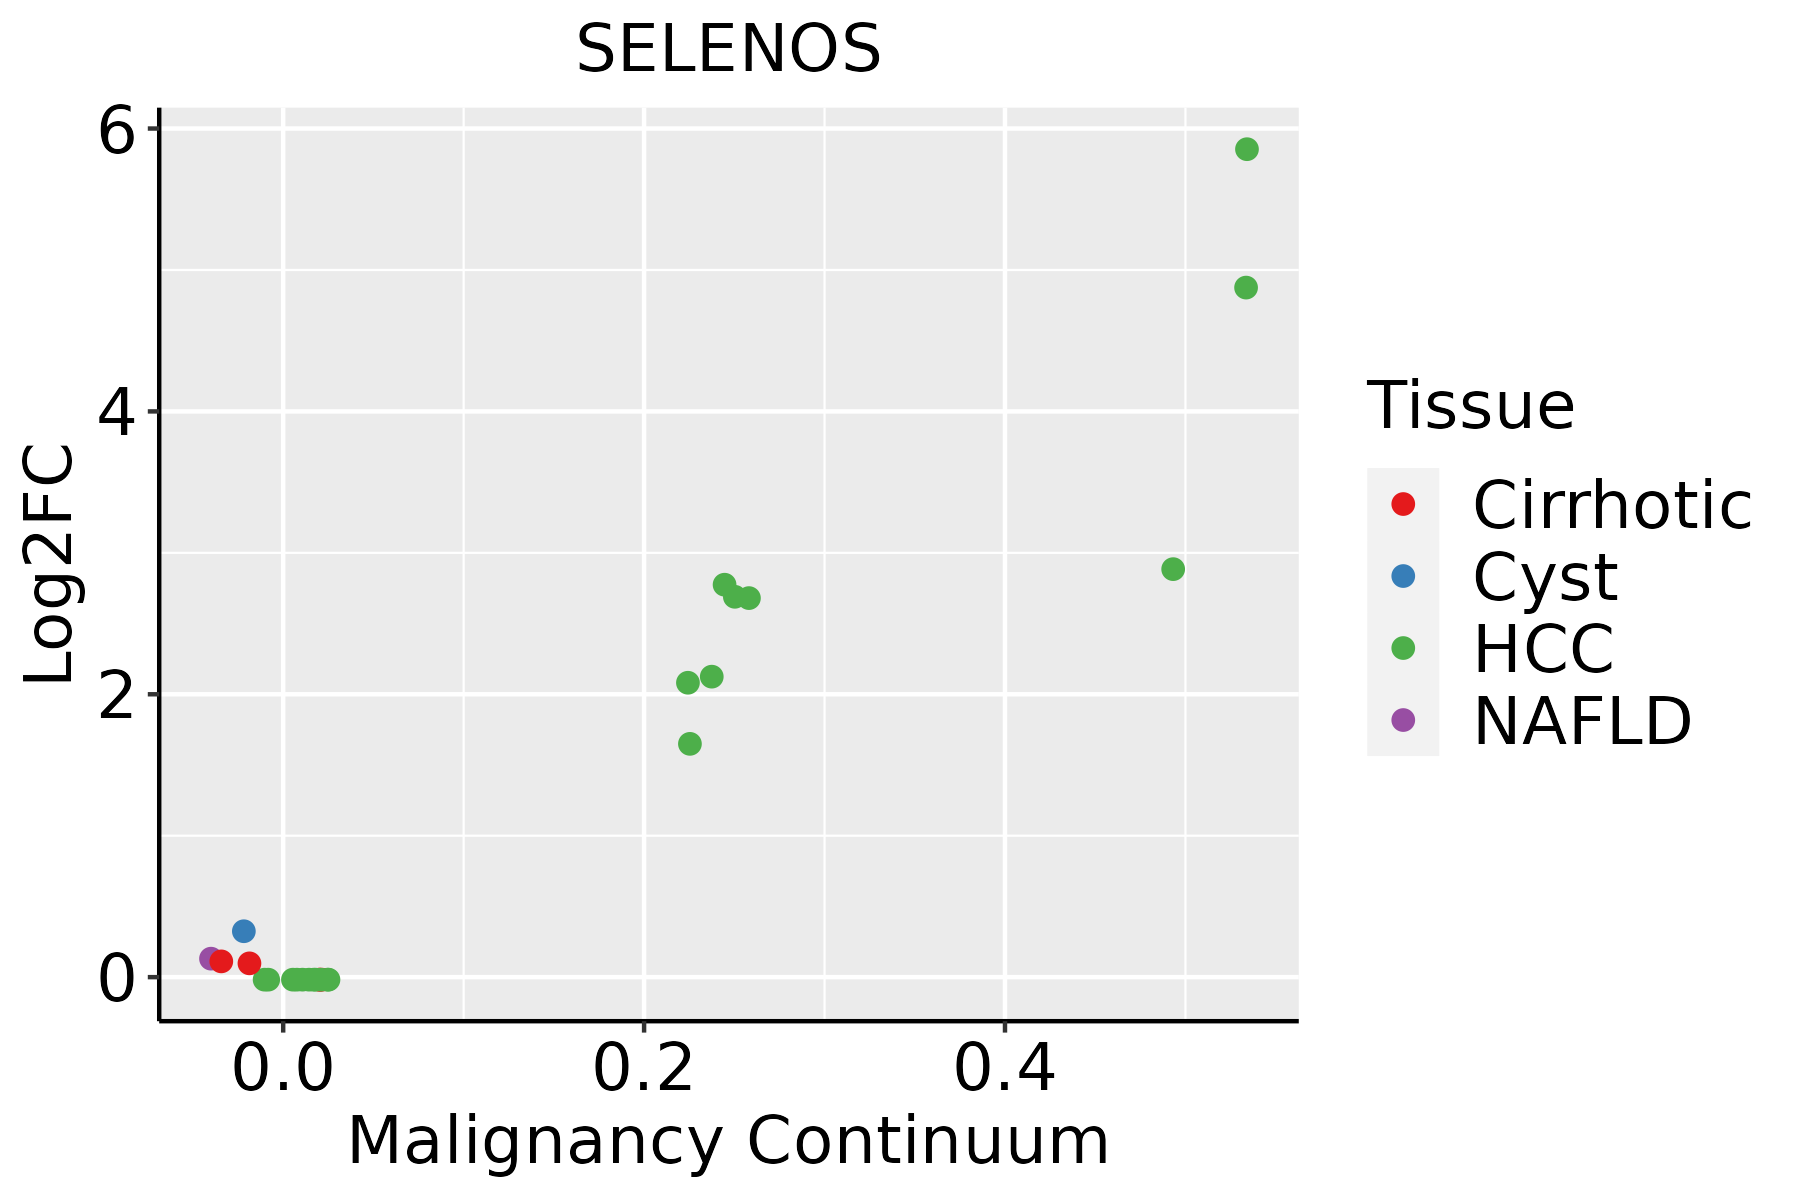 | HCC: Hepatocellular carcinoma |
| NAFLD: Non-alcoholic fatty liver disease | ||
| Prostate | 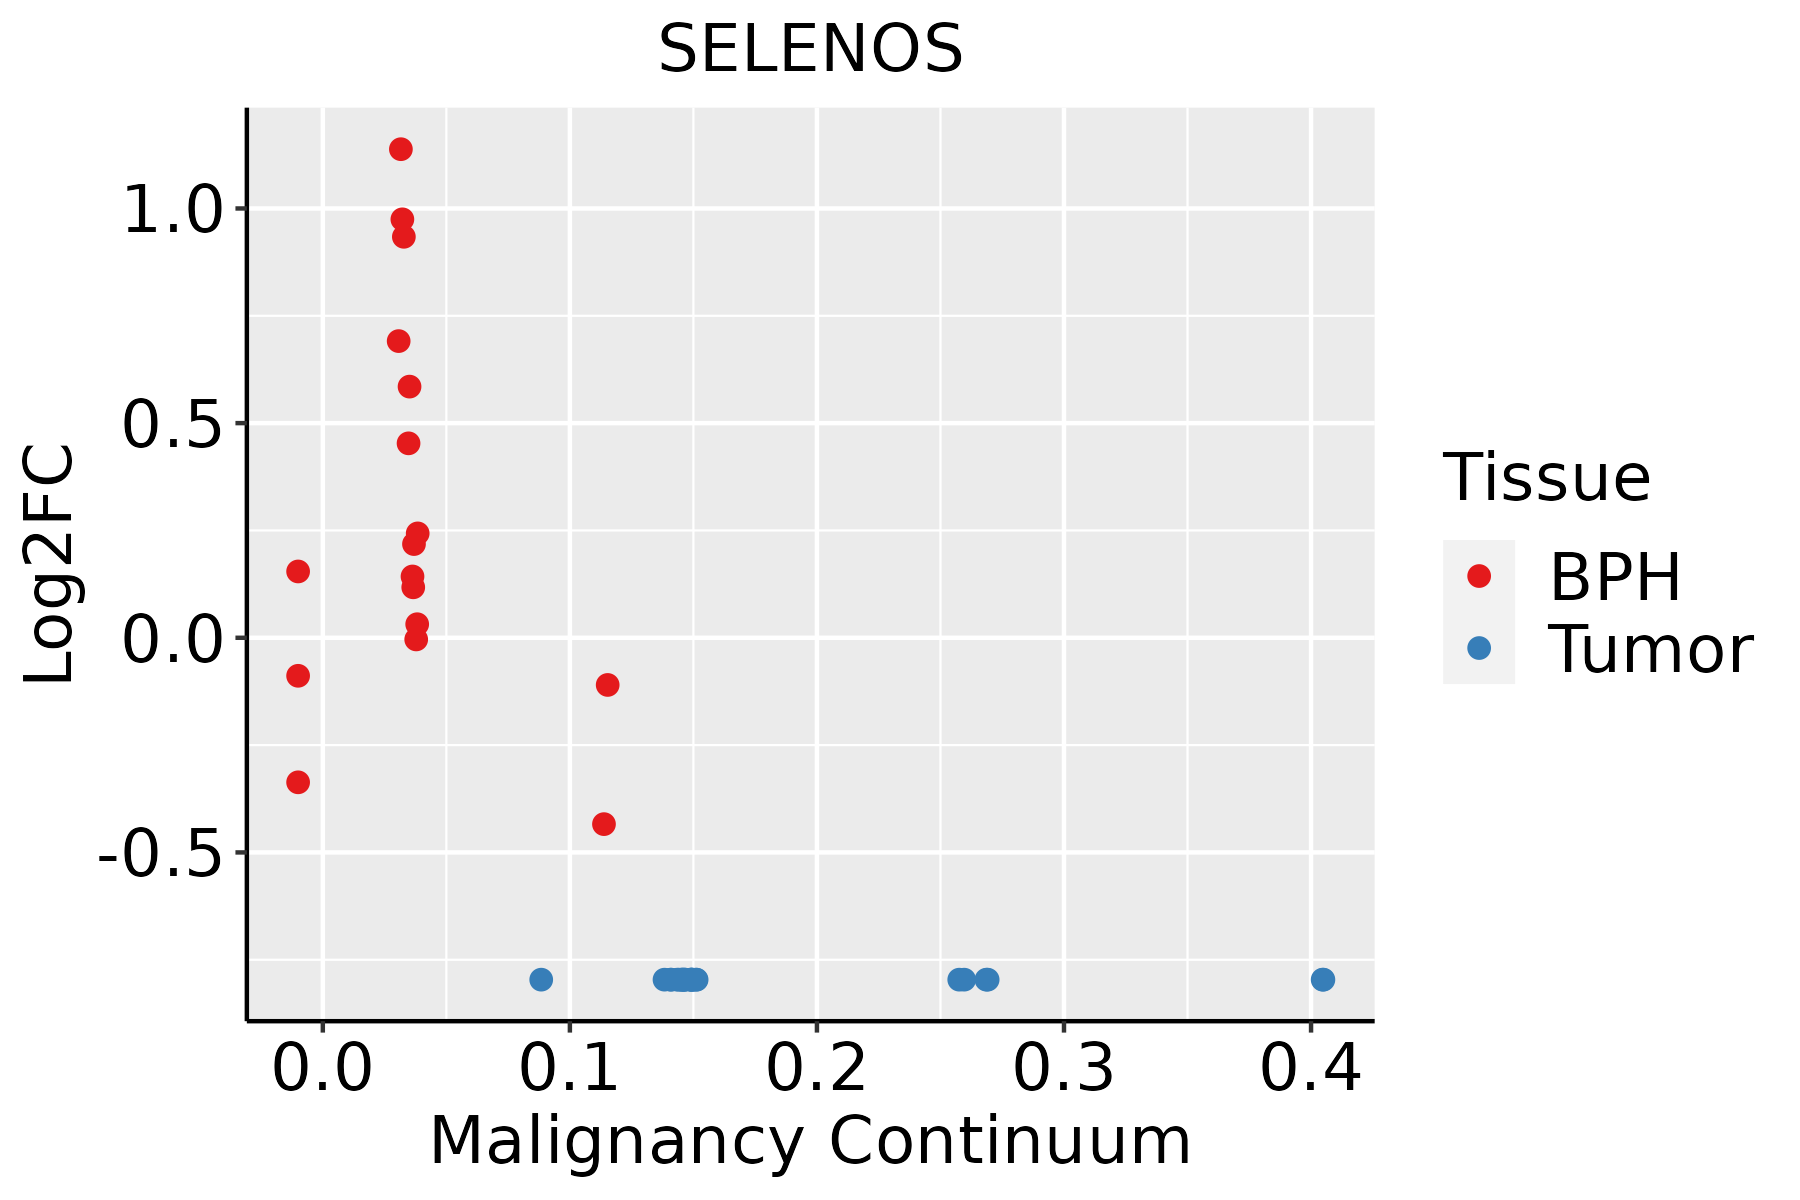 | BPH: Benign Prostatic Hyperplasia |
| Thyroid | 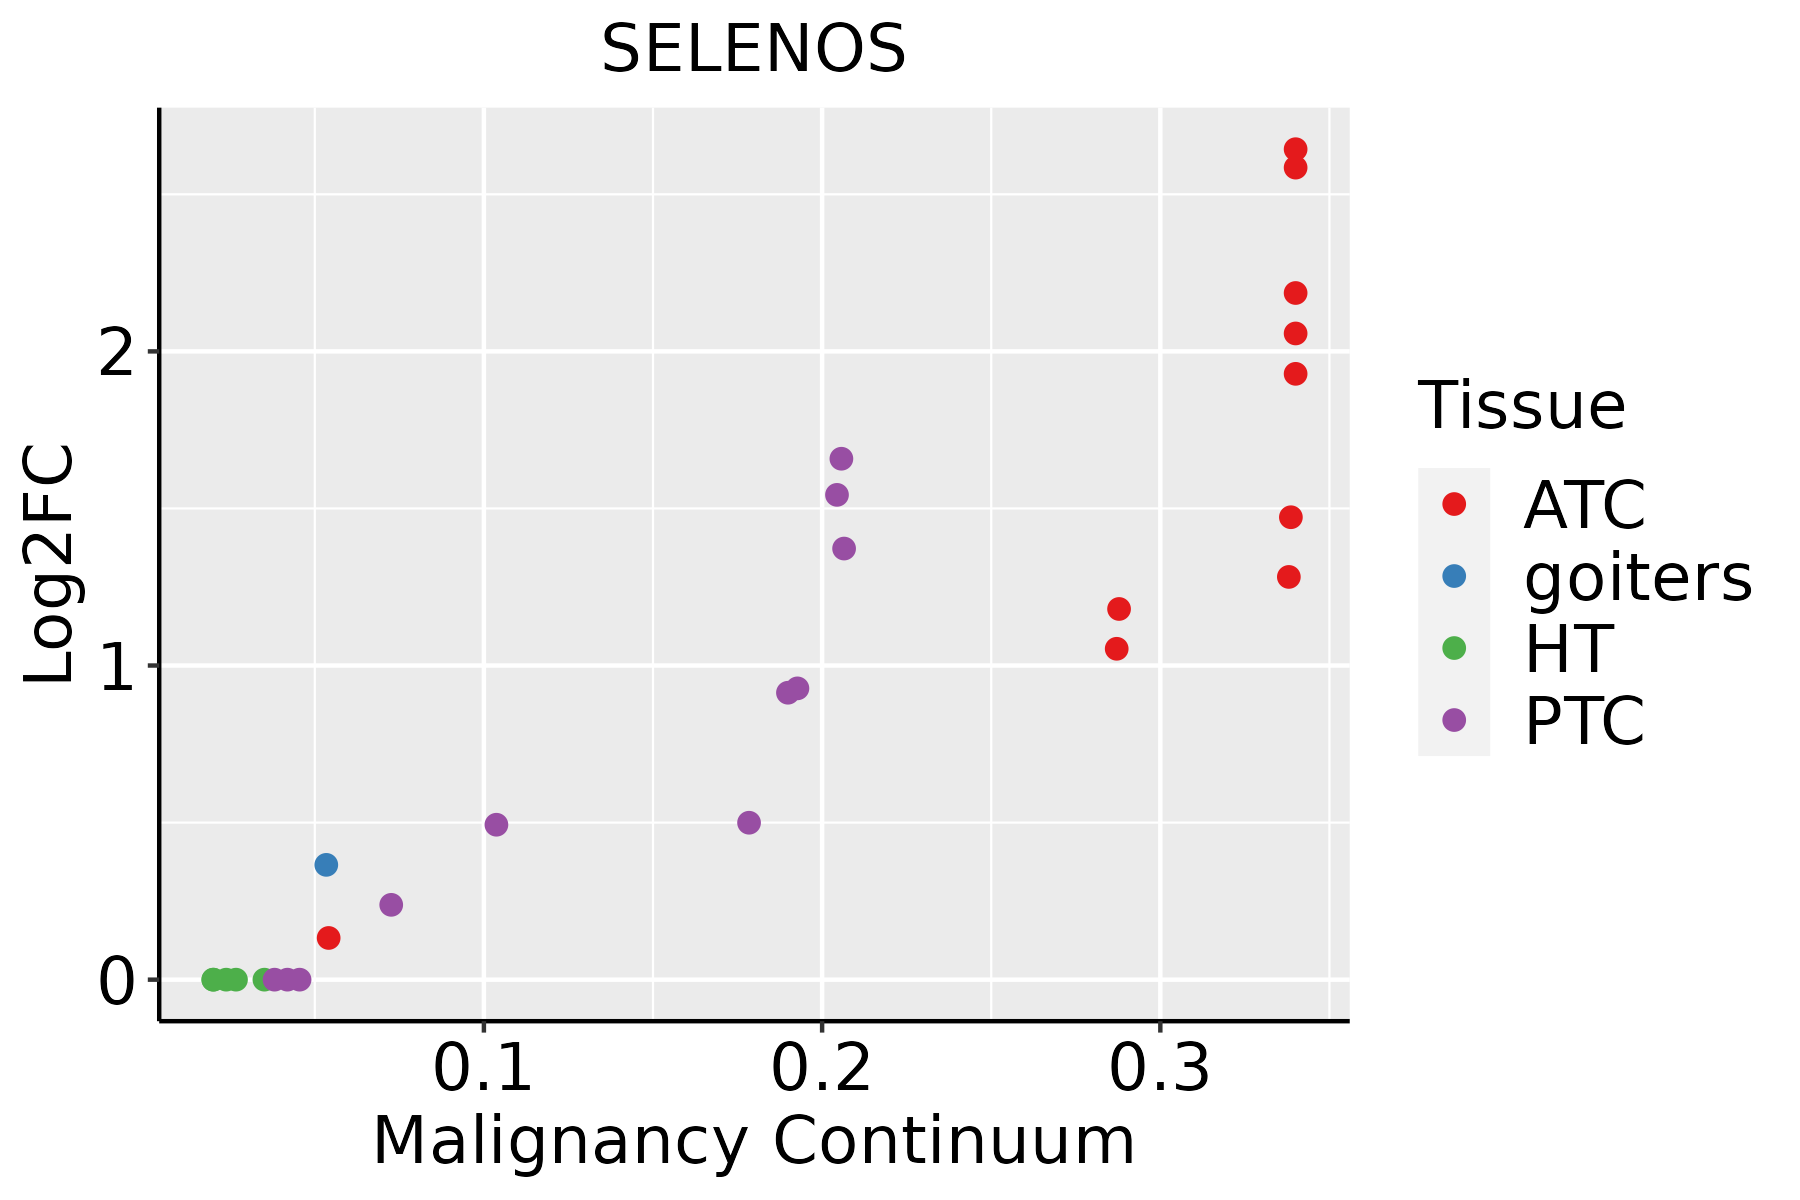 | ATC: Anaplastic thyroid cancer |
| HT: Hashimoto's thyroiditis | ||
| PTC: Papillary thyroid cancer |
| ∗log2FC in expression of this searched gene in stem-like cells from each diseased tissue sample relative to stem-like cells in normal samples in each tissue plotted against the malignancy continuum. Samples are colored based on if they are from different disease stage. |
Top |
Malignant transformation related pathway analysis |
| Find out the enriched GO biological processes and KEGG pathways involved in transition from healthy to precancer to cancer |
| Tissue | Disease Stage | Enriched GO biological Processes |
| Colorectum | AD |  |
| Colorectum | SER |  |
| Colorectum | MSS |  |
| Colorectum | MSI-H |  |
| Colorectum | FAP |  |
| ∗Top 15 enriched GO BP terms are showed in the bar plot of each disease state in each tissue. Each row represents a significant GO biological process which is colored according to the -log10(p.adjust). |
| Page: 1 2 3 4 5 6 7 8 9 |
| GO ID | Tissue | Disease Stage | Description | Gene Ratio | Bg Ratio | pvalue | p.adjust | Count |
| GO:19907482 | Colorectum | MSS | cellular detoxification | 34/3467 | 116/18723 | 3.08e-03 | 2.34e-02 | 34 |
| GO:00510511 | Colorectum | MSS | negative regulation of transport | 110/3467 | 470/18723 | 4.20e-03 | 3.04e-02 | 110 |
| GO:0006983 | Colorectum | MSS | ER overload response | 7/3467 | 13/18723 | 4.46e-03 | 3.15e-02 | 7 |
| GO:00060062 | Colorectum | MSS | glucose metabolic process | 51/3467 | 196/18723 | 5.67e-03 | 3.85e-02 | 51 |
| GO:00061091 | Colorectum | MSS | regulation of carbohydrate metabolic process | 47/3467 | 178/18723 | 5.75e-03 | 3.90e-02 | 47 |
| GO:00987542 | Colorectum | MSS | detoxification | 41/3467 | 152/18723 | 6.41e-03 | 4.27e-02 | 41 |
| GO:00454541 | Colorectum | MSS | cell redox homeostasis | 13/3467 | 35/18723 | 7.38e-03 | 4.68e-02 | 13 |
| GO:00060914 | Colorectum | FAP | generation of precursor metabolites and energy | 128/2622 | 490/18723 | 5.58e-13 | 4.28e-10 | 128 |
| GO:00159804 | Colorectum | FAP | energy derivation by oxidation of organic compounds | 85/2622 | 318/18723 | 1.36e-09 | 2.77e-07 | 85 |
| GO:00434343 | Colorectum | FAP | response to peptide hormone | 100/2622 | 414/18723 | 1.74e-08 | 1.84e-06 | 100 |
| GO:19016533 | Colorectum | FAP | cellular response to peptide | 89/2622 | 359/18723 | 2.93e-08 | 2.64e-06 | 89 |
| GO:00431614 | Colorectum | FAP | proteasome-mediated ubiquitin-dependent protein catabolic process | 98/2622 | 412/18723 | 5.41e-08 | 4.20e-06 | 98 |
| GO:00713753 | Colorectum | FAP | cellular response to peptide hormone stimulus | 75/2622 | 290/18723 | 5.60e-08 | 4.29e-06 | 75 |
| GO:00621974 | Colorectum | FAP | cellular response to chemical stress | 83/2622 | 337/18723 | 1.15e-07 | 7.43e-06 | 83 |
| GO:00104984 | Colorectum | FAP | proteasomal protein catabolic process | 110/2622 | 490/18723 | 2.12e-07 | 1.26e-05 | 110 |
| GO:00069794 | Colorectum | FAP | response to oxidative stress | 102/2622 | 446/18723 | 2.29e-07 | 1.33e-05 | 102 |
| GO:00328683 | Colorectum | FAP | response to insulin | 68/2622 | 264/18723 | 2.71e-07 | 1.55e-05 | 68 |
| GO:00328693 | Colorectum | FAP | cellular response to insulin stimulus | 54/2622 | 203/18723 | 1.54e-06 | 6.59e-05 | 54 |
| GO:00097434 | Colorectum | FAP | response to carbohydrate | 63/2622 | 253/18723 | 2.52e-06 | 9.77e-05 | 63 |
| GO:00345994 | Colorectum | FAP | cellular response to oxidative stress | 69/2622 | 288/18723 | 3.72e-06 | 1.29e-04 | 69 |
| Page: 1 2 3 4 5 6 7 8 9 10 11 12 13 14 15 16 17 18 19 20 21 22 23 24 25 26 27 28 29 30 31 32 33 34 35 36 37 38 39 40 41 42 43 44 45 46 47 48 49 50 51 52 53 54 55 56 |
| Pathway ID | Tissue | Disease Stage | Description | Gene Ratio | Bg Ratio | pvalue | p.adjust | qvalue | Count |
| hsa0414118 | Breast | Precancer | Protein processing in endoplasmic reticulum | 33/684 | 174/8465 | 2.78e-06 | 3.83e-05 | 2.94e-05 | 33 |
| hsa0414119 | Breast | Precancer | Protein processing in endoplasmic reticulum | 33/684 | 174/8465 | 2.78e-06 | 3.83e-05 | 2.94e-05 | 33 |
| hsa0414124 | Breast | IDC | Protein processing in endoplasmic reticulum | 36/867 | 174/8465 | 2.73e-05 | 2.86e-04 | 2.14e-04 | 36 |
| hsa0414134 | Breast | IDC | Protein processing in endoplasmic reticulum | 36/867 | 174/8465 | 2.73e-05 | 2.86e-04 | 2.14e-04 | 36 |
| hsa0414143 | Breast | DCIS | Protein processing in endoplasmic reticulum | 36/846 | 174/8465 | 1.60e-05 | 1.91e-04 | 1.41e-04 | 36 |
| hsa0414153 | Breast | DCIS | Protein processing in endoplasmic reticulum | 36/846 | 174/8465 | 1.60e-05 | 1.91e-04 | 1.41e-04 | 36 |
| hsa0414120 | Cervix | CC | Protein processing in endoplasmic reticulum | 55/1267 | 174/8465 | 1.74e-08 | 2.68e-07 | 1.58e-07 | 55 |
| hsa04141110 | Cervix | CC | Protein processing in endoplasmic reticulum | 55/1267 | 174/8465 | 1.74e-08 | 2.68e-07 | 1.58e-07 | 55 |
| hsa04141 | Colorectum | AD | Protein processing in endoplasmic reticulum | 80/2092 | 174/8465 | 5.96e-10 | 1.25e-08 | 7.96e-09 | 80 |
| hsa041411 | Colorectum | AD | Protein processing in endoplasmic reticulum | 80/2092 | 174/8465 | 5.96e-10 | 1.25e-08 | 7.96e-09 | 80 |
| hsa041412 | Colorectum | SER | Protein processing in endoplasmic reticulum | 60/1580 | 174/8465 | 4.20e-07 | 7.33e-06 | 5.32e-06 | 60 |
| hsa041413 | Colorectum | SER | Protein processing in endoplasmic reticulum | 60/1580 | 174/8465 | 4.20e-07 | 7.33e-06 | 5.32e-06 | 60 |
| hsa041414 | Colorectum | MSS | Protein processing in endoplasmic reticulum | 75/1875 | 174/8465 | 3.78e-10 | 8.44e-09 | 5.17e-09 | 75 |
| hsa041415 | Colorectum | MSS | Protein processing in endoplasmic reticulum | 75/1875 | 174/8465 | 3.78e-10 | 8.44e-09 | 5.17e-09 | 75 |
| hsa041418 | Colorectum | FAP | Protein processing in endoplasmic reticulum | 50/1404 | 174/8465 | 3.64e-05 | 3.68e-04 | 2.24e-04 | 50 |
| hsa041419 | Colorectum | FAP | Protein processing in endoplasmic reticulum | 50/1404 | 174/8465 | 3.64e-05 | 3.68e-04 | 2.24e-04 | 50 |
| hsa0414126 | Endometrium | AEH | Protein processing in endoplasmic reticulum | 62/1197 | 174/8465 | 5.97e-13 | 1.39e-11 | 1.01e-11 | 62 |
| hsa04141111 | Endometrium | AEH | Protein processing in endoplasmic reticulum | 62/1197 | 174/8465 | 5.97e-13 | 1.39e-11 | 1.01e-11 | 62 |
| hsa0414127 | Endometrium | EEC | Protein processing in endoplasmic reticulum | 64/1237 | 174/8465 | 2.17e-13 | 5.09e-12 | 3.80e-12 | 64 |
| hsa0414136 | Endometrium | EEC | Protein processing in endoplasmic reticulum | 64/1237 | 174/8465 | 2.17e-13 | 5.09e-12 | 3.80e-12 | 64 |
| Page: 1 2 |
Top |
Cell-cell communication analysis |
| Identification of potential cell-cell interactions between two cell types and their ligand-receptor pairs for different disease states |
| Ligand | Receptor | LRpair | Pathway | Tissue | Disease Stage |
| Page: 1 |
Top |
Single-cell gene regulatory network inference analysis |
| Find out the significant the regulons (TFs) and the target genes of each regulon across cell types for different disease states |
| TF | Cell Type | Tissue | Disease Stage | Target Gene | RSS | Regulon Activity |
| ∗The dot plots of a searched regulon are shown for all cell subpopulations in each disease state of each tissue based on the regulon specific score inferred using pySCENIC and by calculating the average expression. |
| Page: 1 |
Top |
Somatic mutation of malignant transformation related genes |
| Annotation of somatic variants for genes involved in malignant transformation |
| Hugo Symbol | Variant Class | Variant Classification | dbSNP RS | HGVSc | HGVSp | HGVSp Short | SWISSPROT | BIOTYPE | SIFT | PolyPhen | Tumor Sample Barcode | Tissue | Histology | Sex | Age | Stage | Therapy Types | Drugs | Outcome |
| SELENOS | SNV | Missense_Mutation | rs751562043 | c.539N>A | p.Arg180His | p.R180H | Q9BQE4 | protein_coding | deleterious(0) | probably_damaging(0.98) | TCGA-BH-A1FC-01 | Breast | breast invasive carcinoma | Female | >=65 | I/II | Unknown | Unknown | SD |
| SELENOS | SNV | Missense_Mutation | c.455N>T | p.Lys152Ile | p.K152I | Q9BQE4 | protein_coding | deleterious(0) | possibly_damaging(0.803) | TCGA-AA-3811-01 | Colorectum | colon adenocarcinoma | Female | >=65 | III/IV | Unknown | Unknown | PD | |
| SELENOS | SNV | Missense_Mutation | novel | c.101G>A | p.Gly34Asp | p.G34D | Q9BQE4 | protein_coding | deleterious(0) | probably_damaging(1) | TCGA-A5-A7WJ-01 | Endometrium | uterine corpus endometrioid carcinoma | Female | <65 | I/II | Unknown | Unknown | SD |
| SELENOS | SNV | Missense_Mutation | c.331N>C | p.Lys111Gln | p.K111Q | Q9BQE4 | protein_coding | deleterious(0.01) | possibly_damaging(0.602) | TCGA-AP-A059-01 | Endometrium | uterine corpus endometrioid carcinoma | Female | >=65 | I/II | Unknown | Unknown | SD | |
| SELENOS | SNV | Missense_Mutation | novel | c.221N>C | p.Val74Ala | p.V74A | Q9BQE4 | protein_coding | tolerated(0.54) | benign(0.038) | TCGA-EO-A22U-01 | Endometrium | uterine corpus endometrioid carcinoma | Female | >=65 | I/II | Unknown | Unknown | SD |
| SELENOS | SNV | Missense_Mutation | novel | c.361N>C | p.Ser121Arg | p.S121R | Q9BQE4 | protein_coding | tolerated(0.17) | benign(0.067) | TCGA-FI-A2D5-01 | Endometrium | uterine corpus endometrioid carcinoma | Female | <65 | III/IV | Chemotherapy | carboplatinum | PD |
| SELENOS | SNV | Missense_Mutation | c.328N>C | p.Glu110Gln | p.E110Q | Q9BQE4 | protein_coding | tolerated(0.24) | benign(0.006) | TCGA-55-A48Y-01 | Lung | lung adenocarcinoma | Male | >=65 | I/II | Chemotherapy | carboplatin | CR | |
| SELENOS | SNV | Missense_Mutation | novel | c.292N>C | p.Glu98Gln | p.E98Q | Q9BQE4 | protein_coding | deleterious(0.02) | possibly_damaging(0.686) | TCGA-22-1016-01 | Lung | lung squamous cell carcinoma | Male | >=65 | I/II | Unknown | Unknown | SD |
| Page: 1 |
Top |
Related drugs of malignant transformation related genes |
| Identification of chemicals and drugs interact with genes involved in malignant transfromation |
| (DGIdb 4.0) |
| Entrez ID | Symbol | Category | Interaction Types | Drug Claim Name | Drug Name | PMIDs |
| Page: 1 |

Copyright 2023-Present -The University of Texas Health Science Center at Houston |