| Tissue | Expression Dynamics | Abbreviation |
| Esophagus | 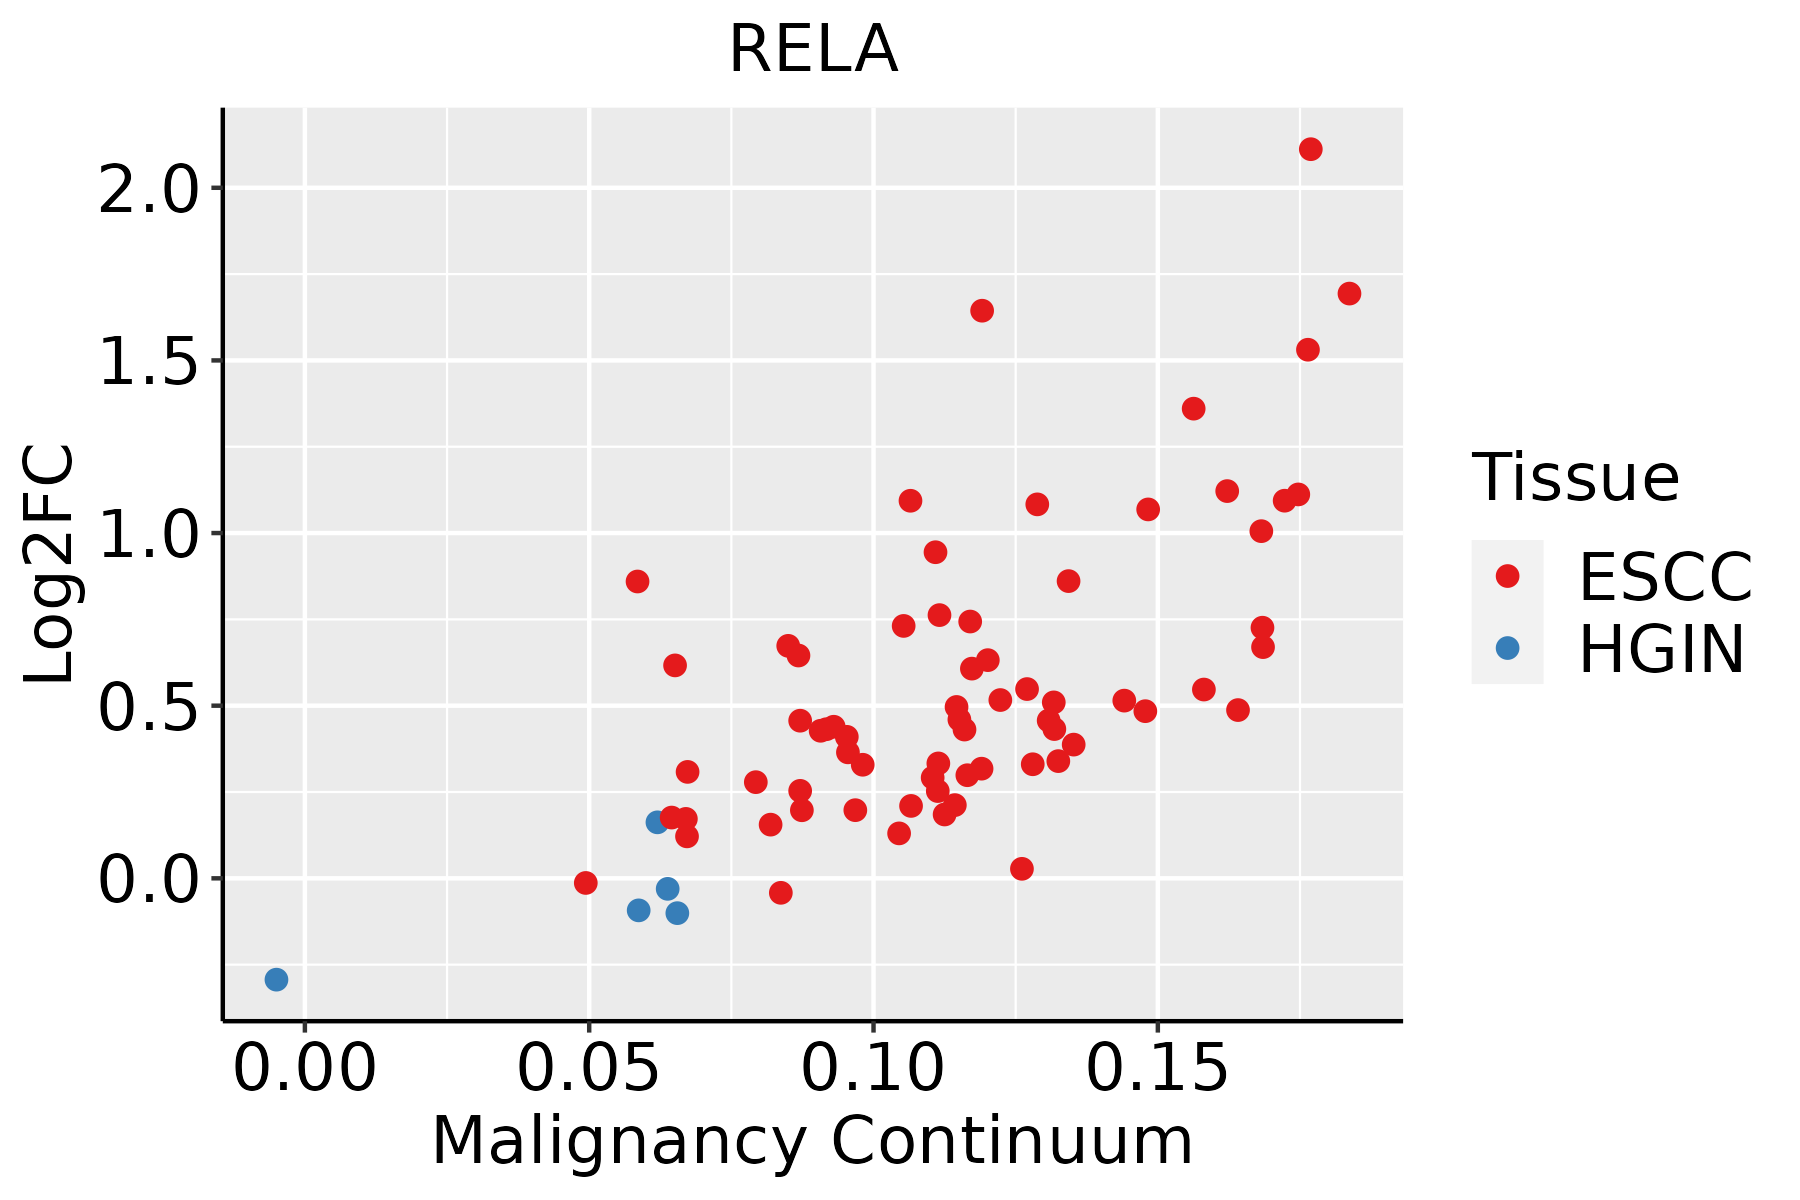 | ESCC: Esophageal squamous cell carcinoma |
| HGIN: High-grade intraepithelial neoplasias |
| LGIN: Low-grade intraepithelial neoplasias |
| Liver | 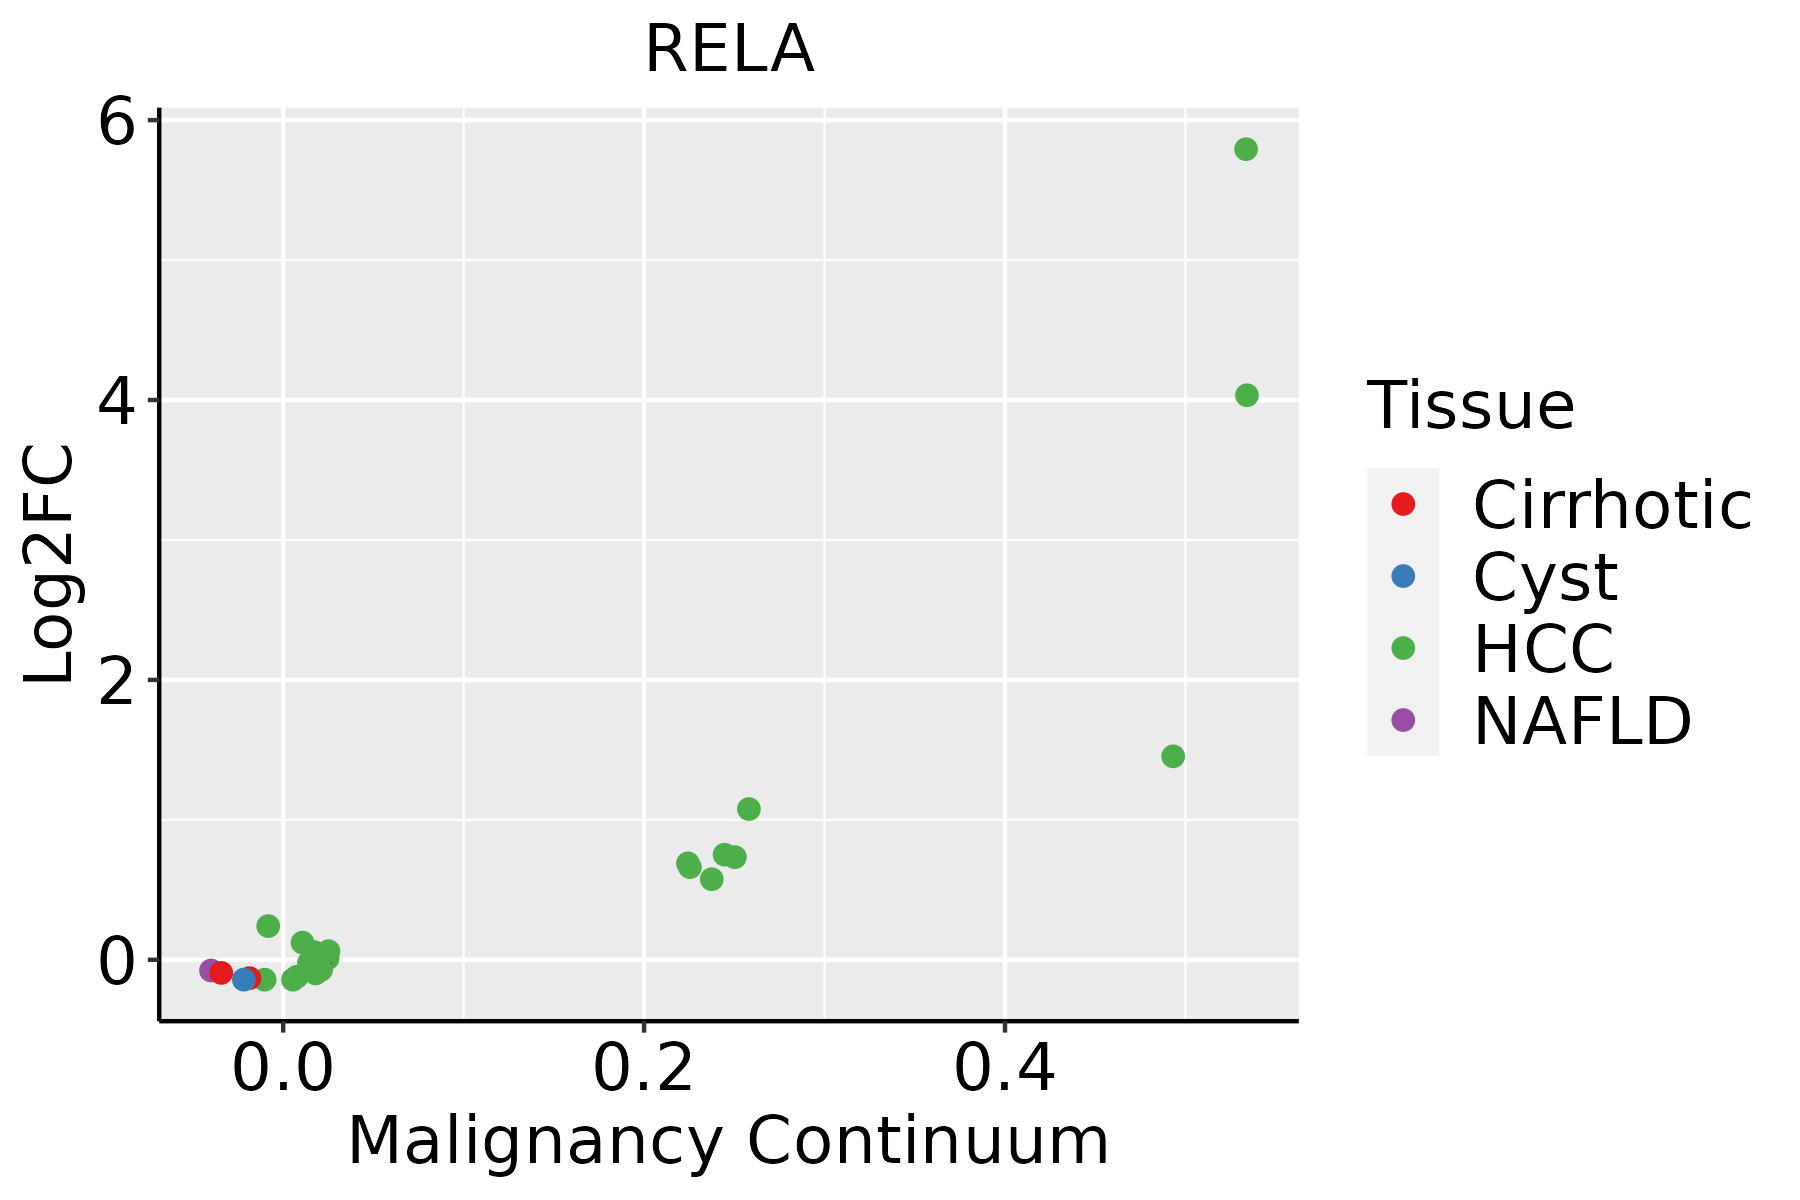 | HCC: Hepatocellular carcinoma |
| NAFLD: Non-alcoholic fatty liver disease |
| Oral Cavity | 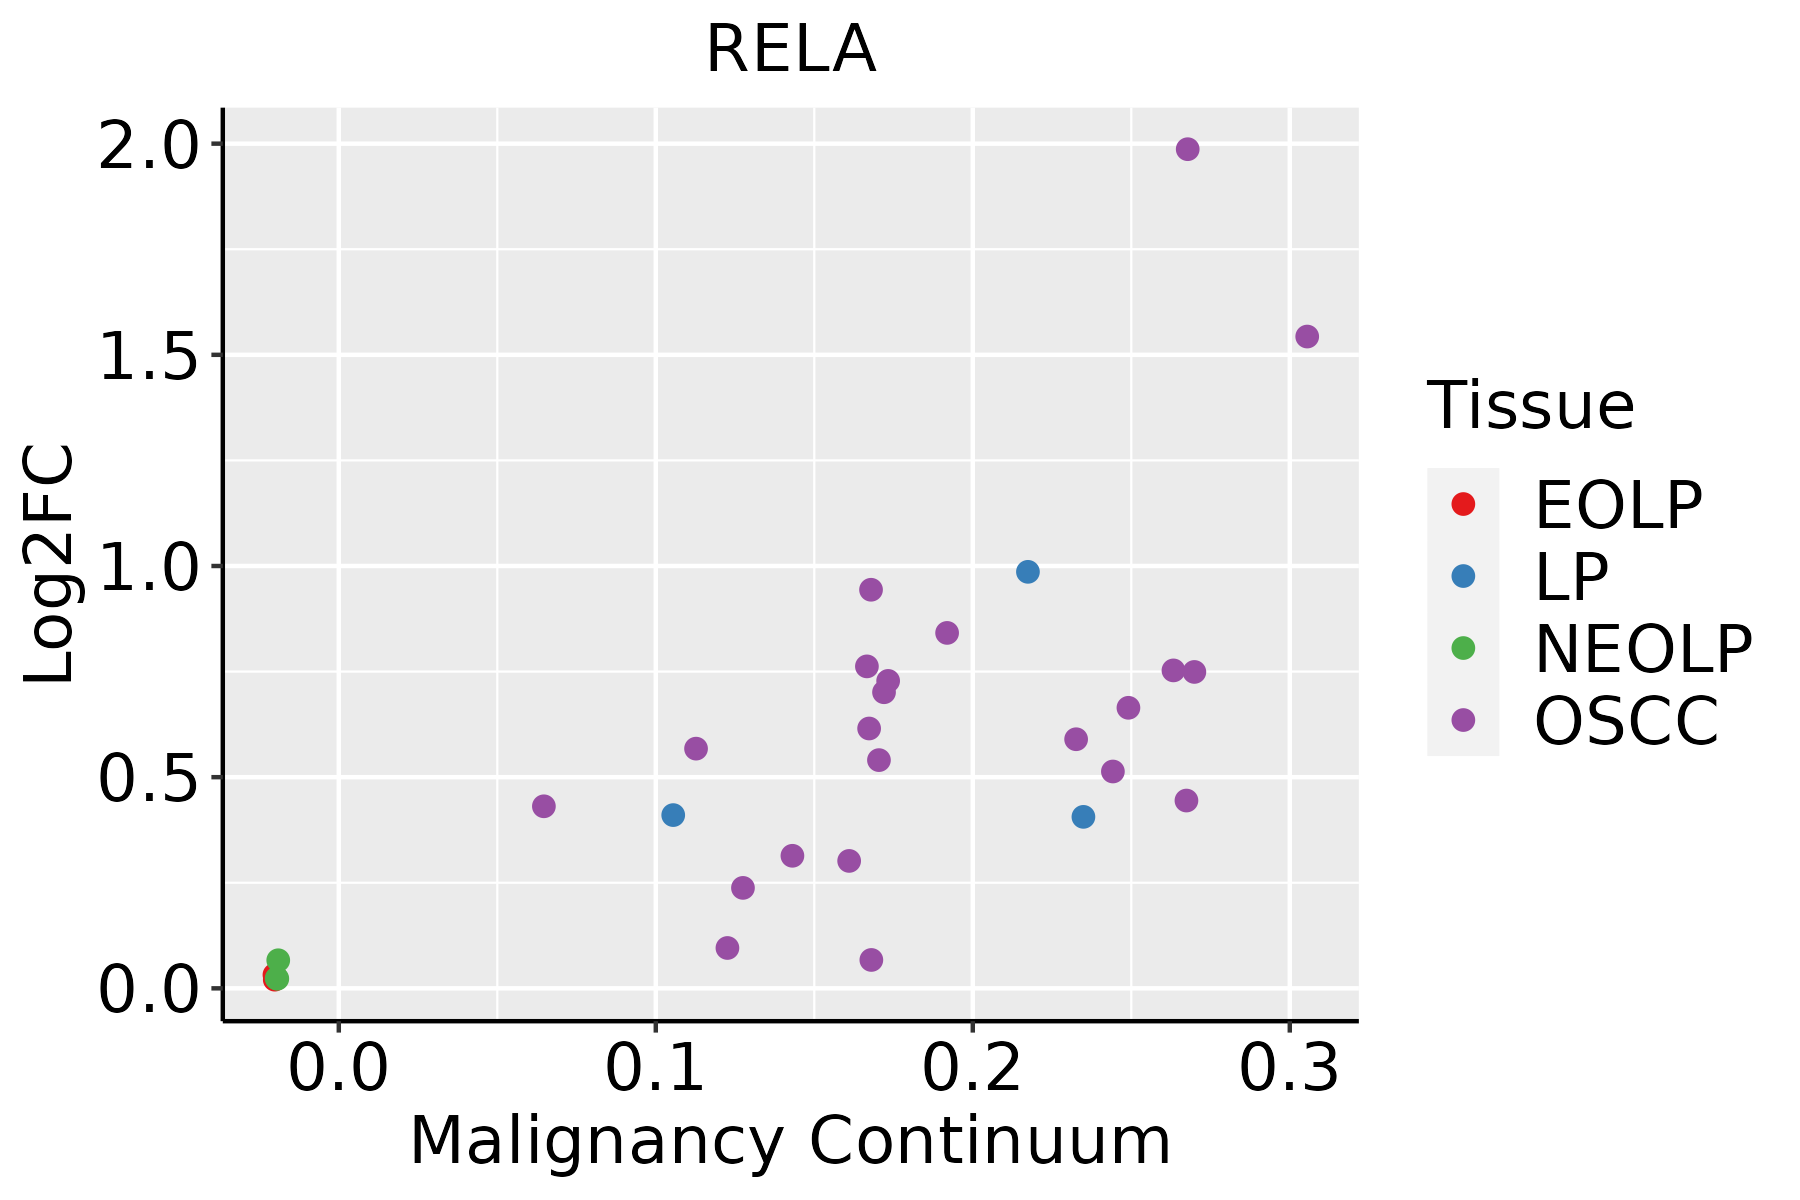 | EOLP: Erosive Oral lichen planus |
| LP: leukoplakia |
| NEOLP: Non-erosive oral lichen planus |
| OSCC: Oral squamous cell carcinoma |
| Prostate |  | BPH: Benign Prostatic Hyperplasia |
| Skin | 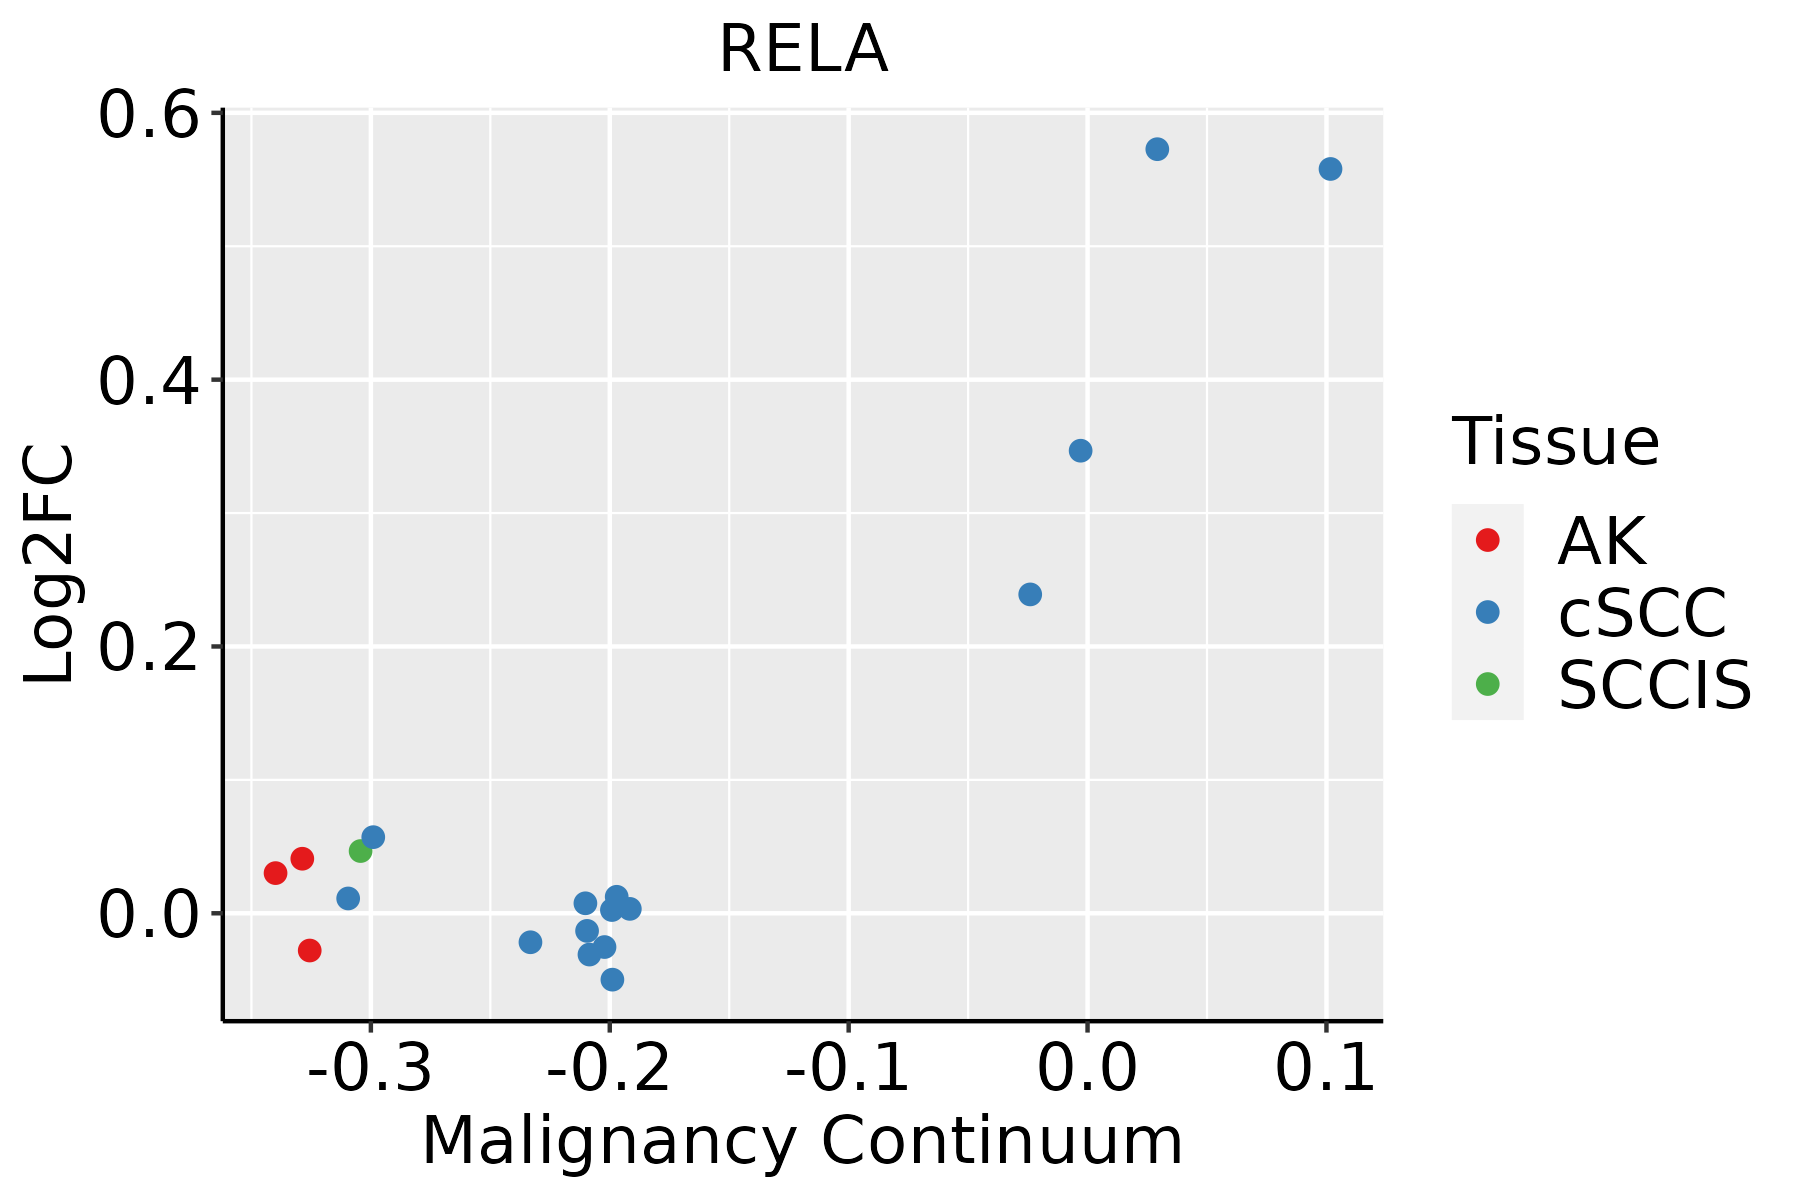 | AK: Actinic keratosis |
| cSCC: Cutaneous squamous cell carcinoma |
| SCCIS:squamous cell carcinoma in situ |
| GO ID | Tissue | Disease Stage | Description | Gene Ratio | Bg Ratio | pvalue | p.adjust | Count |
| GO:190165317 | Oral cavity | LP | cellular response to peptide | 122/4623 | 359/18723 | 4.22e-05 | 6.10e-04 | 122 |
| GO:004358816 | Oral cavity | LP | skin development | 93/4623 | 263/18723 | 6.47e-05 | 8.70e-04 | 93 |
| GO:004206313 | Oral cavity | LP | gliogenesis | 104/4623 | 301/18723 | 7.21e-05 | 9.49e-04 | 104 |
| GO:000758414 | Oral cavity | LP | response to nutrient | 65/4623 | 174/18723 | 1.31e-04 | 1.52e-03 | 65 |
| GO:007030115 | Oral cavity | LP | cellular response to hydrogen peroxide | 40/4623 | 98/18723 | 3.12e-04 | 3.17e-03 | 40 |
| GO:190122212 | Oral cavity | LP | regulation of NIK/NF-kappaB signaling | 44/4623 | 112/18723 | 4.38e-04 | 4.19e-03 | 44 |
| GO:001000111 | Oral cavity | LP | glial cell differentiation | 78/4623 | 225/18723 | 4.82e-04 | 4.52e-03 | 78 |
| GO:003249618 | Oral cavity | LP | response to lipopolysaccharide | 112/4623 | 343/18723 | 4.90e-04 | 4.60e-03 | 112 |
| GO:007121616 | Oral cavity | LP | cellular response to biotic stimulus | 84/4623 | 246/18723 | 5.17e-04 | 4.82e-03 | 84 |
| GO:001692511 | Oral cavity | LP | protein sumoylation | 24/4623 | 53/18723 | 8.55e-04 | 7.45e-03 | 24 |
| GO:003327311 | Oral cavity | LP | response to vitamin | 37/4623 | 93/18723 | 9.14e-04 | 7.79e-03 | 37 |
| GO:003286817 | Oral cavity | LP | response to insulin | 88/4623 | 264/18723 | 9.19e-04 | 7.82e-03 | 88 |
| GO:003286917 | Oral cavity | LP | cellular response to insulin stimulus | 70/4623 | 203/18723 | 1.07e-03 | 8.96e-03 | 70 |
| GO:2001237110 | Oral cavity | LP | negative regulation of extrinsic apoptotic signaling pathway | 38/4623 | 97/18723 | 1.11e-03 | 9.13e-03 | 38 |
| GO:007137515 | Oral cavity | LP | cellular response to peptide hormone stimulus | 95/4623 | 290/18723 | 1.12e-03 | 9.19e-03 | 95 |
| GO:190122413 | Oral cavity | LP | positive regulation of NIK/NF-kappaB signaling | 29/4623 | 69/18723 | 1.15e-03 | 9.40e-03 | 29 |
| GO:000608114 | Oral cavity | LP | cellular aldehyde metabolic process | 26/4623 | 60/18723 | 1.19e-03 | 9.62e-03 | 26 |
| GO:003806112 | Oral cavity | LP | NIK/NF-kappaB signaling | 52/4623 | 143/18723 | 1.20e-03 | 9.66e-03 | 52 |
| GO:005109114 | Oral cavity | LP | positive regulation of DNA-binding transcription factor activity | 86/4623 | 260/18723 | 1.35e-03 | 1.08e-02 | 86 |
| GO:000223718 | Oral cavity | LP | response to molecule of bacterial origin | 115/4623 | 363/18723 | 1.42e-03 | 1.13e-02 | 115 |
| Pathway ID | Tissue | Disease Stage | Description | Gene Ratio | Bg Ratio | pvalue | p.adjust | qvalue | Count |
| hsa05132211 | Esophagus | ESCC | Salmonella infection | 191/4205 | 249/8465 | 6.51e-19 | 5.45e-17 | 2.79e-17 | 191 |
| hsa05208211 | Esophagus | ESCC | Chemical carcinogenesis - reactive oxygen species | 168/4205 | 223/8465 | 1.83e-15 | 6.81e-14 | 3.49e-14 | 168 |
| hsa05022210 | Esophagus | ESCC | Pathways of neurodegeneration - multiple diseases | 318/4205 | 476/8465 | 6.10e-15 | 2.04e-13 | 1.05e-13 | 318 |
| hsa05010210 | Esophagus | ESCC | Alzheimer disease | 263/4205 | 384/8465 | 1.80e-14 | 5.47e-13 | 2.80e-13 | 263 |
| hsa04932210 | Esophagus | ESCC | Non-alcoholic fatty liver disease | 122/4205 | 155/8465 | 5.69e-14 | 1.59e-12 | 8.14e-13 | 122 |
| hsa05166211 | Esophagus | ESCC | Human T-cell leukemia virus 1 infection | 164/4205 | 222/8465 | 8.13e-14 | 2.09e-12 | 1.07e-12 | 164 |
| hsa05169210 | Esophagus | ESCC | Epstein-Barr virus infection | 151/4205 | 202/8465 | 1.55e-13 | 3.45e-12 | 1.77e-12 | 151 |
| hsa05418211 | Esophagus | ESCC | Fluid shear stress and atherosclerosis | 109/4205 | 139/8465 | 2.00e-12 | 3.72e-11 | 1.90e-11 | 109 |
| hsa05131211 | Esophagus | ESCC | Shigellosis | 176/4205 | 247/8465 | 2.27e-12 | 4.01e-11 | 2.05e-11 | 176 |
| hsa0421829 | Esophagus | ESCC | Cellular senescence | 119/4205 | 156/8465 | 5.89e-12 | 9.40e-11 | 4.81e-11 | 119 |
| hsa05415211 | Esophagus | ESCC | Diabetic cardiomyopathy | 146/4205 | 203/8465 | 5.81e-11 | 7.78e-10 | 3.99e-10 | 146 |
| hsa05130211 | Esophagus | ESCC | Pathogenic Escherichia coli infection | 142/4205 | 197/8465 | 8.21e-11 | 1.06e-09 | 5.42e-10 | 142 |
| hsa0466810 | Esophagus | ESCC | TNF signaling pathway | 89/4205 | 114/8465 | 3.36e-10 | 4.01e-09 | 2.06e-09 | 89 |
| hsa0421027 | Esophagus | ESCC | Apoptosis | 102/4205 | 136/8465 | 1.05e-09 | 1.21e-08 | 6.21e-09 | 102 |
| hsa05170210 | Esophagus | ESCC | Human immunodeficiency virus 1 infection | 147/4205 | 212/8465 | 3.37e-09 | 3.53e-08 | 1.81e-08 | 147 |
| hsa05167211 | Esophagus | ESCC | Kaposi sarcoma-associated herpesvirus infection | 136/4205 | 194/8465 | 4.28e-09 | 4.22e-08 | 2.16e-08 | 136 |
| hsa0516425 | Esophagus | ESCC | Influenza A | 122/4205 | 171/8465 | 5.01e-09 | 4.79e-08 | 2.45e-08 | 122 |
| hsa0521216 | Esophagus | ESCC | Pancreatic cancer | 62/4205 | 76/8465 | 7.37e-09 | 6.85e-08 | 3.51e-08 | 62 |
| hsa0516510 | Esophagus | ESCC | Human papillomavirus infection | 215/4205 | 331/8465 | 7.86e-09 | 7.12e-08 | 3.65e-08 | 215 |
| hsa0513526 | Esophagus | ESCC | Yersinia infection | 100/4205 | 137/8465 | 1.80e-08 | 1.59e-07 | 8.12e-08 | 100 |
| Hugo Symbol | Variant Class | Variant Classification | dbSNP RS | HGVSc | HGVSp | HGVSp Short | SWISSPROT | BIOTYPE | SIFT | PolyPhen | Tumor Sample Barcode | Tissue | Histology | Sex | Age | Stage | Therapy Types | Drugs | Outcome |
| RELA | SNV | Missense_Mutation | rs568782744 | c.496N>T | p.Arg166Trp | p.R166W | Q04206 | protein_coding | tolerated(0.12) | possibly_damaging(0.666) | TCGA-A8-A09Z-01 | Breast | breast invasive carcinoma | Female | >=65 | I/II | Unknown | Unknown | SD |
| RELA | insertion | Frame_Shift_Ins | novel | c.1395_1396insGG | p.Leu466GlyfsTer14 | p.L466Gfs*14 | Q04206 | protein_coding | | | TCGA-A2-A04Y-01 | Breast | breast invasive carcinoma | Female | <65 | I/II | Chemotherapy | cytoxan | SD |
| RELA | insertion | In_Frame_Ins | novel | c.1394_1395insGGTCTCTGC | p.Asp465delinsGluValSerAla | p.D465delinsEVSA | Q04206 | protein_coding | | | TCGA-A2-A04Y-01 | Breast | breast invasive carcinoma | Female | <65 | I/II | Chemotherapy | cytoxan | SD |
| RELA | SNV | Missense_Mutation | rs750564559 | c.398N>A | p.Arg133His | p.R133H | Q04206 | protein_coding | deleterious(0) | probably_damaging(0.999) | TCGA-2W-A8YY-01 | Cervix | cervical & endocervical cancer | Female | <65 | I/II | Chemotherapy | cisplatin | CR |
| RELA | SNV | Missense_Mutation | | c.115N>A | p.Glu39Lys | p.E39K | Q04206 | protein_coding | deleterious(0) | probably_damaging(0.992) | TCGA-EK-A3GK-01 | Cervix | cervical & endocervical cancer | Female | <65 | I/II | Unknown | Unknown | SD |
| RELA | SNV | Missense_Mutation | | c.1313N>T | p.Glu438Val | p.E438V | Q04206 | protein_coding | deleterious(0.01) | probably_damaging(0.95) | TCGA-Q1-A73O-01 | Cervix | cervical & endocervical cancer | Female | <65 | I/II | Chemotherapy | cisplatin | CR |
| RELA | SNV | Missense_Mutation | | c.1312N>C | p.Glu438Gln | p.E438Q | Q04206 | protein_coding | tolerated(0.06) | probably_damaging(0.932) | TCGA-Q1-A73O-01 | Cervix | cervical & endocervical cancer | Female | <65 | I/II | Chemotherapy | cisplatin | CR |
| RELA | SNV | Missense_Mutation | | c.379N>A | p.Glu127Lys | p.E127K | Q04206 | protein_coding | tolerated(0.69) | possibly_damaging(0.467) | TCGA-VS-A9V3-01 | Cervix | cervical & endocervical cancer | Female | <65 | I/II | Chemotherapy | cisplatin | PD |
| RELA | SNV | Missense_Mutation | | c.1450N>A | p.Val484Met | p.V484M | Q04206 | protein_coding | tolerated_low_confidence(0.13) | benign(0) | TCGA-AA-3511-01 | Colorectum | colon adenocarcinoma | Male | <65 | I/II | Unknown | Unknown | PD |
| RELA | SNV | Missense_Mutation | | c.559N>T | p.Arg187Cys | p.R187C | Q04206 | protein_coding | deleterious(0) | probably_damaging(0.989) | TCGA-AA-3821-01 | Colorectum | colon adenocarcinoma | Female | >=65 | I/II | Unknown | Unknown | SD |
| Entrez ID | Symbol | Category | Interaction Types | Drug Claim Name | Drug Name | PMIDs |
| 5970 | RELA | DRUGGABLE GENOME, CLINICALLY ACTIONABLE, TRANSCRIPTION FACTOR, KINASE, TRANSCRIPTION FACTOR COMPLEX | | PYROGALLOL RED | PYROGALLOL RED | 16759101 |
| 5970 | RELA | DRUGGABLE GENOME, CLINICALLY ACTIONABLE, TRANSCRIPTION FACTOR, KINASE, TRANSCRIPTION FACTOR COMPLEX | | ACACETIN | ACACETIN | 25190466 |
| 5970 | RELA | DRUGGABLE GENOME, CLINICALLY ACTIONABLE, TRANSCRIPTION FACTOR, KINASE, TRANSCRIPTION FACTOR COMPLEX | | ANTISENSE OLIGONUCLEOTIDES | | 8035811 |
| 5970 | RELA | DRUGGABLE GENOME, CLINICALLY ACTIONABLE, TRANSCRIPTION FACTOR, KINASE, TRANSCRIPTION FACTOR COMPLEX | | 2-PHENYLACETYLAMINOBENZOTHIAZOLE | CHEMBL1405979 | |
| 5970 | RELA | DRUGGABLE GENOME, CLINICALLY ACTIONABLE, TRANSCRIPTION FACTOR, KINASE, TRANSCRIPTION FACTOR COMPLEX | | PYRROLIDINE DITHIOCARBAMATE | PYRROLIDINE DITHIOCARBAMATE | |
| 5970 | RELA | DRUGGABLE GENOME, CLINICALLY ACTIONABLE, TRANSCRIPTION FACTOR, KINASE, TRANSCRIPTION FACTOR COMPLEX | | ISOLIQUIRITIGENIN | ISOLIQUIRITIGENIN | 21866899 |
| 5970 | RELA | DRUGGABLE GENOME, CLINICALLY ACTIONABLE, TRANSCRIPTION FACTOR, KINASE, TRANSCRIPTION FACTOR COMPLEX | | APIGENIN | APIGENIN | 25190466 |
| 5970 | RELA | DRUGGABLE GENOME, CLINICALLY ACTIONABLE, TRANSCRIPTION FACTOR, KINASE, TRANSCRIPTION FACTOR COMPLEX | | CID 739615 | CHEMBL260560 | |
| 5970 | RELA | DRUGGABLE GENOME, CLINICALLY ACTIONABLE, TRANSCRIPTION FACTOR, KINASE, TRANSCRIPTION FACTOR COMPLEX | | 4',7-DIMETHOXY-5-HYDROXYGENISTEIN | 4',7-DIMETHOXY-5-HYDROXYGENISTEIN | |
| 5970 | RELA | DRUGGABLE GENOME, CLINICALLY ACTIONABLE, TRANSCRIPTION FACTOR, KINASE, TRANSCRIPTION FACTOR COMPLEX | | PARTHENOLIDE | PARTHENOLIDE | 25190466 |


