Schematic overview of the cellular and molecular mechanisms involved in the cancer progression, including the proposed cellular and molecular mechanisms in cancer cells trajectory. AT1: alveolar type 1 cells; AT2: alveolar type 2 cells; AAH: atypical adenomatous hyperplasia; AIS: adenocarcinoma in situ; MIA: minimally invasive adenocarcinoma; IA: invasive adenocarcinoma; EMT: epithelial-mesenchymal transition

Home

Download

Statistics

Help

Contact

Center for Computational Systems Medicine
leaf

Gene summary

leaf

Malignant transformation analysis

leaf

Malignant transformation related pathway analysis

leaf

Cell-cell communication analysis

leaf

Single-cell gene regulatory network inference analysis

leaf

Somatic mutation of malignant transformation related genes

leaf

Related drugs of malignant transformation related genes

Gene: RBFOX2

Gene summary for RBFOX2

check button Gene summary.

Gene informationSpeciesHuman
Gene symbol

RBFOX2

Gene ID

23543

Gene nameRNA binding fox-1 homolog 2
Gene AliasFOX2
Cytomap22q12.3
Gene Typeprotein-coding
GO ID

GO:0000375

UniProtAcc

O43251


Top

Malignant transformation analysis

check button Identification of the aberrant gene expression in precancerous and cancerous lesions by comparing the gene expression of stem-like cells in diseased tissues with normal stem cells
check button Malignant transformation involving gene list.
Entrez IDSymbolReplicatesSpeciesOrganTissueAdj P-valueLog2FCMalignancy
23543RBFOX2CA_HPV_3HumanCervixCC4.95e-041.70e-010.0414
23543RBFOX2CCI_1HumanCervixCC7.99e-161.70e+000.528
23543RBFOX2CCI_2HumanCervixCC2.32e-101.25e+000.5249
23543RBFOX2CCI_3HumanCervixCC1.03e-241.37e+000.516
23543RBFOX2sample3HumanCervixCC4.63e-062.08e-010.1387
23543RBFOX2T3HumanCervixCC4.77e-041.92e-010.1389
23543RBFOX2HTA11_3410_2000001011HumanColorectumAD1.28e-411.22e+000.0155
23543RBFOX2HTA11_2487_2000001011HumanColorectumSER8.55e-372.23e+00-0.1808
23543RBFOX2HTA11_2951_2000001011HumanColorectumAD1.23e-322.85e+000.0216
23543RBFOX2HTA11_1938_2000001011HumanColorectumAD5.35e-372.30e+00-0.0811
23543RBFOX2HTA11_78_2000001011HumanColorectumAD8.14e-117.39e-01-0.1088
23543RBFOX2HTA11_347_2000001011HumanColorectumAD9.79e-432.28e+00-0.1954
23543RBFOX2HTA11_411_2000001011HumanColorectumSER3.88e-342.91e+00-0.2602
23543RBFOX2HTA11_2112_2000001011HumanColorectumSER4.42e-202.32e+00-0.2196
23543RBFOX2HTA11_3361_2000001011HumanColorectumAD2.94e-332.64e+00-0.1207
23543RBFOX2HTA11_83_2000001011HumanColorectumSER5.46e-332.16e+00-0.1526
23543RBFOX2HTA11_696_2000001011HumanColorectumAD1.85e-672.73e+00-0.1464
23543RBFOX2HTA11_866_2000001011HumanColorectumAD9.98e-512.51e+00-0.1001
23543RBFOX2HTA11_1391_2000001011HumanColorectumAD2.30e-472.97e+00-0.059
23543RBFOX2HTA11_2992_2000001011HumanColorectumSER1.28e-352.51e+00-0.1706
Page: 1 2 3 4 5 6 7 8 9 10 11 12 13 14 15 

check button Transcriptomic changes along malignancy continuum.
TissueExpression DynamicsAbbreviation
CervixThe image shows the transcriptomic changes along malignancy continuum.log2FC in expression of this searched gene in stem-like cells from each diseased tissue sample relative to stem-like cells in normal samples in each tissue plotted against the malignancy continuum. Samples are colored based on if they are from different disease stage.CC: Cervix cancer
HSIL_HPV: HPV-infected high-grade squamous intraepithelial lesions
N_HPV: HPV-infected normal cervix
Colorectum (GSE201348)The image shows the transcriptomic changes along malignancy continuum.log2FC in expression of this searched gene in stem-like cells from each diseased tissue sample relative to stem-like cells in normal samples in each tissue plotted against the malignancy continuum. Samples are colored based on if they are from different disease stage.
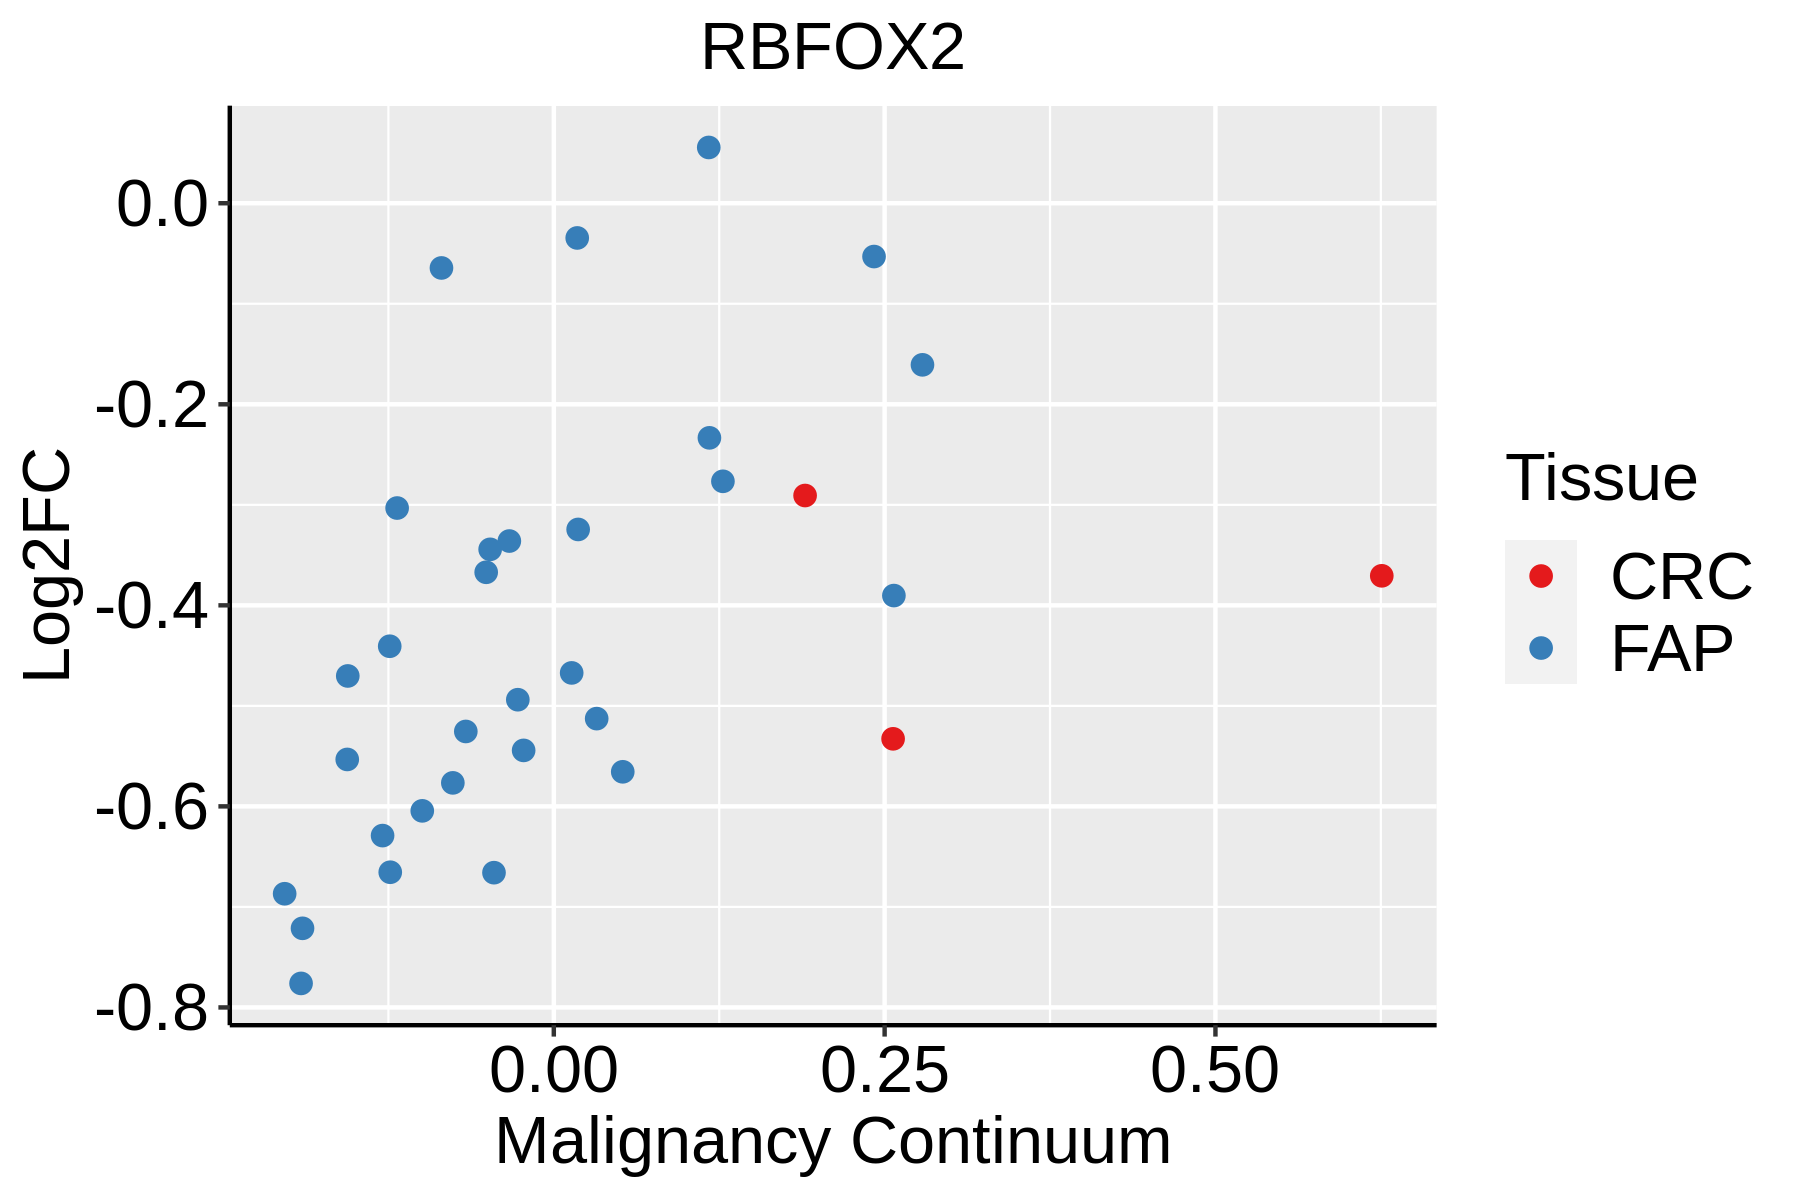
FAP: Familial adenomatous polyposis
CRC: Colorectal cancer
Colorectum (HTA11)The image shows the transcriptomic changes along malignancy continuum.log2FC in expression of this searched gene in stem-like cells from each diseased tissue sample relative to stem-like cells in normal samples in each tissue plotted against the malignancy continuum. Samples are colored based on if they are from different disease stage.AD: Adenomas
SER: Sessile serrated lesions
MSI-H: Microsatellite-high colorectal cancer
MSS: Microsatellite stable colorectal cancer
EndometriumThe image shows the transcriptomic changes along malignancy continuum.log2FC in expression of this searched gene in stem-like cells from each diseased tissue sample relative to stem-like cells in normal samples in each tissue plotted against the malignancy continuum. Samples are colored based on if they are from different disease stage.AEH: Atypical endometrial hyperplasia
EEC: Endometrioid Cancer
EsophagusThe image shows the transcriptomic changes along malignancy continuum.log2FC in expression of this searched gene in stem-like cells from each diseased tissue sample relative to stem-like cells in normal samples in each tissue plotted against the malignancy continuum. Samples are colored based on if they are from different disease stage.
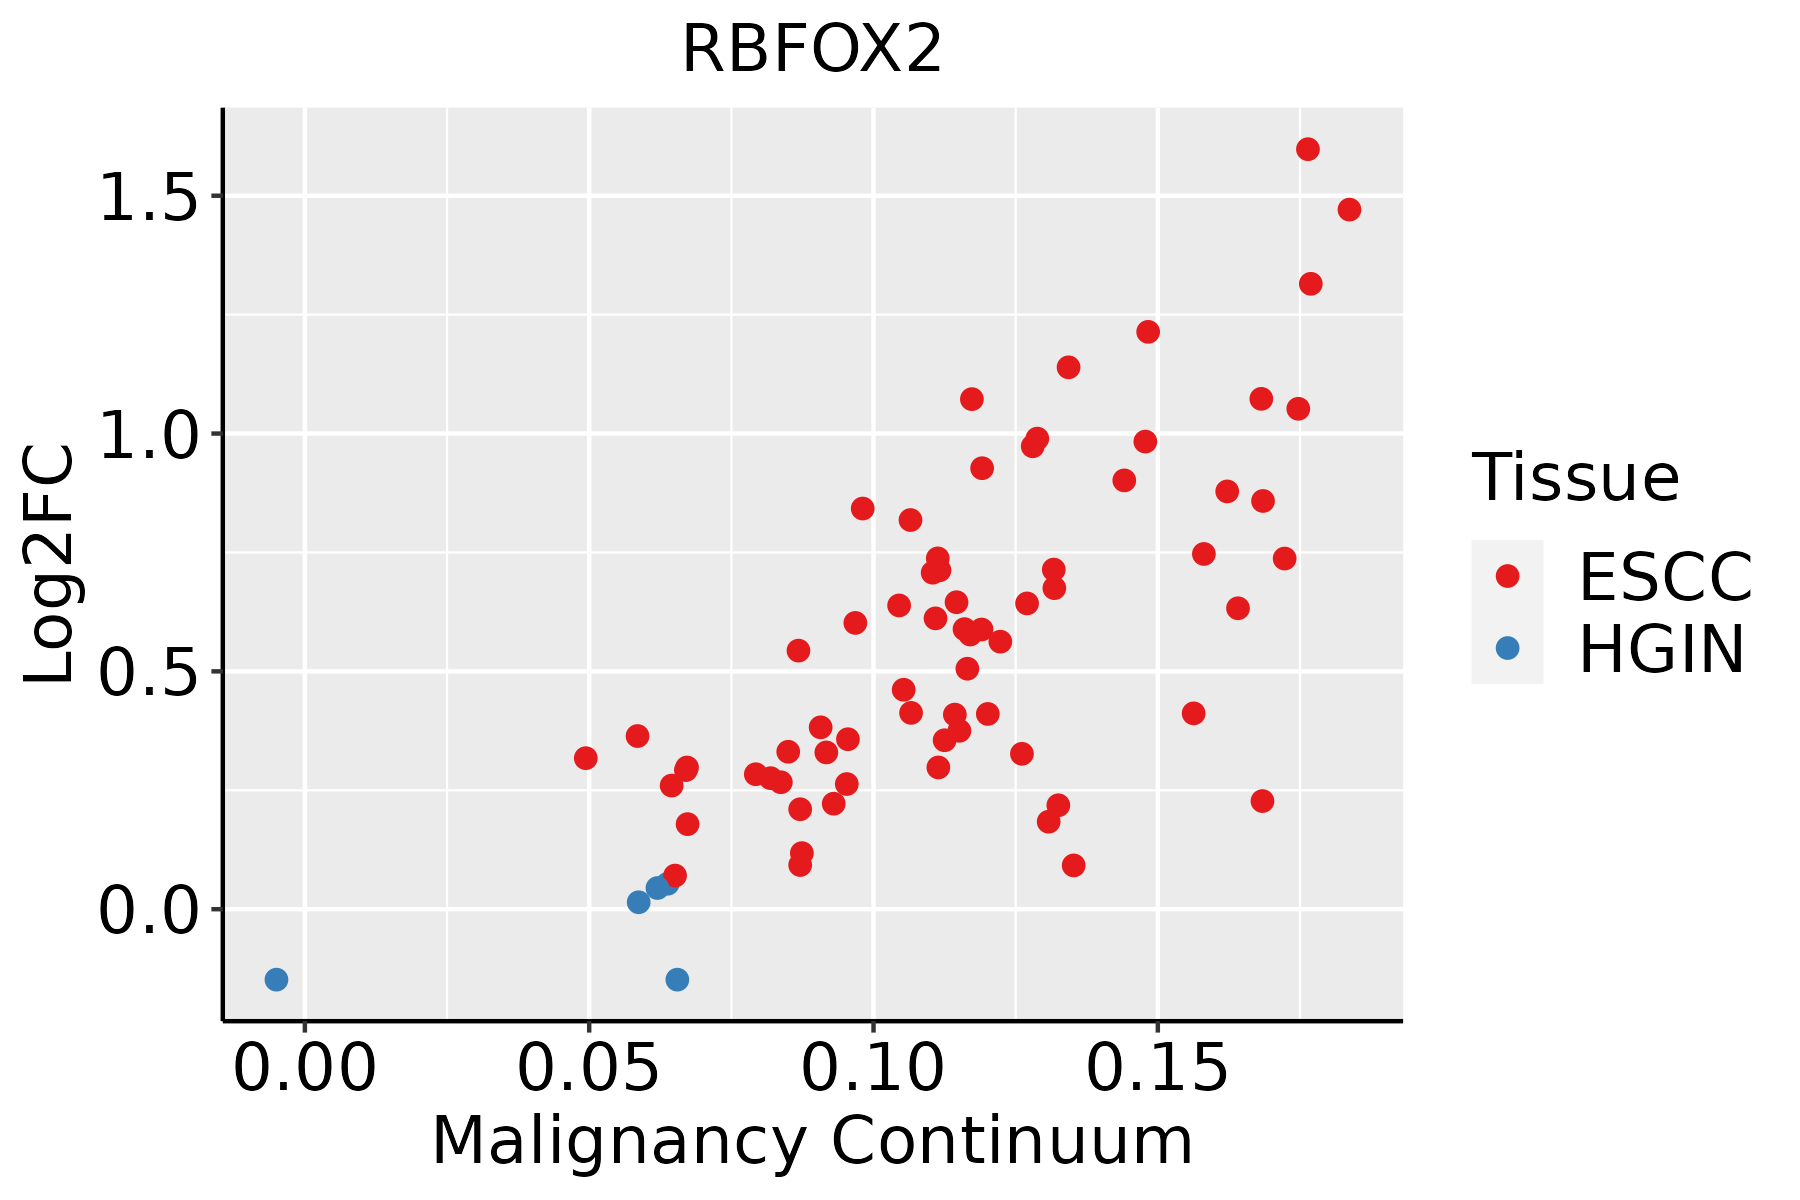
ESCC: Esophageal squamous cell carcinoma
HGIN: High-grade intraepithelial neoplasias
LGIN: Low-grade intraepithelial neoplasias
GCThe image shows the transcriptomic changes along malignancy continuum.log2FC in expression of this searched gene in stem-like cells from each diseased tissue sample relative to stem-like cells in normal samples in each tissue plotted against the malignancy continuum. Samples are colored based on if they are from different disease stage.CAG: Chronic atrophic gastritis
CAG with IM: Chronic atrophic gastritis with intestinal metaplasia
CSG: Chronic superficial gastritis
GC: Gastric cancer
SIM: Severe intestinal metaplasia
WIM: Wild intestinal metaplasia
LiverThe image shows the transcriptomic changes along malignancy continuum.log2FC in expression of this searched gene in stem-like cells from each diseased tissue sample relative to stem-like cells in normal samples in each tissue plotted against the malignancy continuum. Samples are colored based on if they are from different disease stage.HCC: Hepatocellular carcinoma
NAFLD: Non-alcoholic fatty liver disease
LungThe image shows the transcriptomic changes along malignancy continuum.log2FC in expression of this searched gene in stem-like cells from each diseased tissue sample relative to stem-like cells in normal samples in each tissue plotted against the malignancy continuum. Samples are colored based on if they are from different disease stage.
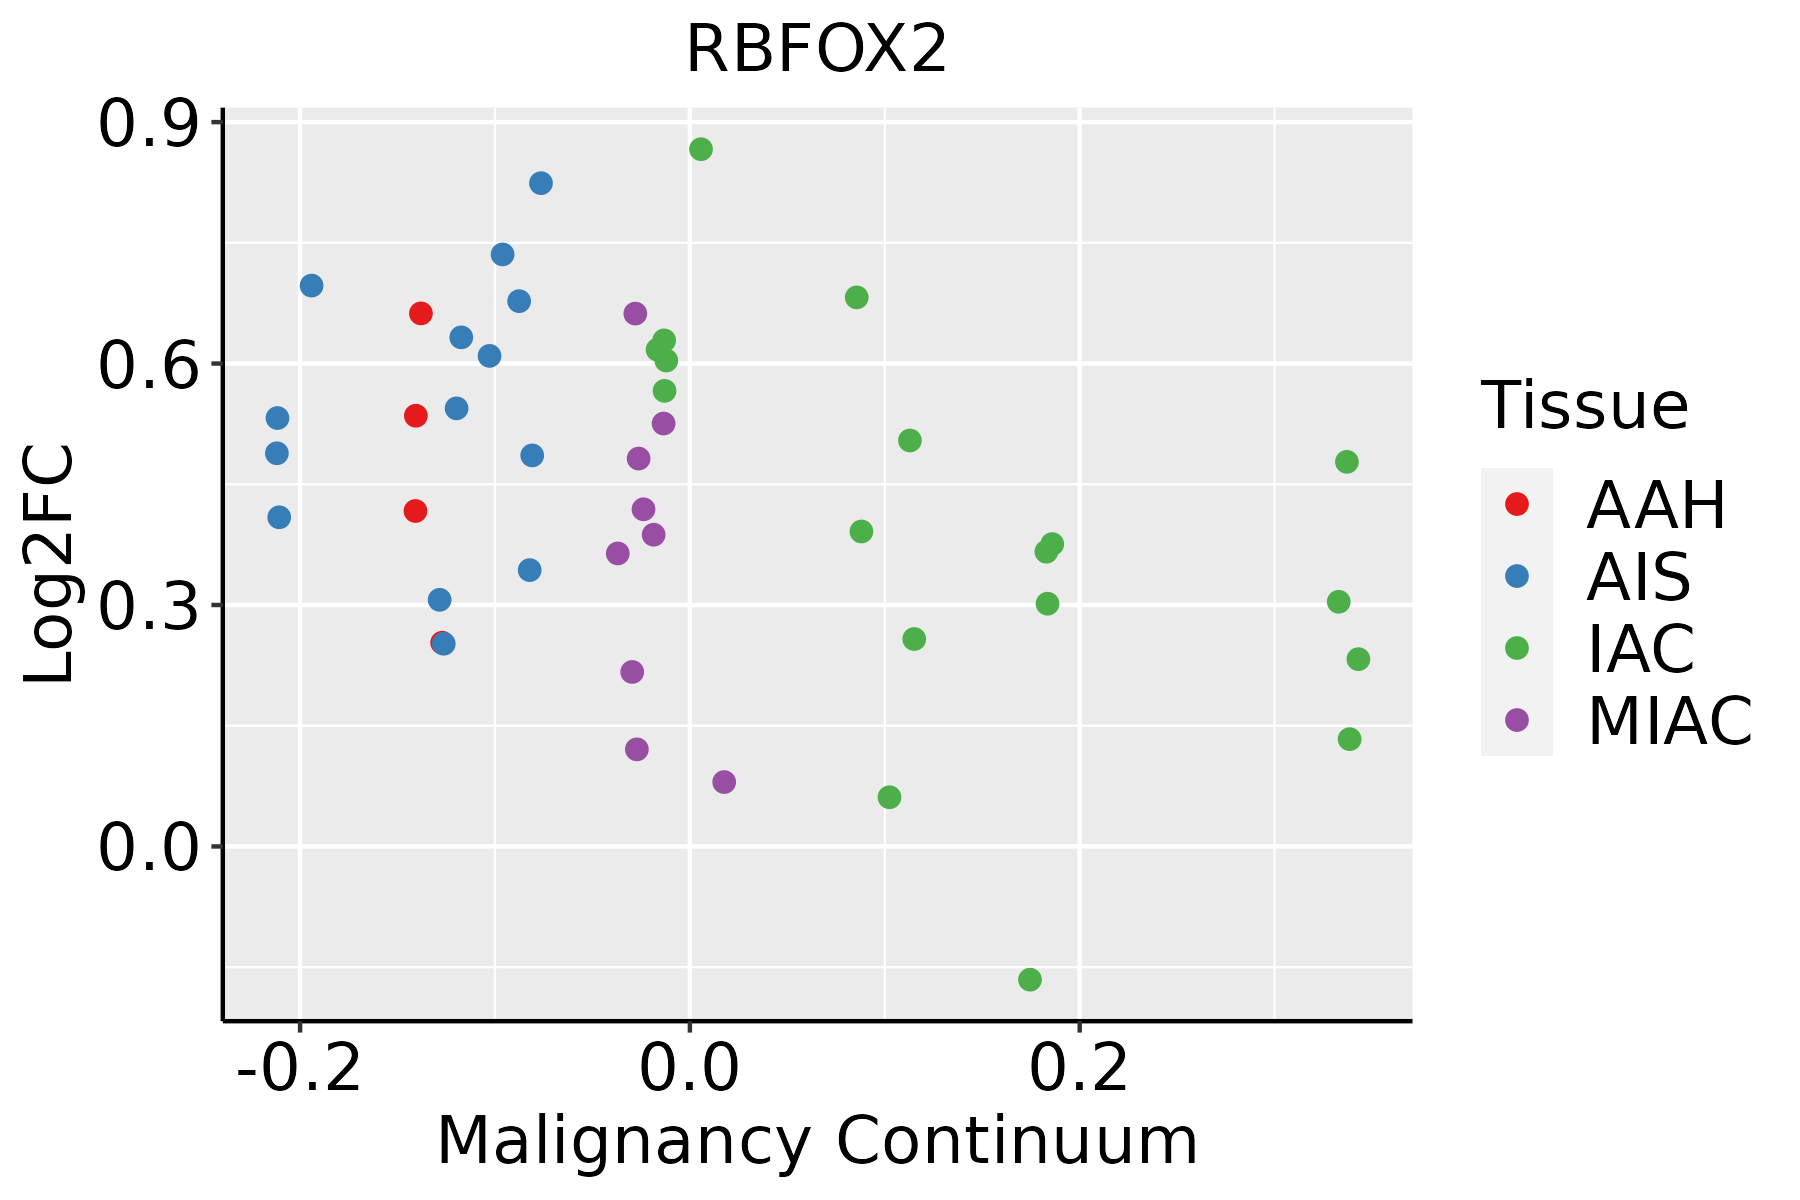
AAH: Atypical adenomatous hyperplasia
AIS: Adenocarcinoma in situ
IAC: Invasive lung adenocarcinoma
MIA: Minimally invasive adenocarcinoma
Oral CavityThe image shows the transcriptomic changes along malignancy continuum.log2FC in expression of this searched gene in stem-like cells from each diseased tissue sample relative to stem-like cells in normal samples in each tissue plotted against the malignancy continuum. Samples are colored based on if they are from different disease stage.
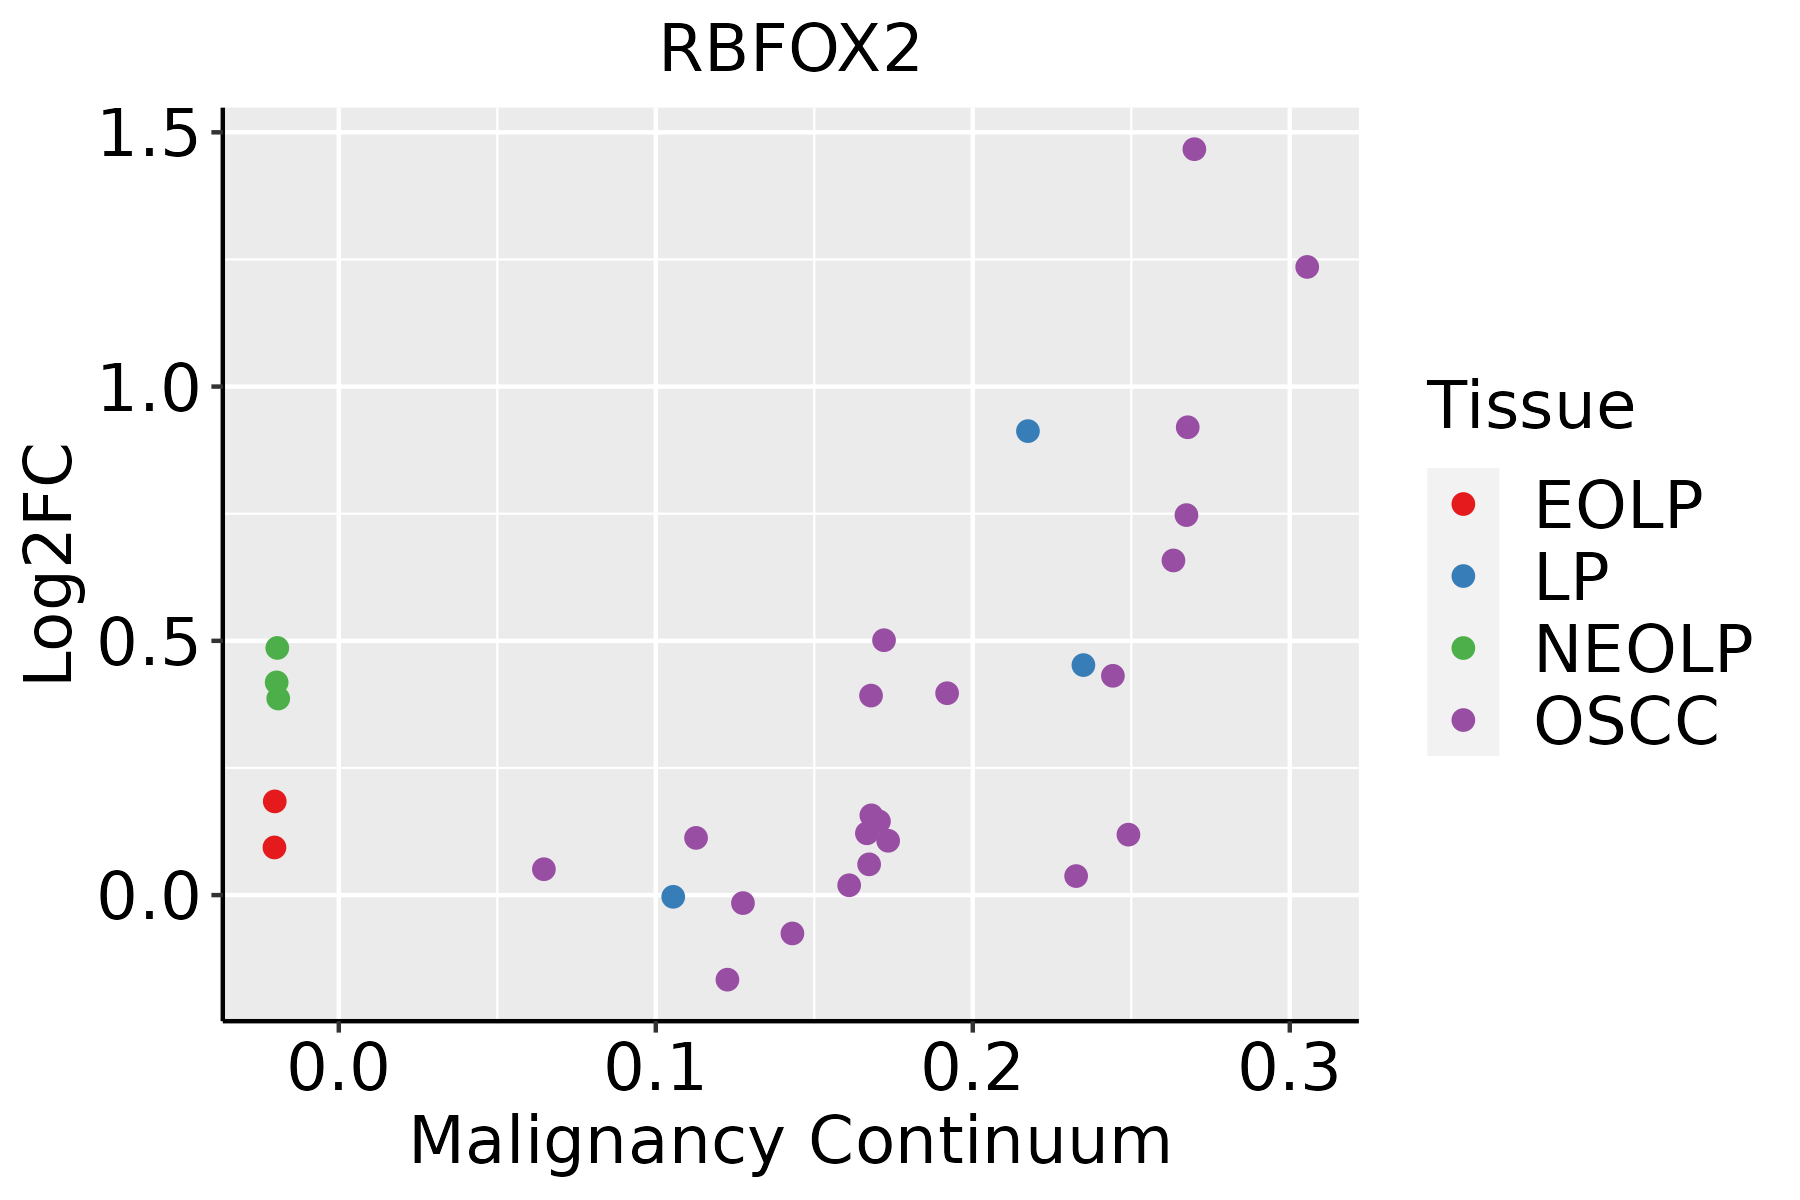
EOLP: Erosive Oral lichen planus
LP: leukoplakia
NEOLP: Non-erosive oral lichen planus
OSCC: Oral squamous cell carcinoma
ProstateThe image shows the transcriptomic changes along malignancy continuum.log2FC in expression of this searched gene in stem-like cells from each diseased tissue sample relative to stem-like cells in normal samples in each tissue plotted against the malignancy continuum. Samples are colored based on if they are from different disease stage.
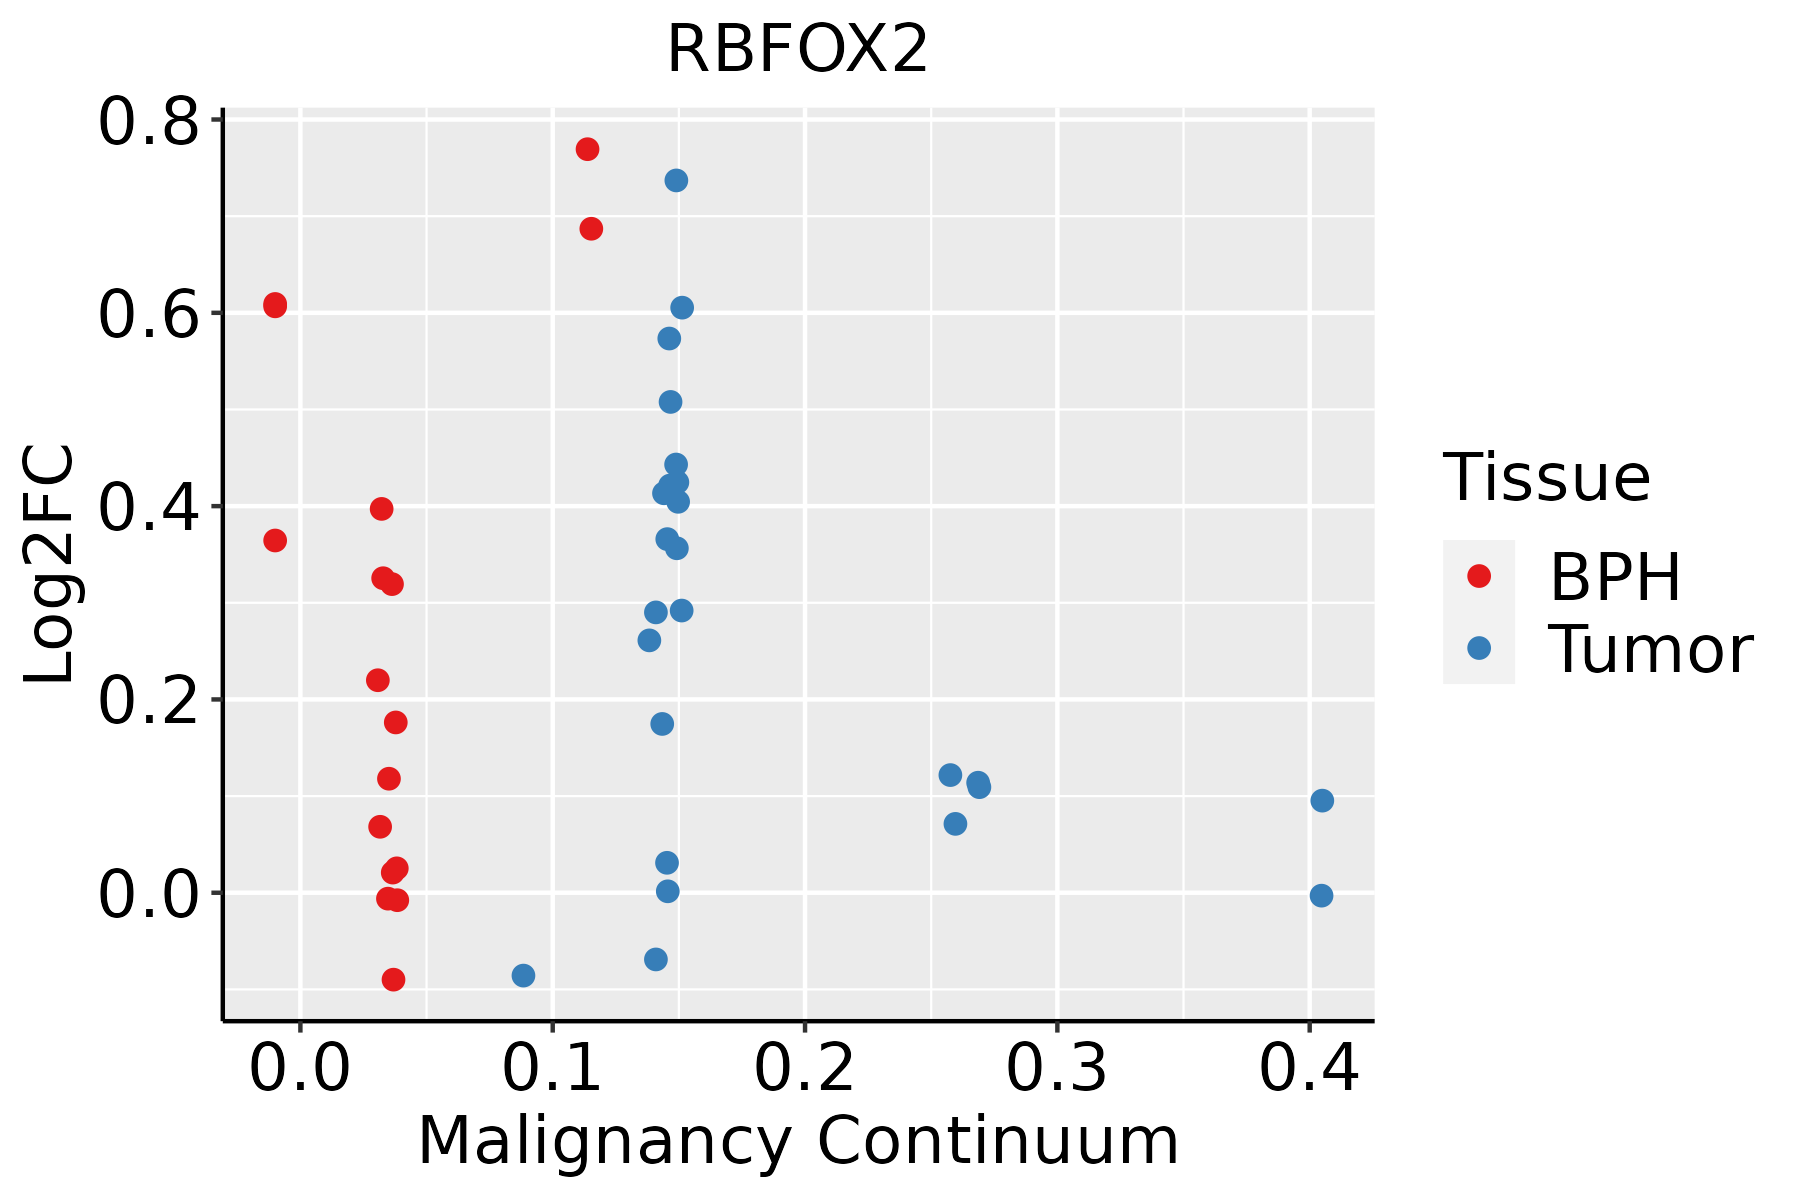
BPH: Benign Prostatic Hyperplasia
SkinThe image shows the transcriptomic changes along malignancy continuum.log2FC in expression of this searched gene in stem-like cells from each diseased tissue sample relative to stem-like cells in normal samples in each tissue plotted against the malignancy continuum. Samples are colored based on if they are from different disease stage.AK: Actinic keratosis
cSCC: Cutaneous squamous cell carcinoma
SCCIS:squamous cell carcinoma in situ
ThyroidThe image shows the transcriptomic changes along malignancy continuum.log2FC in expression of this searched gene in stem-like cells from each diseased tissue sample relative to stem-like cells in normal samples in each tissue plotted against the malignancy continuum. Samples are colored based on if they are from different disease stage.
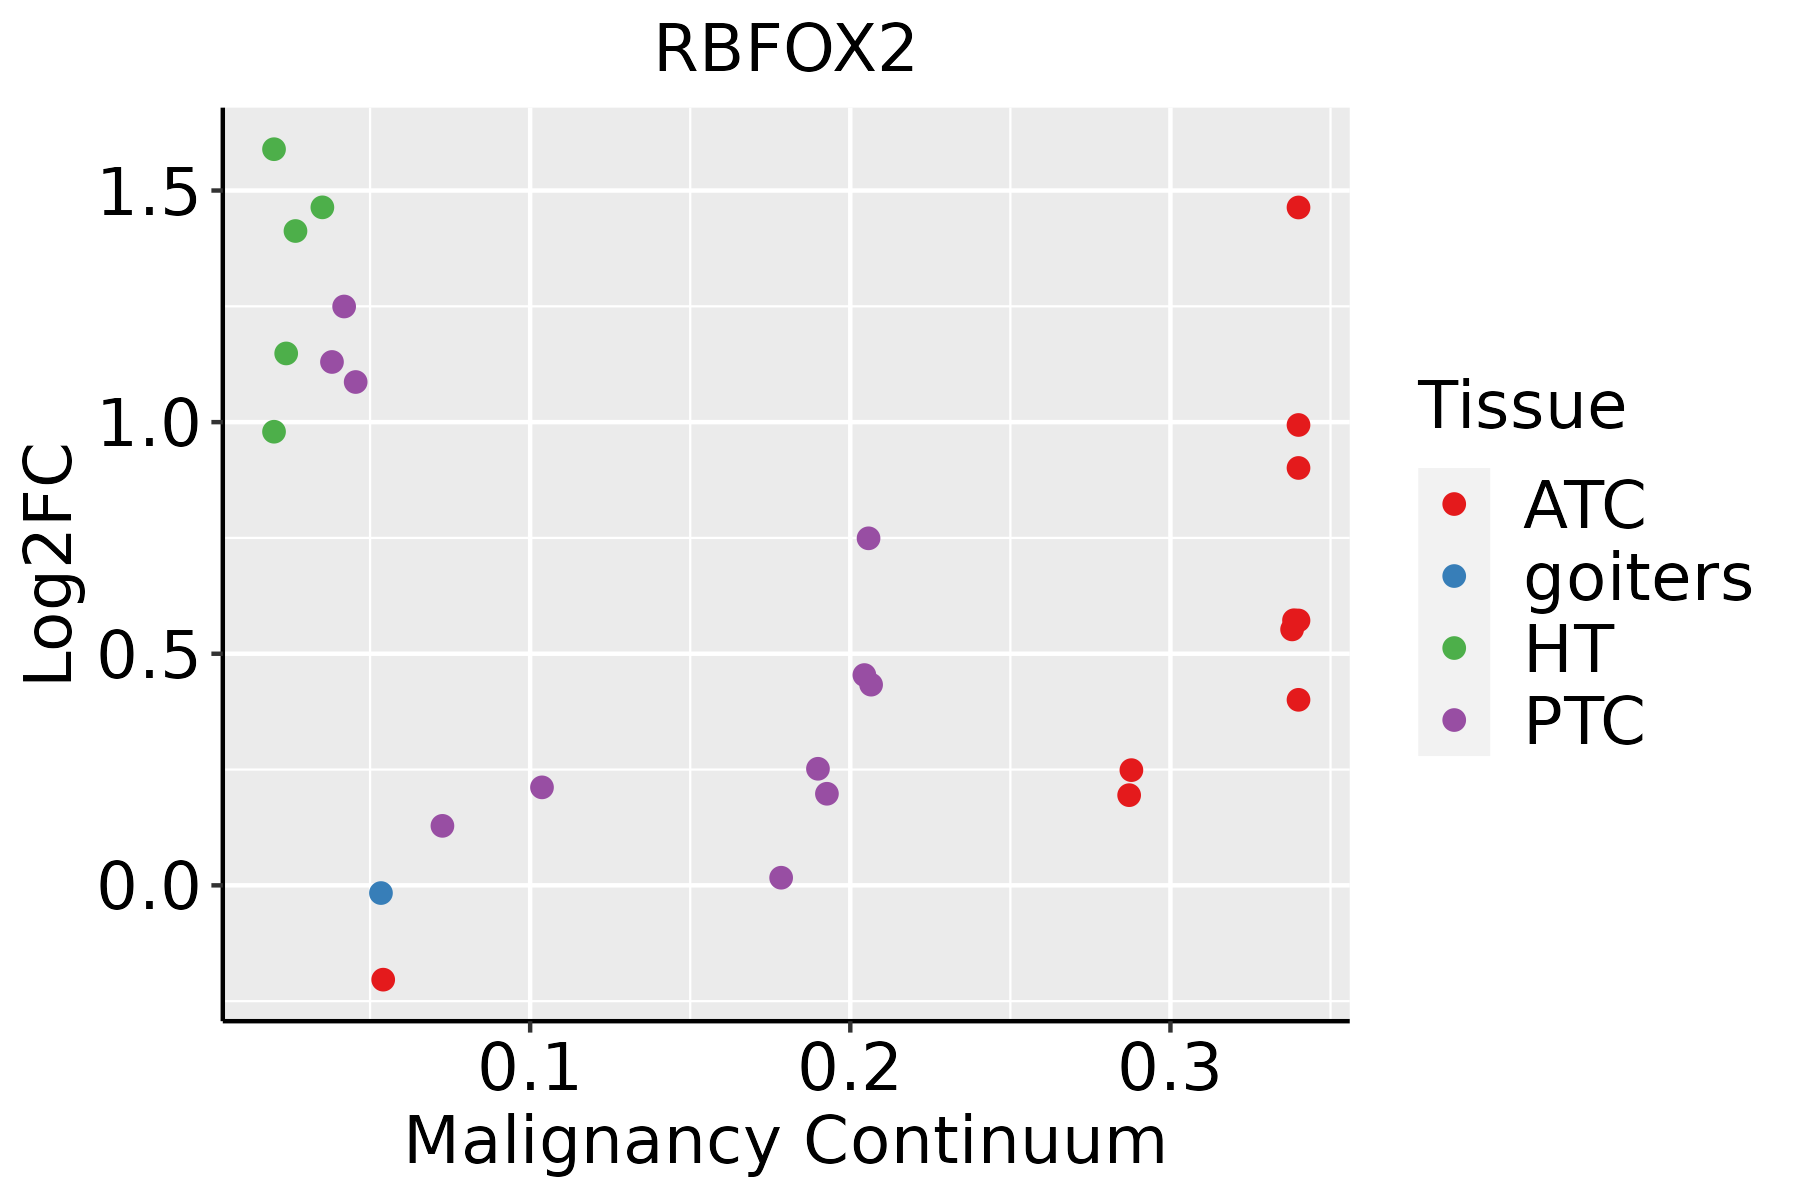
ATC: Anaplastic thyroid cancer
HT: Hashimoto's thyroiditis
PTC: Papillary thyroid cancer
∗log2FC in expression of this searched gene in stem-like cells from each diseased tissue sample relative to stem-like cells in normal samples in each tissue plotted against the malignancy continuum. Samples are colored based on if they are from different disease stage.

Top

Malignant transformation related pathway analysis

check buttonFind out the enriched GO biological processes and KEGG pathways involved in transition from healthy to precancer to cancer
check button Figure of enriched GO biological processes.
TissueDisease StageEnriched GO biological Processes
ColorectumADGO analysis - Figure of enriched GO biological processes: Top 15 enriched GO BP terms are showed in the bar plot of each disease state in each tissue. Each row represents a significant GO biological process which is colored according to the -log10(p.adjust).
ColorectumSERGO analysis - Figure of enriched GO biological processes: Top 15 enriched GO BP terms are showed in the bar plot of each disease state in each tissue. Each row represents a significant GO biological process which is colored according to the -log10(p.adjust).
ColorectumMSSGO analysis - Figure of enriched GO biological processes: Top 15 enriched GO BP terms are showed in the bar plot of each disease state in each tissue. Each row represents a significant GO biological process which is colored according to the -log10(p.adjust).
ColorectumMSI-HGO analysis - Figure of enriched GO biological processes: Top 15 enriched GO BP terms are showed in the bar plot of each disease state in each tissue. Each row represents a significant GO biological process which is colored according to the -log10(p.adjust).
ColorectumFAPGO analysis - Figure of enriched GO biological processes: Top 15 enriched GO BP terms are showed in the bar plot of each disease state in each tissue. Each row represents a significant GO biological process which is colored according to the -log10(p.adjust).
∗Top 15 enriched GO BP terms are showed in the bar plot of each disease state in each tissue. Each row represents a significant GO biological process which is colored according to the -log10(p.adjust).
Page: 1 2 3 4 5 6 7 8 9 

check button Enriched GO biological processes.
GO IDTissueDisease StageDescriptionGene RatioBg Ratiopvaluep.adjustCount
GO:00305204LungIACintracellular estrogen receptor signaling pathway13/206154/187234.89e-033.78e-0213
GO:19037068LungIACregulation of hemopoiesis56/2061367/187237.23e-034.94e-0256
GO:004348413LungAISregulation of RNA splicing45/1849148/187232.75e-122.67e-0945
GO:004802413LungAISregulation of mRNA splicing, via spliceosome32/1849101/187231.20e-092.42e-0732
GO:190331112LungAISregulation of mRNA metabolic process60/1849288/187231.74e-082.47e-0660
GO:005068412LungAISregulation of mRNA processing36/1849137/187233.06e-083.79e-0636
GO:003052213LungAISintracellular receptor signaling pathway53/1849265/187234.57e-073.55e-0553
GO:001635812LungAISdendrite development49/1849243/187239.53e-076.69e-0549
GO:000038112LungAISregulation of alternative mRNA splicing, via spliceosome19/184960/187232.77e-061.52e-0419
GO:003051812LungAISintracellular steroid hormone receptor signaling pathway28/1849116/187236.14e-062.82e-0428
GO:003410113LungAISerythrocyte homeostasis30/1849129/187236.51e-062.92e-0430
GO:007138313LungAIScellular response to steroid hormone stimulus41/1849204/187237.76e-063.35e-0441
GO:004854513LungAISresponse to steroid hormone59/1849339/187231.15e-054.65e-0459
GO:000038012LungAISalternative mRNA splicing, via spliceosome21/184977/187231.19e-054.71e-0421
GO:003021813LungAISerythrocyte differentiation28/1849120/187231.22e-054.71e-0428
GO:003009913LungAISmyeloid cell differentiation63/1849381/187233.05e-059.70e-0463
GO:000226213LungAISmyeloid cell homeostasis32/1849157/187235.57e-051.57e-0332
GO:004881311LungAISdendrite morphogenesis30/1849146/187238.03e-052.02e-0330
GO:000838013LungAISRNA splicing68/1849434/187238.50e-052.11e-0368
GO:004887213LungAIShomeostasis of number of cells47/1849272/187231.03e-042.50e-0347
Page: 1 2 3 4 5 6 7 8 9 10 11 12 13 14 15 16 17 18 19 20 21 22 23 24 25 26 27 28 29 30 31 32 33 34 35 36 

check button Enriched KEGG pathways.
Pathway IDTissueDisease StageDescriptionGene RatioBg Ratiopvaluep.adjustqvalueCount
Page: 1 

Top

Cell-cell communication analysis

check buttonIdentification of potential cell-cell interactions between two cell types and their ligand-receptor pairs for different disease states
LigandReceptorLRpairPathwayTissueDisease Stage
Page: 1 

Top

Single-cell gene regulatory network inference analysis

check buttonFind out the significant the regulons (TFs) and the target genes of each regulon across cell types for different disease states
TFCell TypeTissueDisease StageTarget GeneRSSRegulon Activity
RBFOX2NUERProstateADJPPP1R12B,CHD9,DHX8, etc.0.00e+00The dot plots of a searched regulon are shown for all cell subpopulations in each disease state of each tissue based on the regulon specific score inferred using pySCENIC and by calculating the average expression.
RBFOX2BASProstateADJPPP1R12B,CHD9,DHX8, etc.0.00e+00The dot plots of a searched regulon are shown for all cell subpopulations in each disease state of each tissue based on the regulon specific score inferred using pySCENIC and by calculating the average expression.
RBFOX2BASProstateTumorPPP1R12B,CHD9,DHX8, etc.8.56e-03The dot plots of a searched regulon are shown for all cell subpopulations in each disease state of each tissue based on the regulon specific score inferred using pySCENIC and by calculating the average expression.
RBFOX2NUERProstateTumorPPP1R12B,CHD9,DHX8, etc.7.36e-03The dot plots of a searched regulon are shown for all cell subpopulations in each disease state of each tissue based on the regulon specific score inferred using pySCENIC and by calculating the average expression.
∗The dot plots of a searched regulon are shown for all cell subpopulations in each disease state of each tissue based on the regulon specific score inferred using pySCENIC and by calculating the average expression.
Page: 1 

Top

Somatic mutation of malignant transformation related genes

check buttonAnnotation of somatic variants for genes involved in malignant transformation
Hugo SymbolVariant ClassVariant ClassificationdbSNP RSHGVScHGVSpHGVSp ShortSWISSPROTBIOTYPESIFTPolyPhenTumor Sample BarcodeTissueHistologySexAgeStageTherapy TypesDrugsOutcome
RBFOX2SNVMissense_Mutationc.964A>Gp.Ser322Glyp.S322GO43251protein_codingtolerated_low_confidence(0.31)benign(0.015)TCGA-AN-A0AK-01Breastbreast invasive carcinomaFemale>=65I/IIUnknownUnknownSD
RBFOX2SNVMissense_Mutationnovelc.383N>Cp.Asn128Thrp.N128TO43251protein_codingtolerated(0.93)benign(0.019)TCGA-D8-A1XG-01Breastbreast invasive carcinomaFemale>=65III/IVUnknownUnknownSD
RBFOX2SNVMissense_Mutationc.434N>Tp.Ser145Leup.S145LO43251protein_codingdeleterious(0.04)benign(0.015)TCGA-D8-A27G-01Breastbreast invasive carcinomaFemale>=65I/IIUnknownUnknownSD
RBFOX2SNVMissense_Mutationnovelc.383N>Cp.Asn128Thrp.N128TO43251protein_codingtolerated(0.93)benign(0.019)TCGA-E9-A1RE-01Breastbreast invasive carcinomaFemale>=65III/IVHormone TherapytamoxiphenSD
RBFOX2insertionFrame_Shift_Insnovelc.547_548insTTTATp.Arg183LeufsTer29p.R183Lfs*29O43251protein_codingTCGA-A8-A079-01Breastbreast invasive carcinomaFemale>=65III/IVChemotherapy5-fluorouracilSD
RBFOX2insertionNonsense_Mutationnovelc.546_547insGCATTACGATGATAGGATTGCAGATTATp.Arg183AlafsTer4p.R183Afs*4O43251protein_codingTCGA-A8-A079-01Breastbreast invasive carcinomaFemale>=65III/IVChemotherapy5-fluorouracilSD
RBFOX2SNVMissense_Mutationc.1073G>Ap.Arg358Glnp.R358QO43251protein_codingdeleterious(0.02)probably_damaging(0.996)TCGA-C5-A1MH-01Cervixcervical & endocervical cancerFemale>=65III/IVChemotherapycisplatinPD
RBFOX2SNVMissense_Mutationnovelc.511N>Cp.Ser171Argp.S171RO43251protein_codingtolerated(0.3)benign(0.147)TCGA-5M-AAT6-01Colorectumcolon adenocarcinomaFemale<65III/IVUnknownUnknownPD
RBFOX2SNVMissense_Mutationc.1018N>Ap.Ala340Thrp.A340TO43251protein_codingtolerated(0.06)benign(0.154)TCGA-AA-3877-01Colorectumcolon adenocarcinomaFemale>=65I/IIUnknownUnknownSD
RBFOX2SNVMissense_Mutationnovelc.292N>Tp.Ile98Phep.I98FO43251protein_codingtolerated_low_confidence(0.09)possibly_damaging(0.791)TCGA-AM-5820-01Colorectumcolon adenocarcinomaFemale<65I/IIUnknownUnknownSD
Page: 1 2 3 4 5 

Top

Related drugs of malignant transformation related genes

check buttonIdentification of chemicals and drugs interact with genes involved in malignant transfromation
(DGIdb 4.0)
Entrez IDSymbolCategoryInteraction TypesDrug Claim NameDrug NamePMIDs
Page: 1