| Tissue | Expression Dynamics | Abbreviation |
| Cervix | 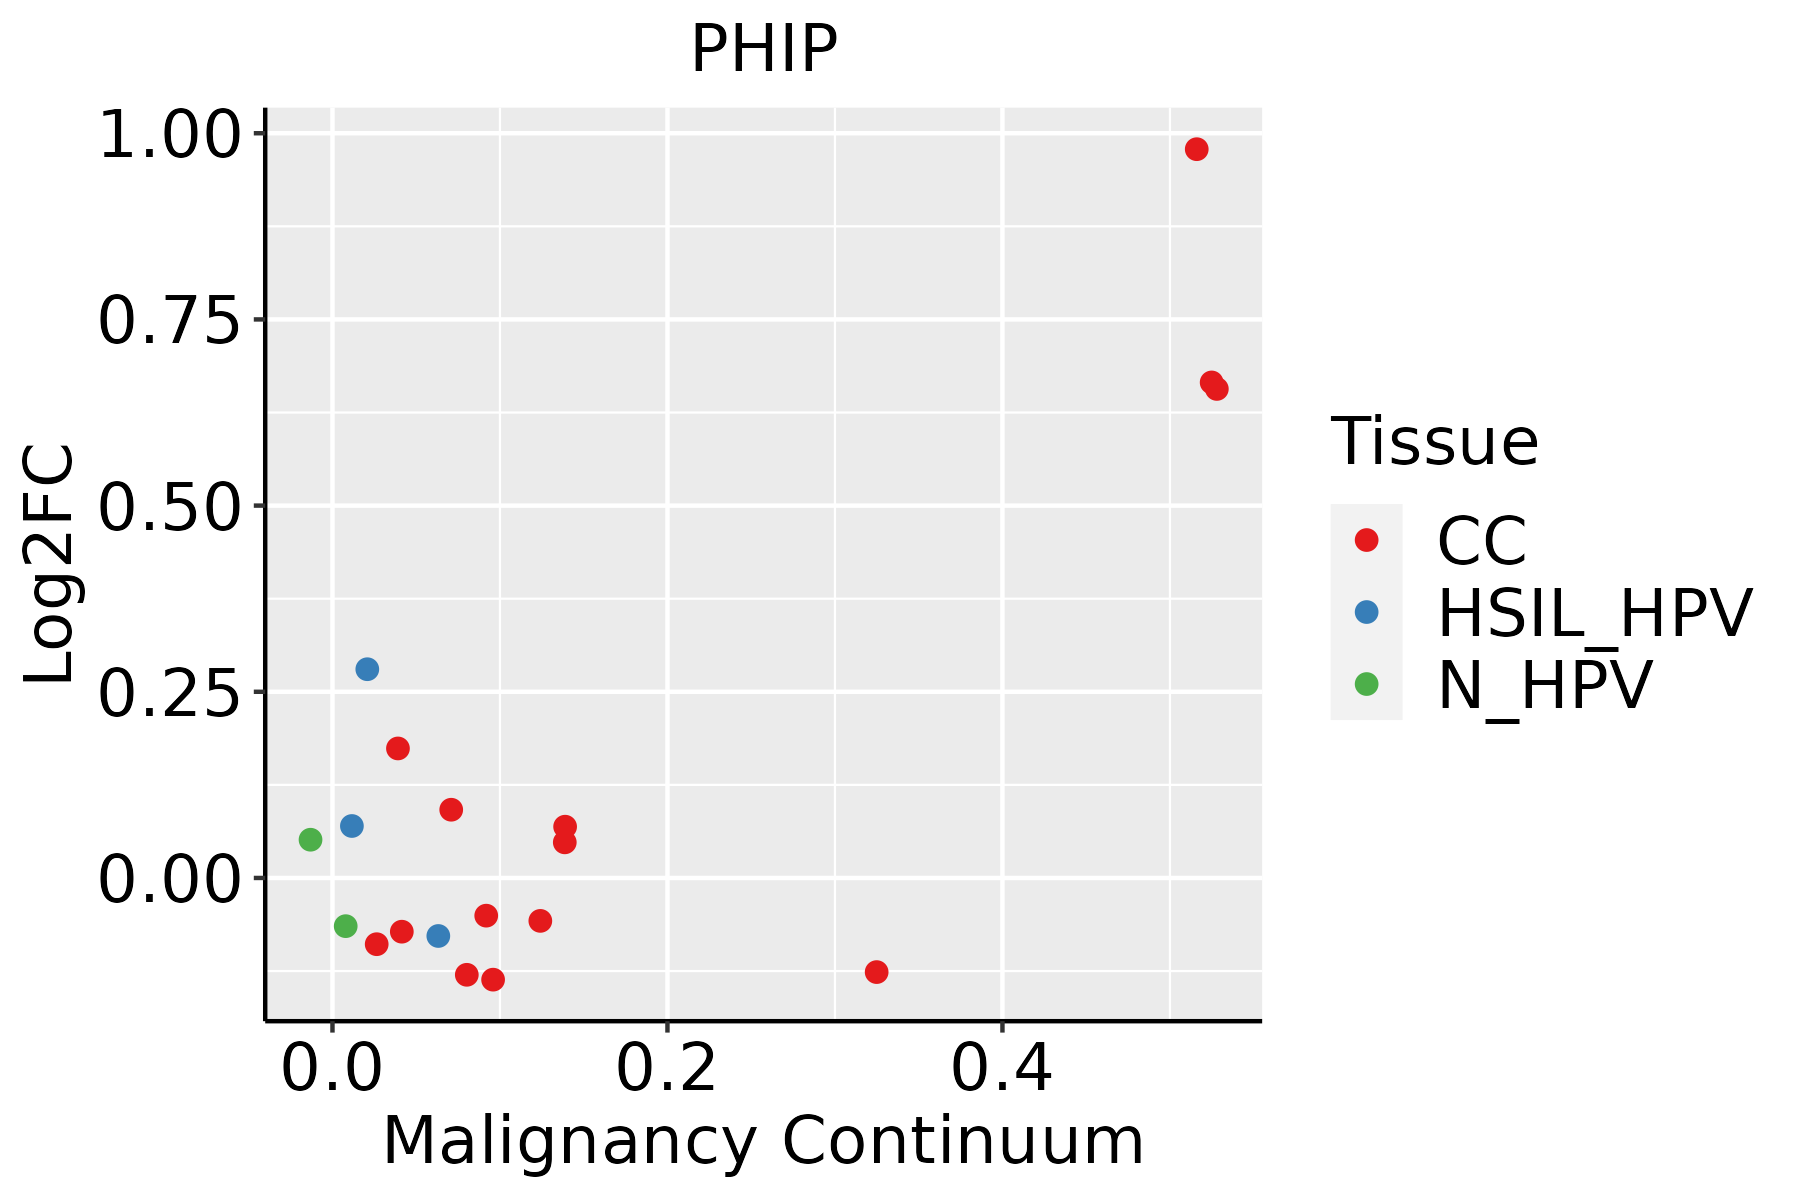 | CC: Cervix cancer |
| HSIL_HPV: HPV-infected high-grade squamous intraepithelial lesions |
| N_HPV: HPV-infected normal cervix |
| Colorectum (GSE201348) |  | FAP: Familial adenomatous polyposis |
| CRC: Colorectal cancer |
| Colorectum (HTA11) |  | AD: Adenomas |
| SER: Sessile serrated lesions |
| MSI-H: Microsatellite-high colorectal cancer |
| MSS: Microsatellite stable colorectal cancer |
| Esophagus | 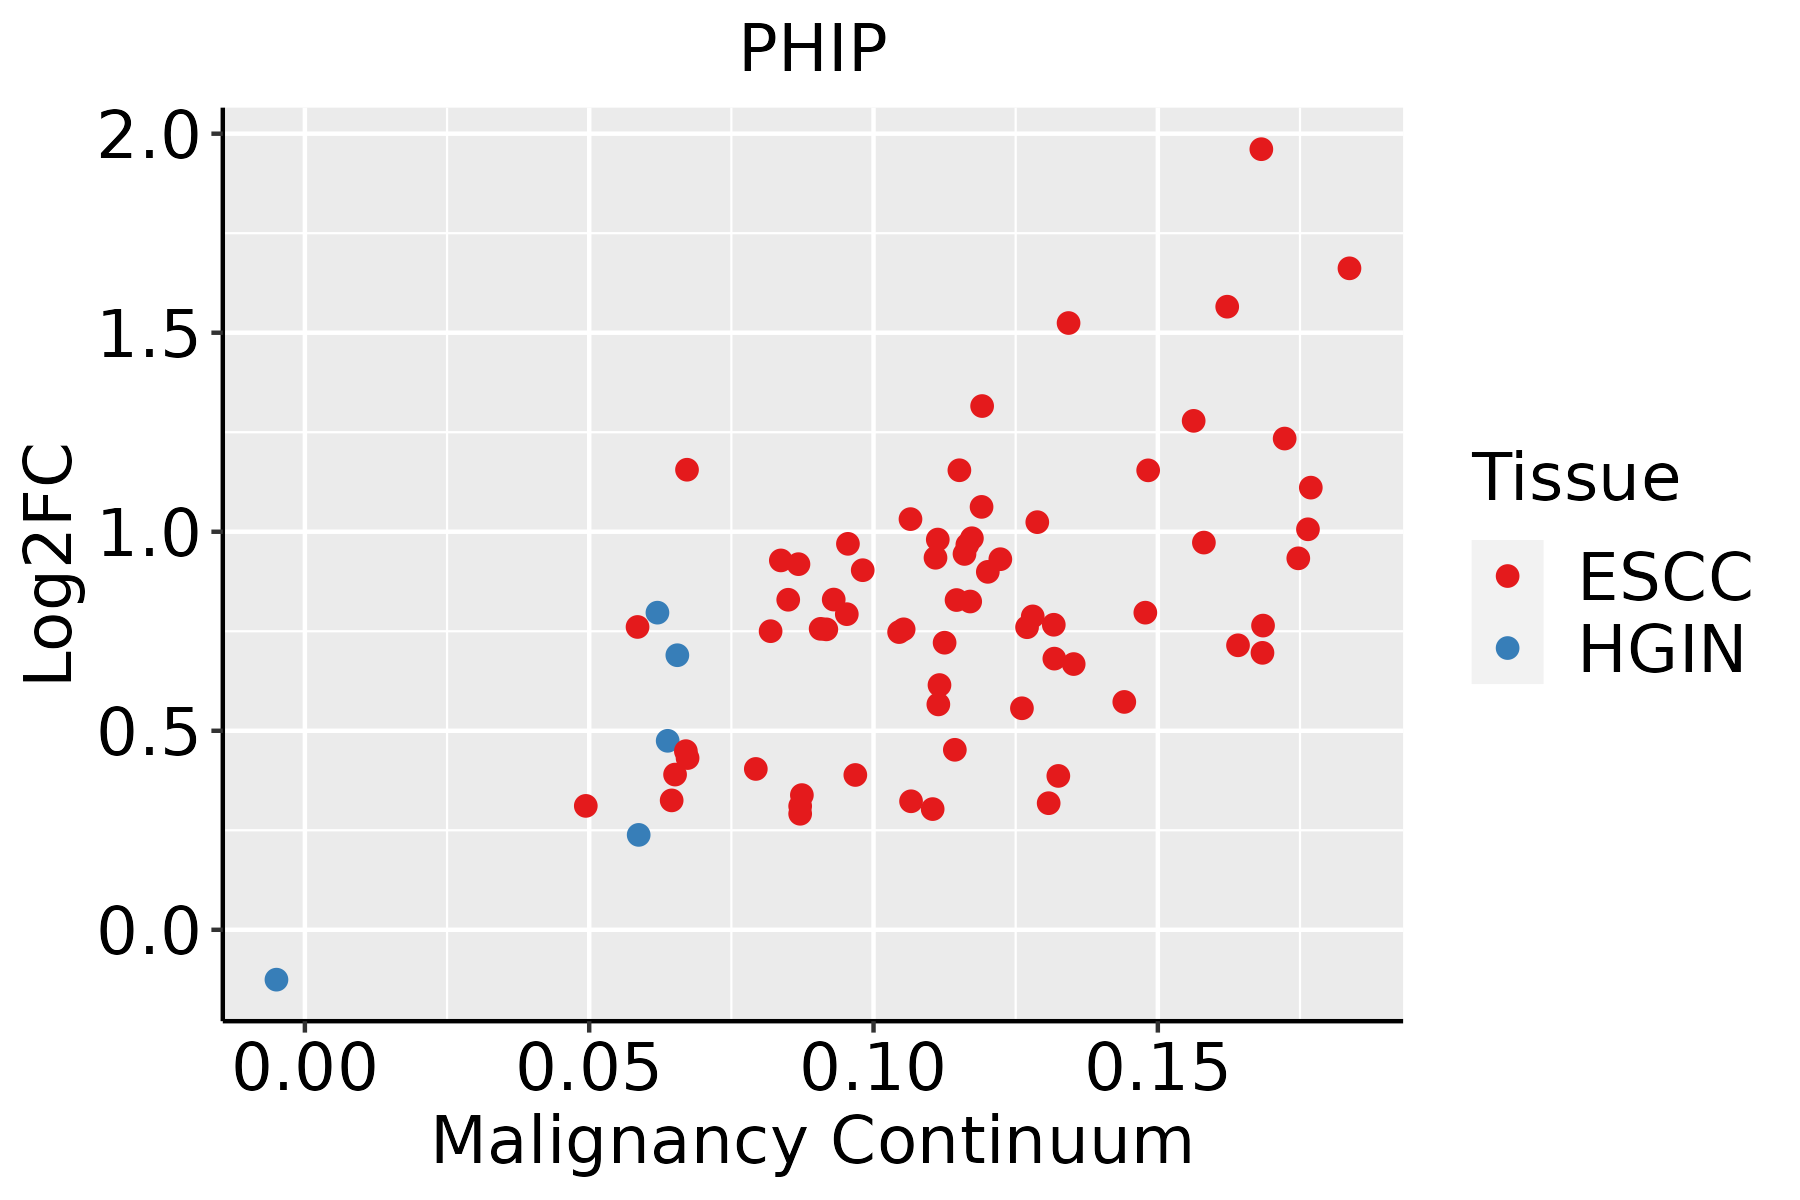 | ESCC: Esophageal squamous cell carcinoma |
| HGIN: High-grade intraepithelial neoplasias |
| LGIN: Low-grade intraepithelial neoplasias |
| Liver | 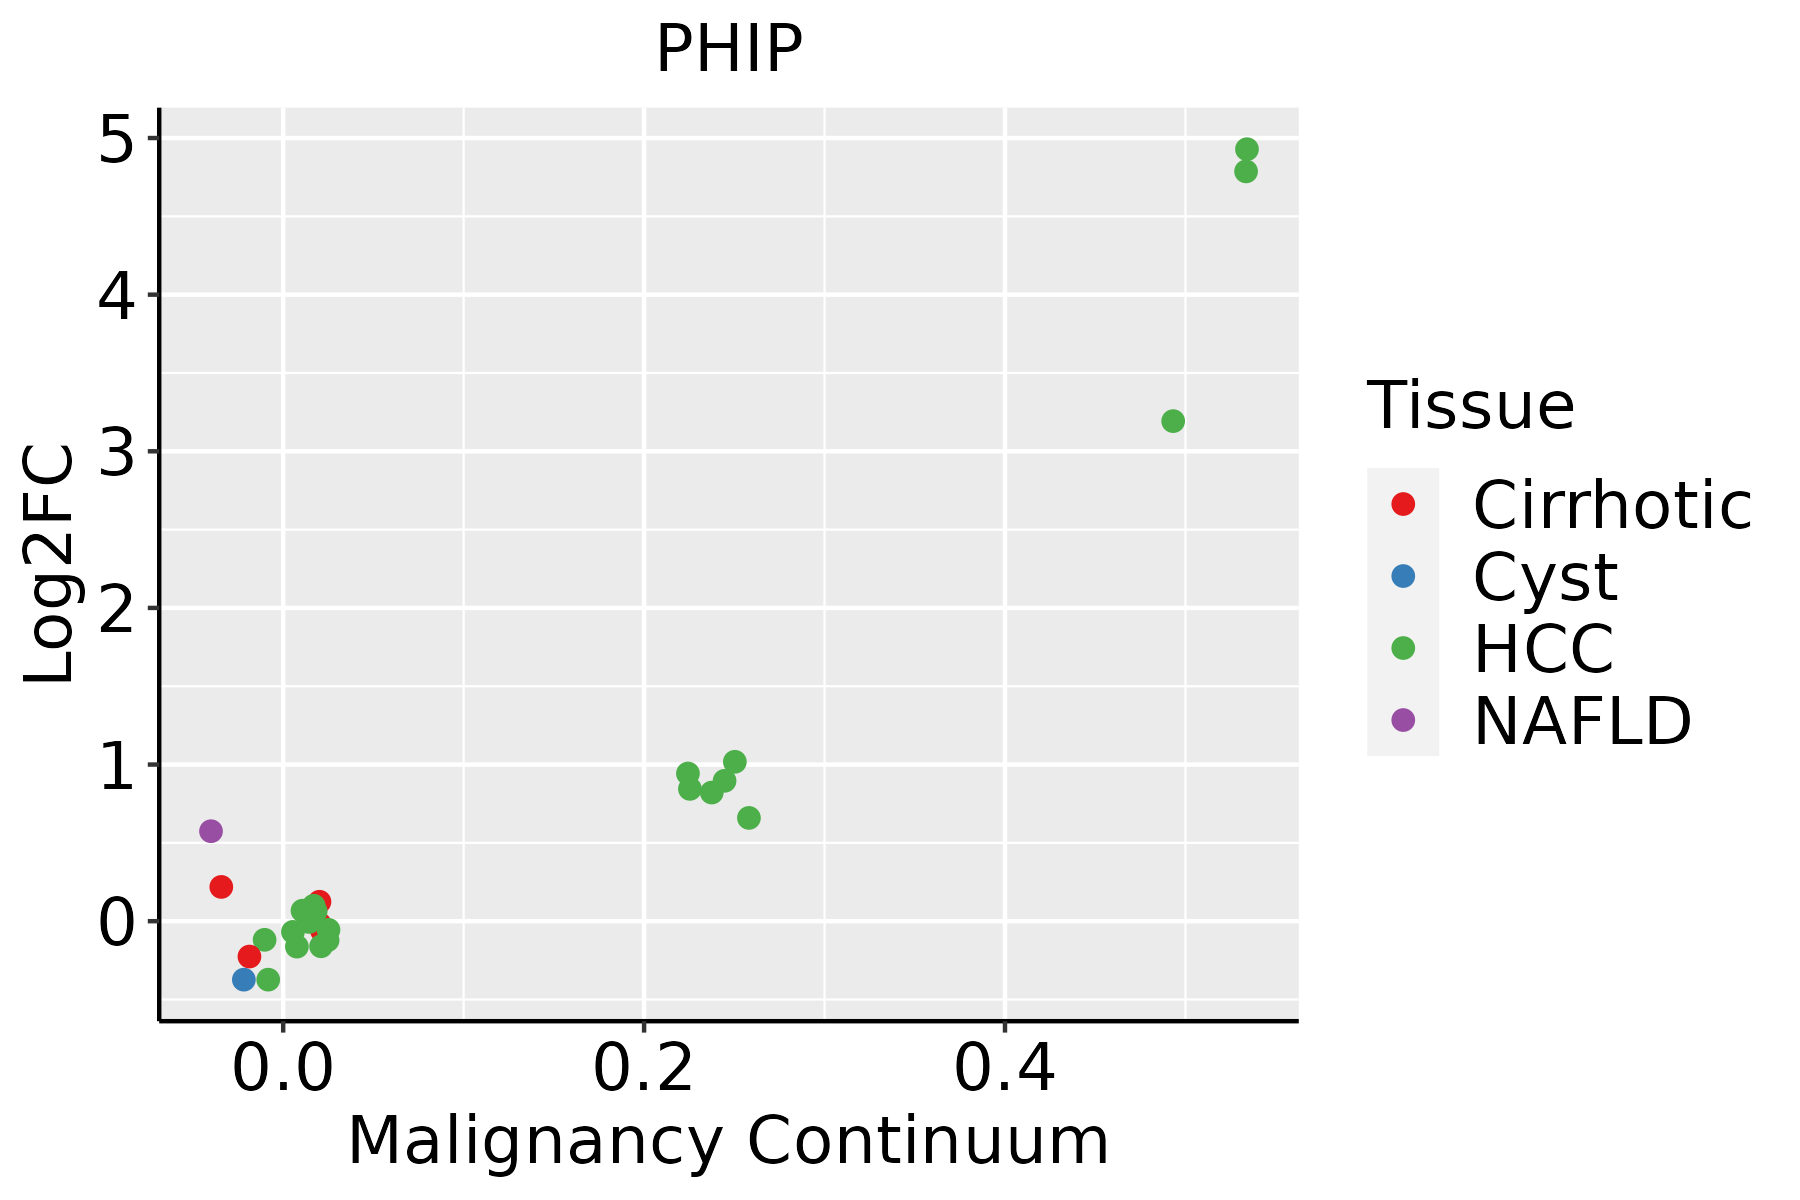 | HCC: Hepatocellular carcinoma |
| NAFLD: Non-alcoholic fatty liver disease |
| Lung | 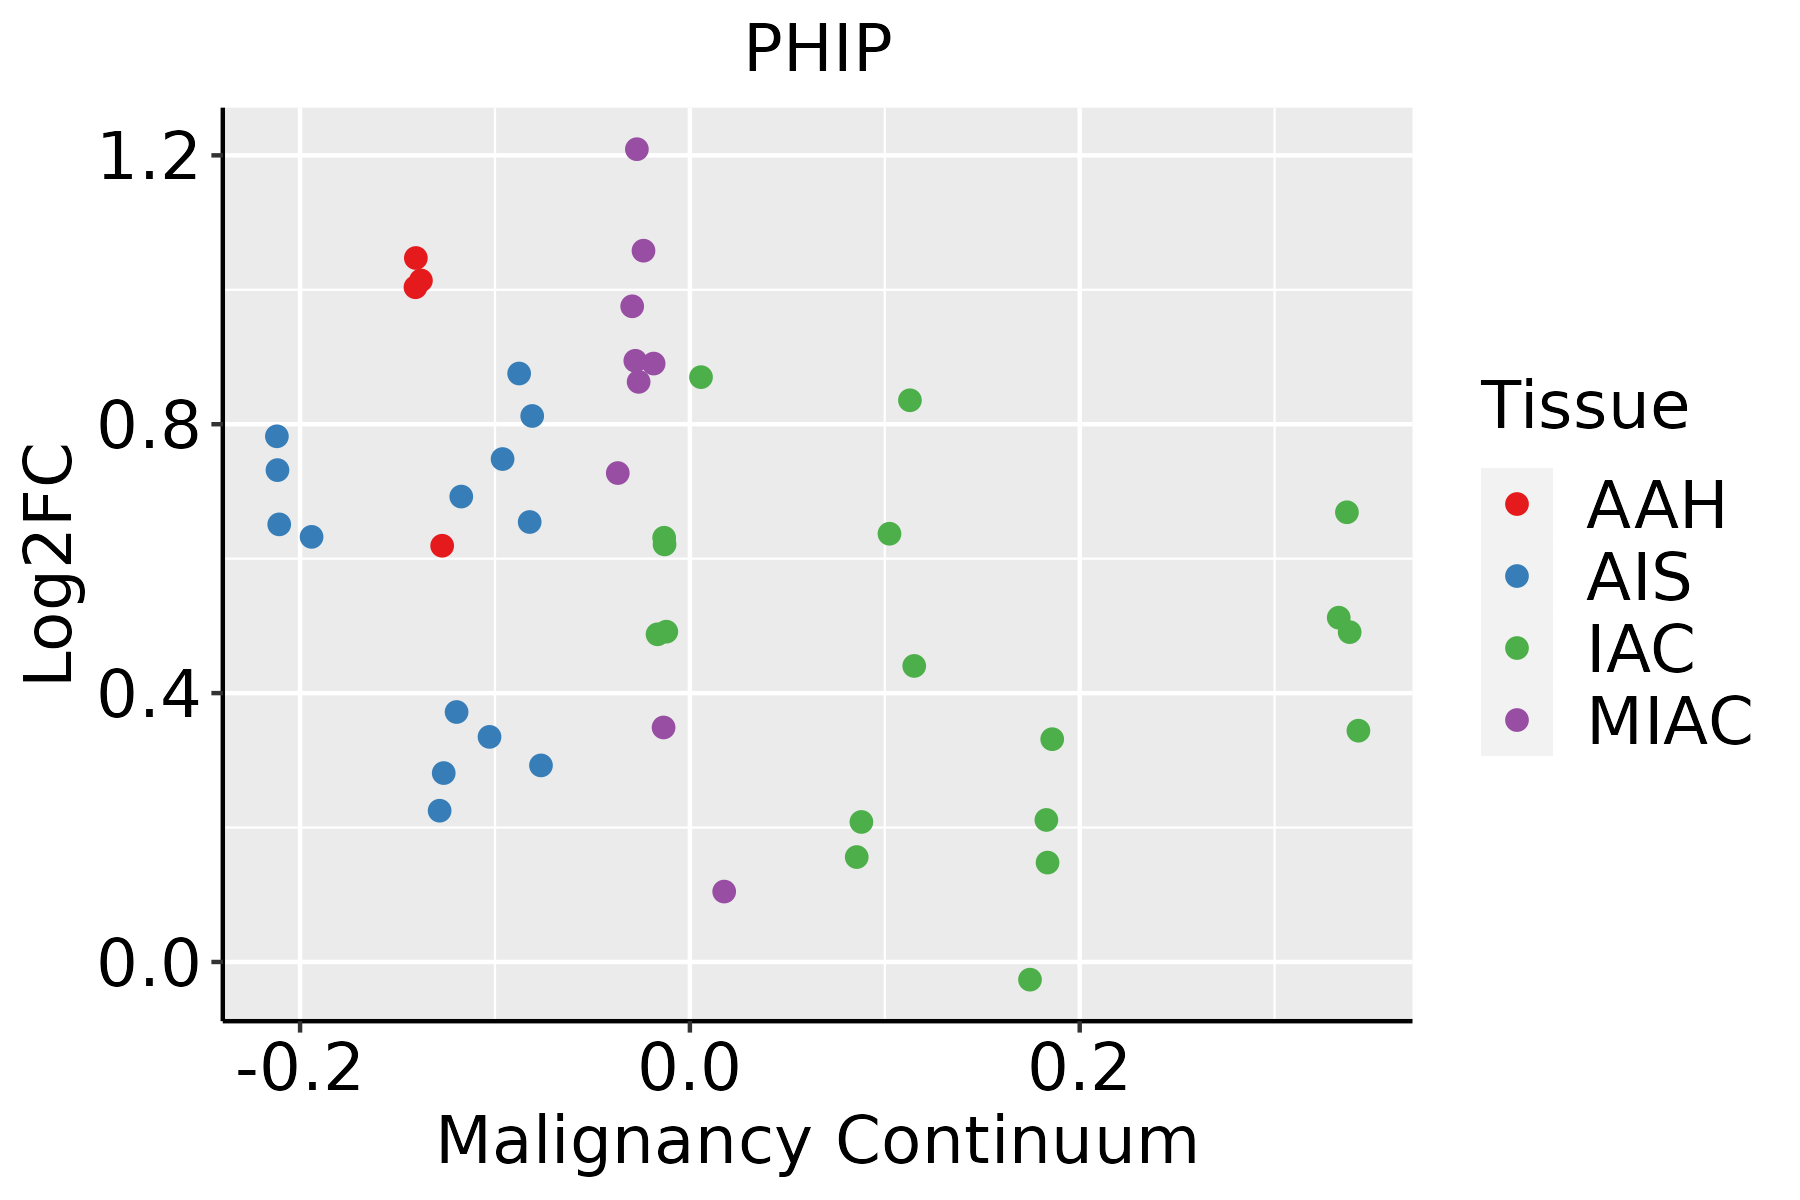 | AAH: Atypical adenomatous hyperplasia |
| AIS: Adenocarcinoma in situ |
| IAC: Invasive lung adenocarcinoma |
| MIA: Minimally invasive adenocarcinoma |
| Oral Cavity | 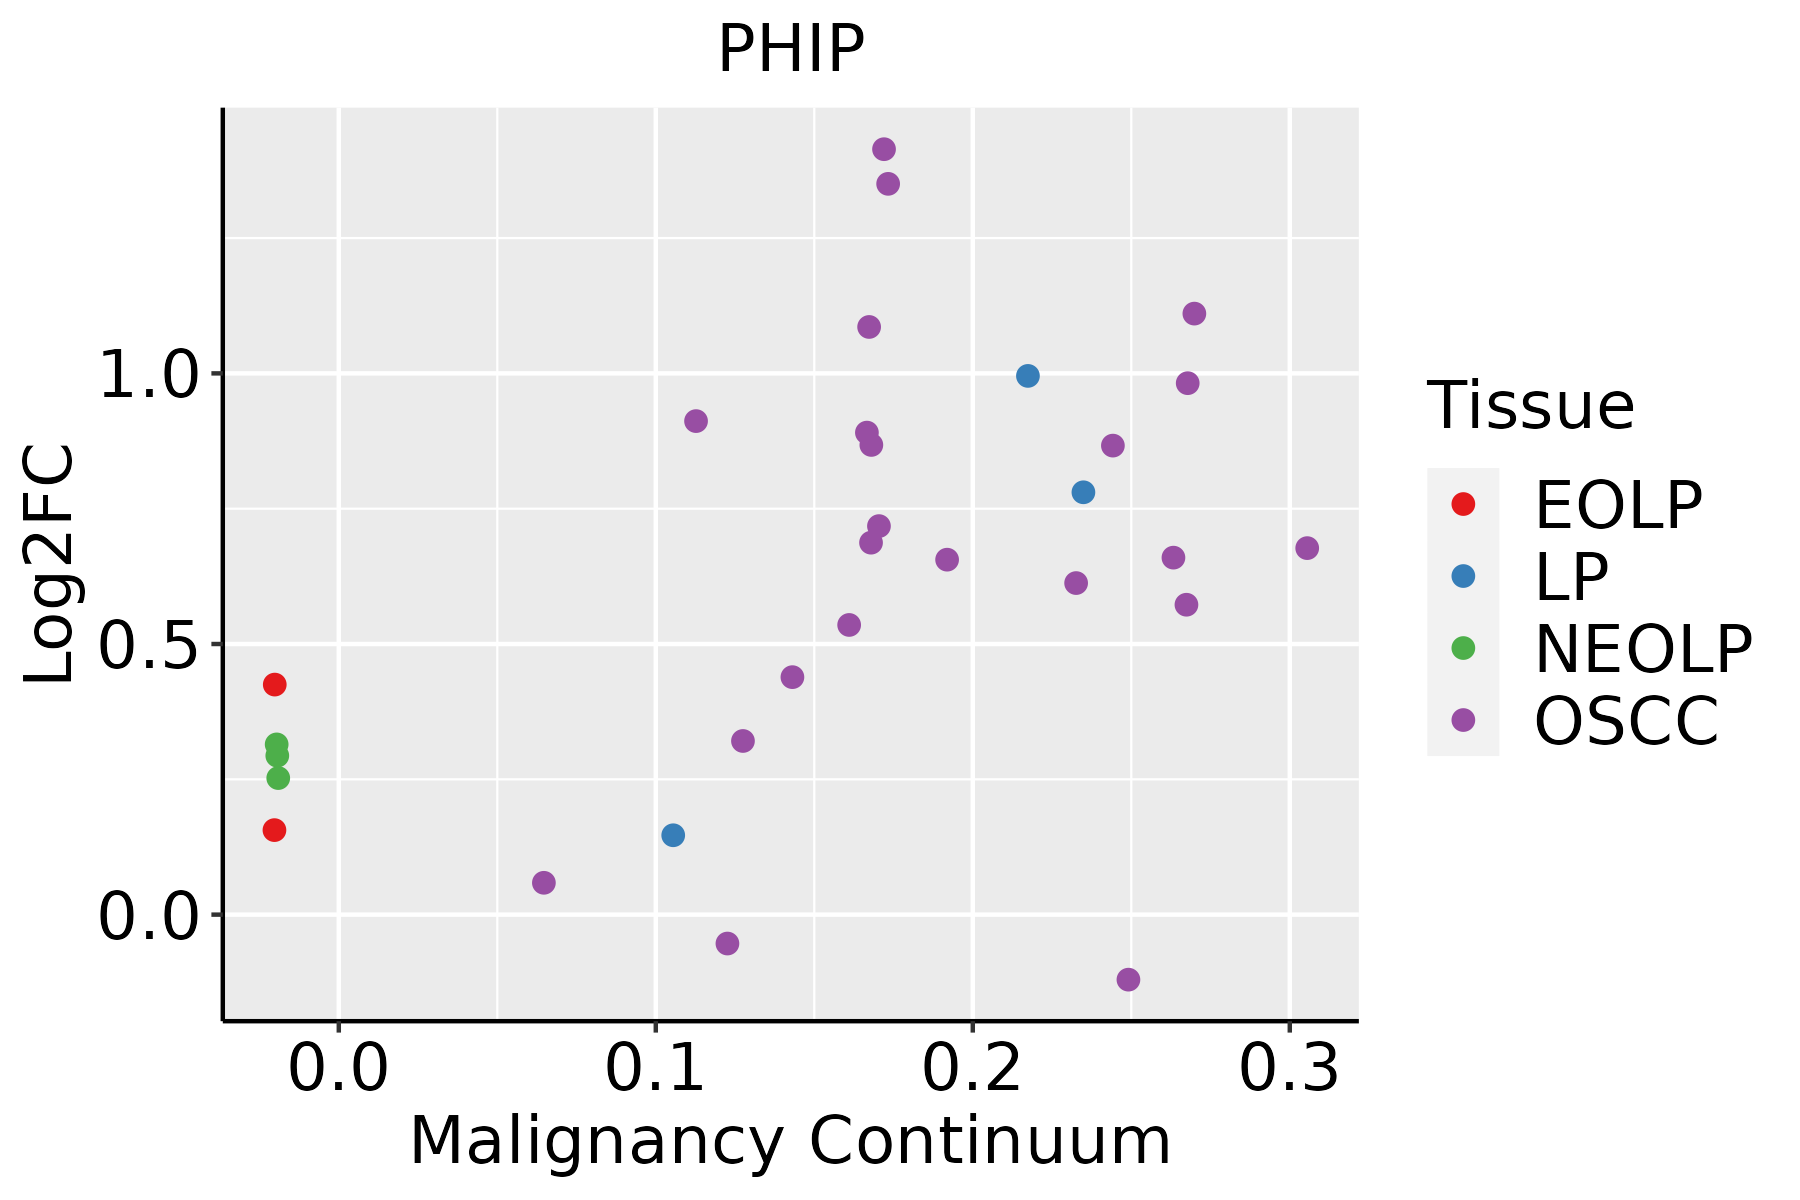 | EOLP: Erosive Oral lichen planus |
| LP: leukoplakia |
| NEOLP: Non-erosive oral lichen planus |
| OSCC: Oral squamous cell carcinoma |
| Prostate | 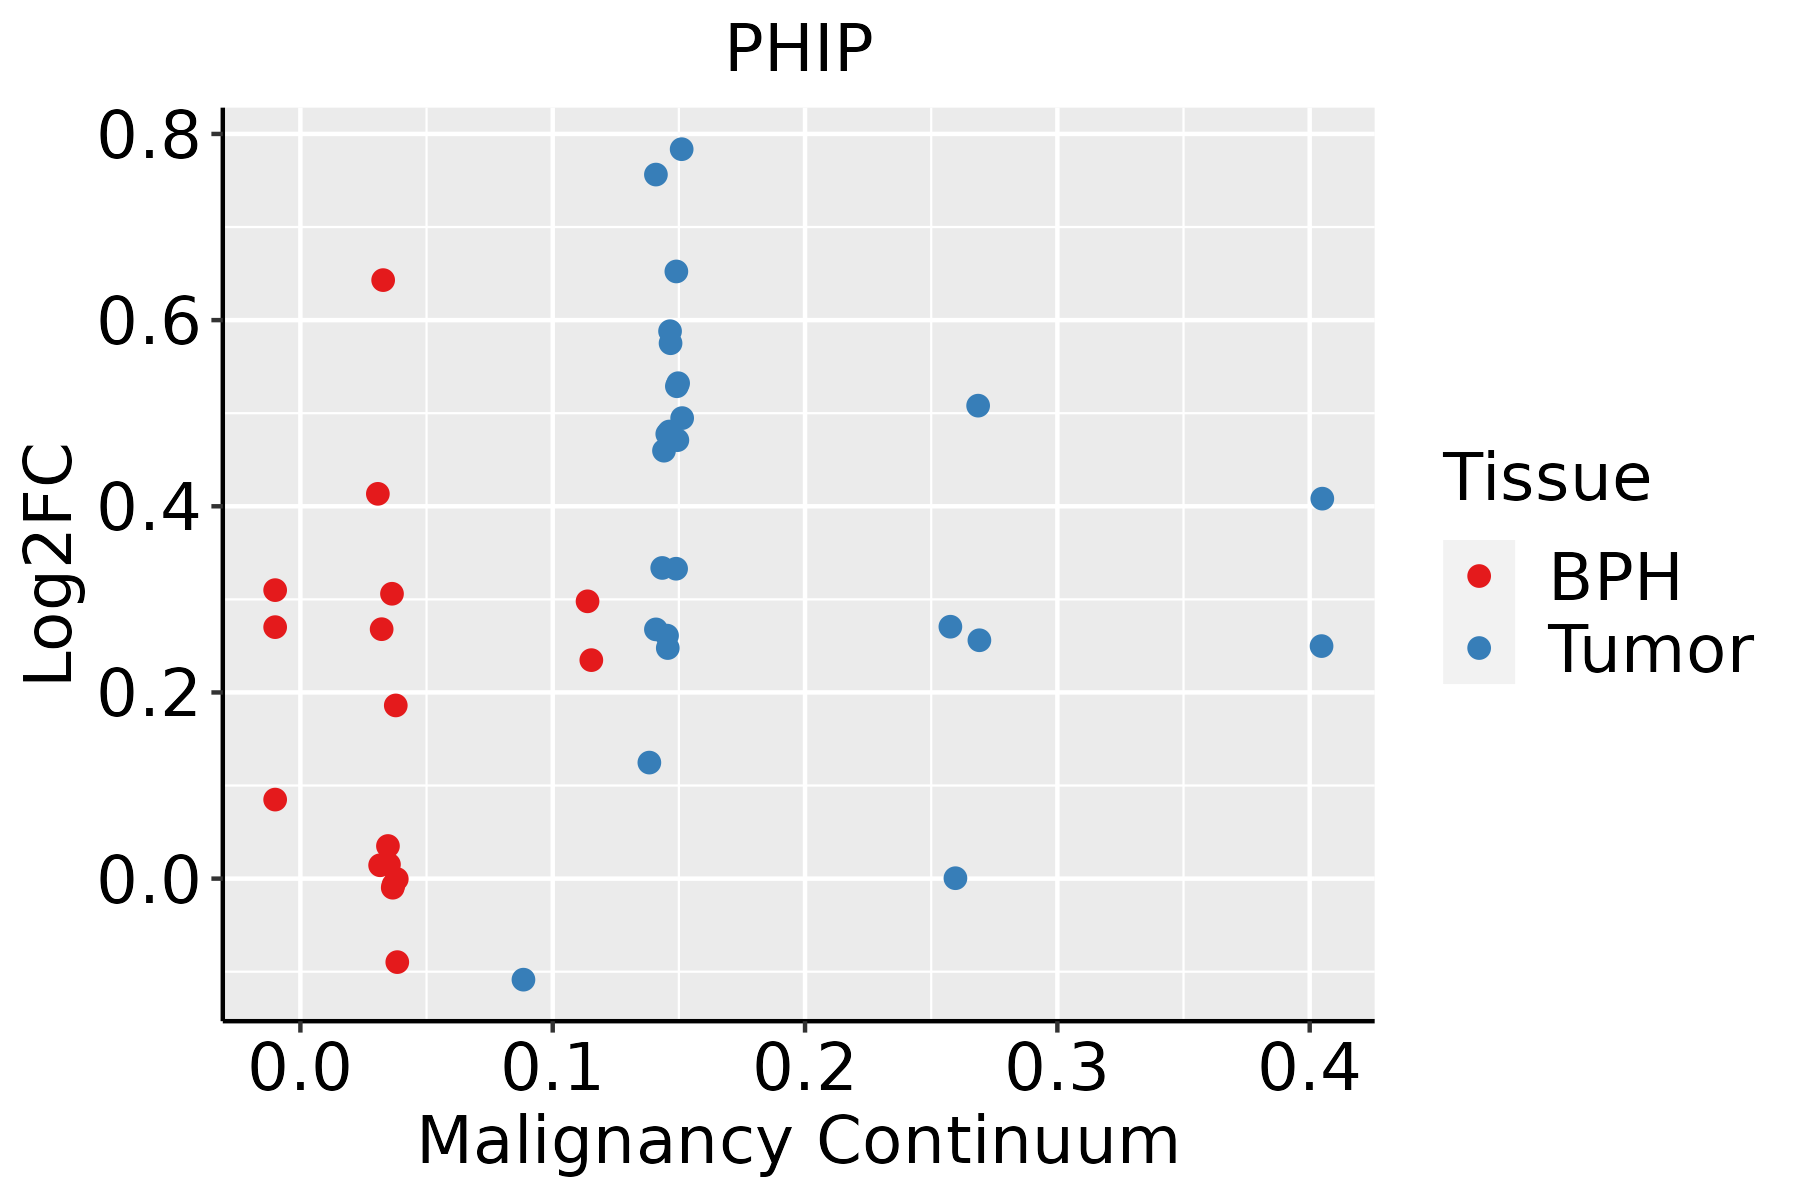 | BPH: Benign Prostatic Hyperplasia |
| Skin | 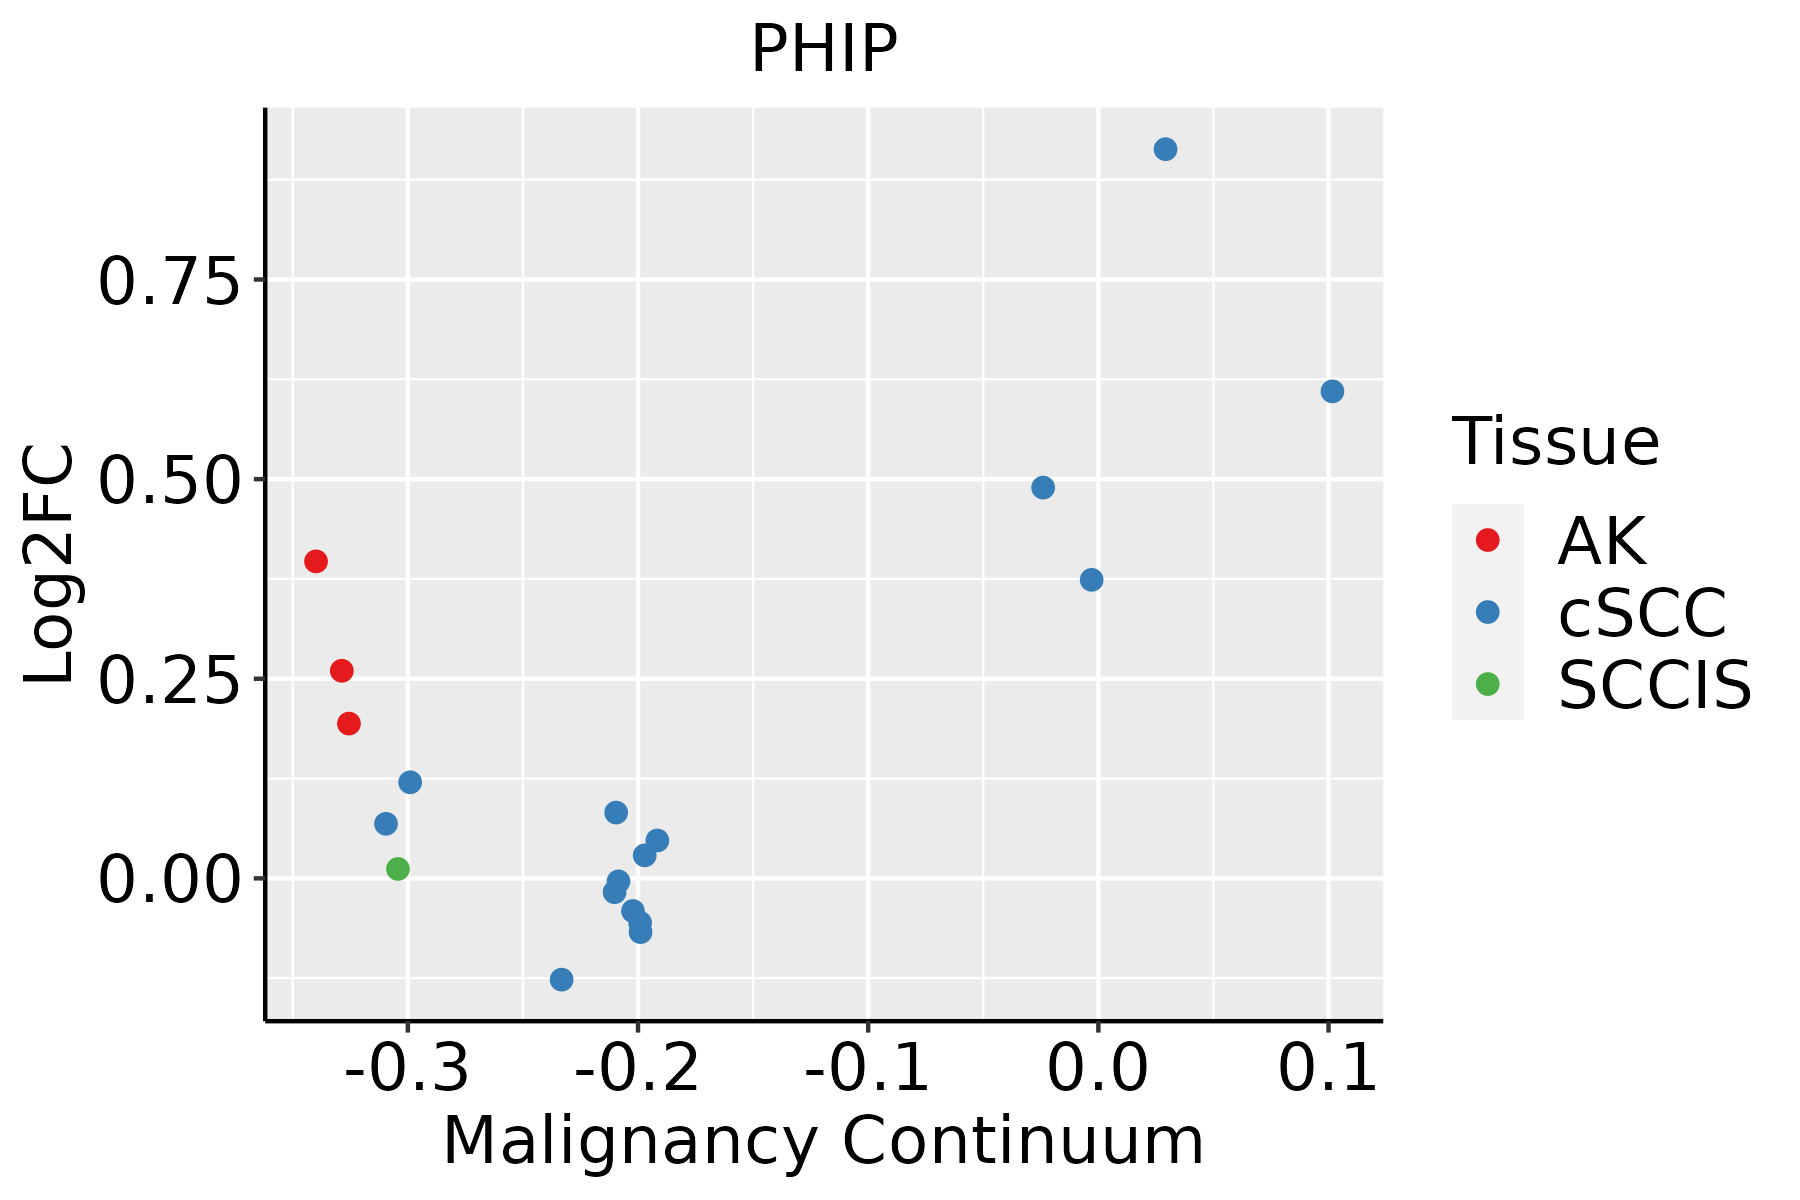 | AK: Actinic keratosis |
| cSCC: Cutaneous squamous cell carcinoma |
| SCCIS:squamous cell carcinoma in situ |
| Thyroid |  | ATC: Anaplastic thyroid cancer |
| HT: Hashimoto's thyroiditis |
| PTC: Papillary thyroid cancer |
| GO ID | Tissue | Disease Stage | Description | Gene Ratio | Bg Ratio | pvalue | p.adjust | Count |
| GO:000836025 | Skin | cSCC | regulation of cell shape | 57/4864 | 154/18723 | 1.61e-03 | 9.90e-03 | 57 |
| GO:200123727 | Skin | cSCC | negative regulation of extrinsic apoptotic signaling pathway | 38/4864 | 97/18723 | 2.95e-03 | 1.64e-02 | 38 |
| GO:000828616 | Skin | cSCC | insulin receptor signaling pathway | 43/4864 | 116/18723 | 5.44e-03 | 2.73e-02 | 43 |
| GO:2001233113 | Thyroid | PTC | regulation of apoptotic signaling pathway | 197/5968 | 356/18723 | 2.58e-20 | 3.69e-18 | 197 |
| GO:0022604112 | Thyroid | PTC | regulation of cell morphogenesis | 165/5968 | 309/18723 | 2.60e-15 | 1.82e-13 | 165 |
| GO:2001234113 | Thyroid | PTC | negative regulation of apoptotic signaling pathway | 124/5968 | 224/18723 | 2.57e-13 | 1.32e-11 | 124 |
| GO:0097191113 | Thyroid | PTC | extrinsic apoptotic signaling pathway | 117/5968 | 219/18723 | 2.73e-11 | 1.03e-09 | 117 |
| GO:000734619 | Thyroid | PTC | regulation of mitotic cell cycle | 212/5968 | 457/18723 | 4.03e-11 | 1.44e-09 | 212 |
| GO:0008360111 | Thyroid | PTC | regulation of cell shape | 86/5968 | 154/18723 | 6.22e-10 | 1.95e-08 | 86 |
| GO:1901653111 | Thyroid | PTC | cellular response to peptide | 169/5968 | 359/18723 | 9.81e-10 | 2.89e-08 | 169 |
| GO:0043434113 | Thyroid | PTC | response to peptide hormone | 188/5968 | 414/18723 | 4.13e-09 | 1.09e-07 | 188 |
| GO:2001236113 | Thyroid | PTC | regulation of extrinsic apoptotic signaling pathway | 82/5968 | 151/18723 | 9.01e-09 | 2.18e-07 | 82 |
| GO:01400148 | Thyroid | PTC | mitotic nuclear division | 135/5968 | 287/18723 | 4.90e-08 | 1.04e-06 | 135 |
| GO:0071375110 | Thyroid | PTC | cellular response to peptide hormone stimulus | 136/5968 | 290/18723 | 5.49e-08 | 1.17e-06 | 136 |
| GO:004578718 | Thyroid | PTC | positive regulation of cell cycle | 144/5968 | 313/18723 | 9.93e-08 | 1.99e-06 | 144 |
| GO:0032869111 | Thyroid | PTC | cellular response to insulin stimulus | 100/5968 | 203/18723 | 1.70e-07 | 3.19e-06 | 100 |
| GO:0032868111 | Thyroid | PTC | response to insulin | 124/5968 | 264/18723 | 1.87e-07 | 3.47e-06 | 124 |
| GO:2001237113 | Thyroid | PTC | negative regulation of extrinsic apoptotic signaling pathway | 51/5968 | 97/18723 | 1.83e-05 | 1.88e-04 | 51 |
| GO:000828617 | Thyroid | PTC | insulin receptor signaling pathway | 58/5968 | 116/18723 | 3.59e-05 | 3.36e-04 | 58 |
| GO:009006816 | Thyroid | PTC | positive regulation of cell cycle process | 103/5968 | 236/18723 | 9.03e-05 | 7.50e-04 | 103 |
| Hugo Symbol | Variant Class | Variant Classification | dbSNP RS | HGVSc | HGVSp | HGVSp Short | SWISSPROT | BIOTYPE | SIFT | PolyPhen | Tumor Sample Barcode | Tissue | Histology | Sex | Age | Stage | Therapy Types | Drugs | Outcome |
| PHIP | SNV | Missense_Mutation | novel | c.4808N>T | p.Ser1603Leu | p.S1603L | Q8WWQ0 | protein_coding | tolerated_low_confidence(0.27) | benign(0.154) | TCGA-AO-A03P-01 | Breast | breast invasive carcinoma | Female | <65 | I/II | Hormone Therapy | letrozole | PD |
| PHIP | SNV | Missense_Mutation | rs200729688 | c.4529N>A | p.Arg1510Gln | p.R1510Q | Q8WWQ0 | protein_coding | tolerated_low_confidence(0.08) | benign(0.388) | TCGA-AO-A0J5-01 | Breast | breast invasive carcinoma | Female | <65 | III/IV | Other, specify in notesBisphosphonate | zoledronic | PD |
| PHIP | SNV | Missense_Mutation | rs754515374 | c.4120N>G | p.Asn1374Asp | p.N1374D | Q8WWQ0 | protein_coding | deleterious(0.03) | benign(0.003) | TCGA-B6-A1KF-01 | Breast | breast invasive carcinoma | Female | >=65 | I/II | Unknown | Unknown | SD |
| PHIP | SNV | Missense_Mutation | | c.3457N>A | p.Asp1153Asn | p.D1153N | Q8WWQ0 | protein_coding | deleterious(0.04) | benign(0.321) | TCGA-BH-A0HP-01 | Breast | breast invasive carcinoma | Female | >=65 | III/IV | Chemotherapy | doxorubicin | SD |
| PHIP | SNV | Missense_Mutation | | c.2326N>A | p.Ala776Thr | p.A776T | Q8WWQ0 | protein_coding | tolerated(0.63) | benign(0) | TCGA-BH-A18G-01 | Breast | breast invasive carcinoma | Female | >=65 | I/II | Unknown | Unknown | SD |
| PHIP | SNV | Missense_Mutation | | c.3929G>A | p.Arg1310His | p.R1310H | Q8WWQ0 | protein_coding | deleterious(0.01) | probably_damaging(0.987) | TCGA-BH-A5IZ-01 | Breast | breast invasive carcinoma | Female | <65 | I/II | Chemotherapy | adriamycin | CR |
| PHIP | SNV | Missense_Mutation | | c.3754N>A | p.Val1252Met | p.V1252M | Q8WWQ0 | protein_coding | deleterious(0) | probably_damaging(0.994) | TCGA-BH-A6R8-01 | Breast | breast invasive carcinoma | Female | <65 | I/II | Unknown | Unknown | SD |
| PHIP | SNV | Missense_Mutation | | c.2887N>A | p.Glu963Lys | p.E963K | Q8WWQ0 | protein_coding | deleterious(0) | benign(0.07) | TCGA-C8-A12T-01 | Breast | breast invasive carcinoma | Female | <65 | I/II | Unknown | Unknown | SD |
| PHIP | SNV | Missense_Mutation | | c.1292N>A | p.Ala431Asp | p.A431D | Q8WWQ0 | protein_coding | deleterious(0) | possibly_damaging(0.908) | TCGA-E9-A1RF-01 | Breast | breast invasive carcinoma | Female | >=65 | III/IV | Hormone Therapy | tamoxiphen | SD |
| PHIP | SNV | Missense_Mutation | | c.4031N>G | p.Pro1344Arg | p.P1344R | Q8WWQ0 | protein_coding | deleterious(0) | probably_damaging(1) | TCGA-GM-A2DH-01 | Breast | breast invasive carcinoma | Female | <65 | I/II | Chemotherapy | taxol | CR |


