| Tissue | Expression Dynamics | Abbreviation |
| Cervix |  | CC: Cervix cancer |
| HSIL_HPV: HPV-infected high-grade squamous intraepithelial lesions |
| N_HPV: HPV-infected normal cervix |
| Endometrium | 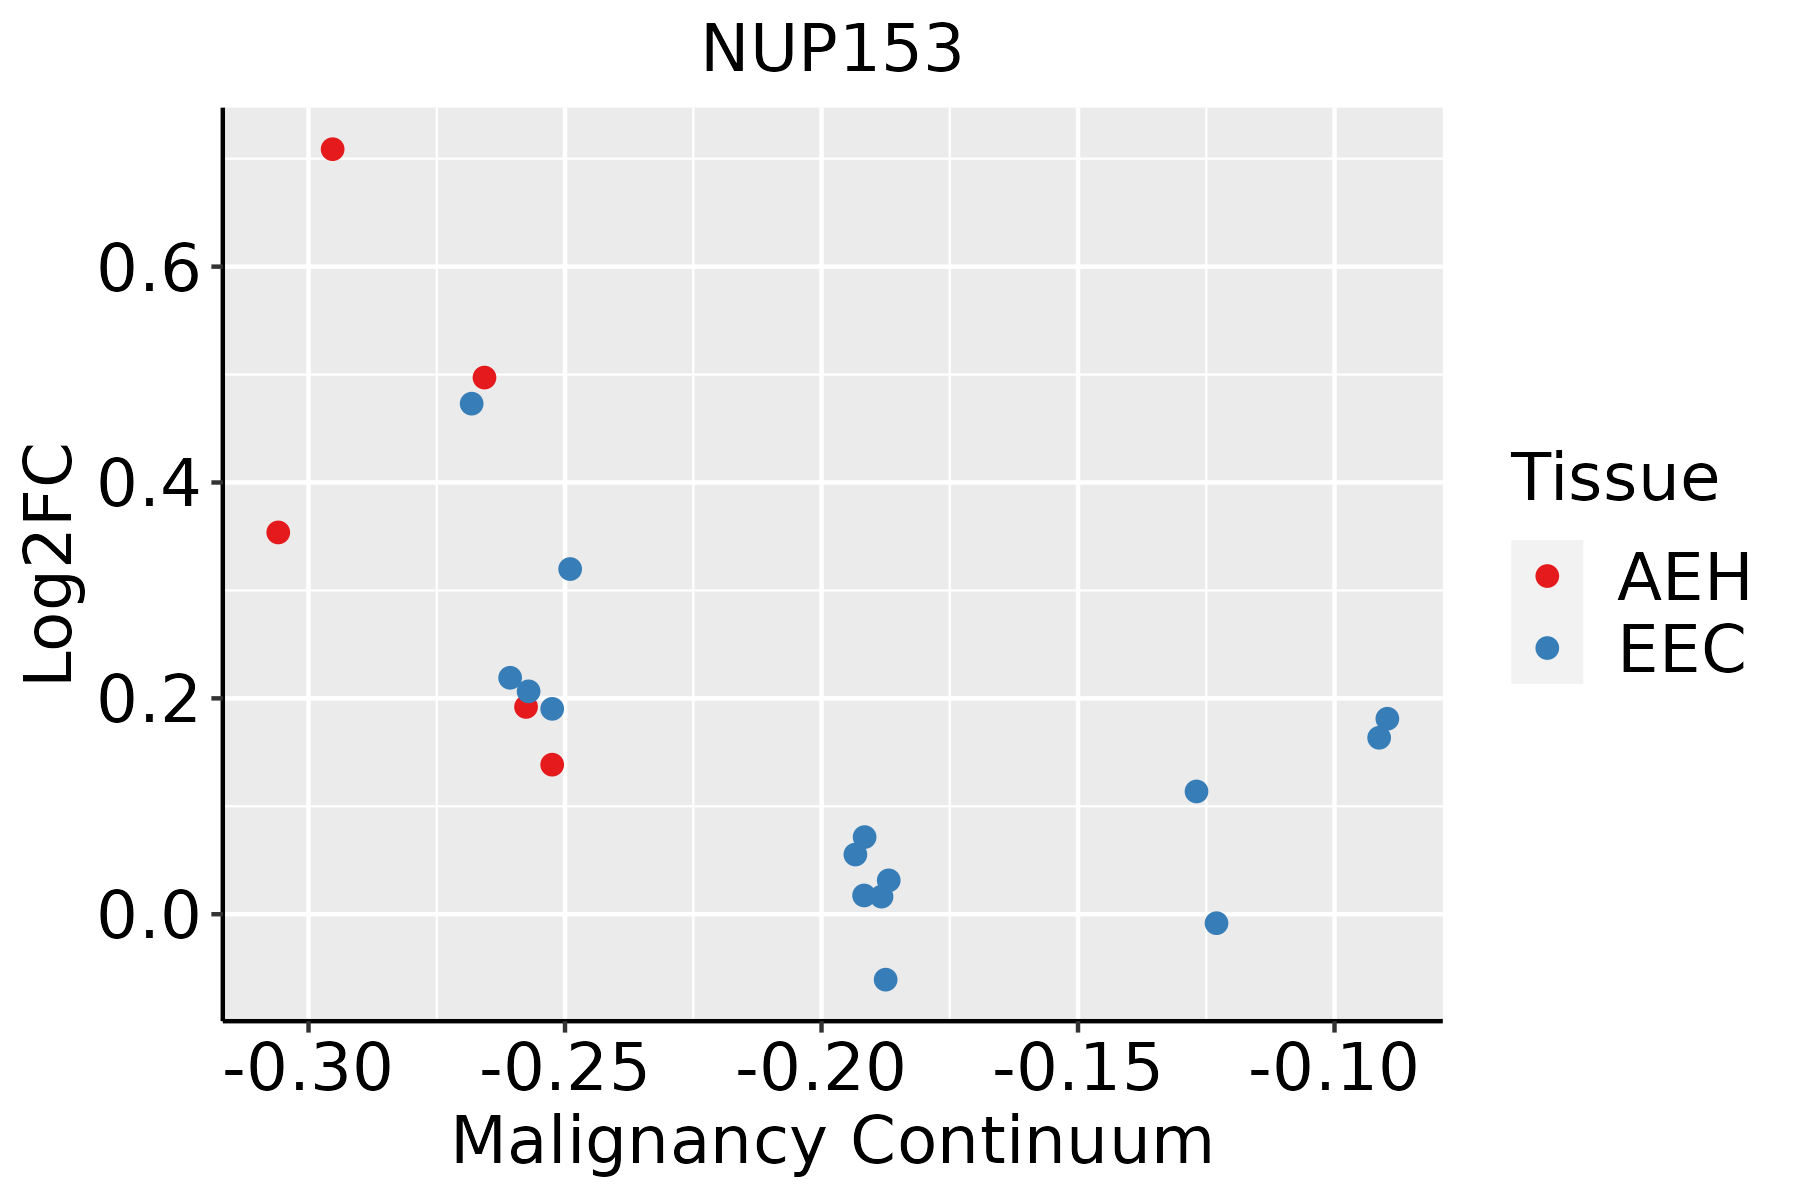 | AEH: Atypical endometrial hyperplasia |
| EEC: Endometrioid Cancer |
| Esophagus | 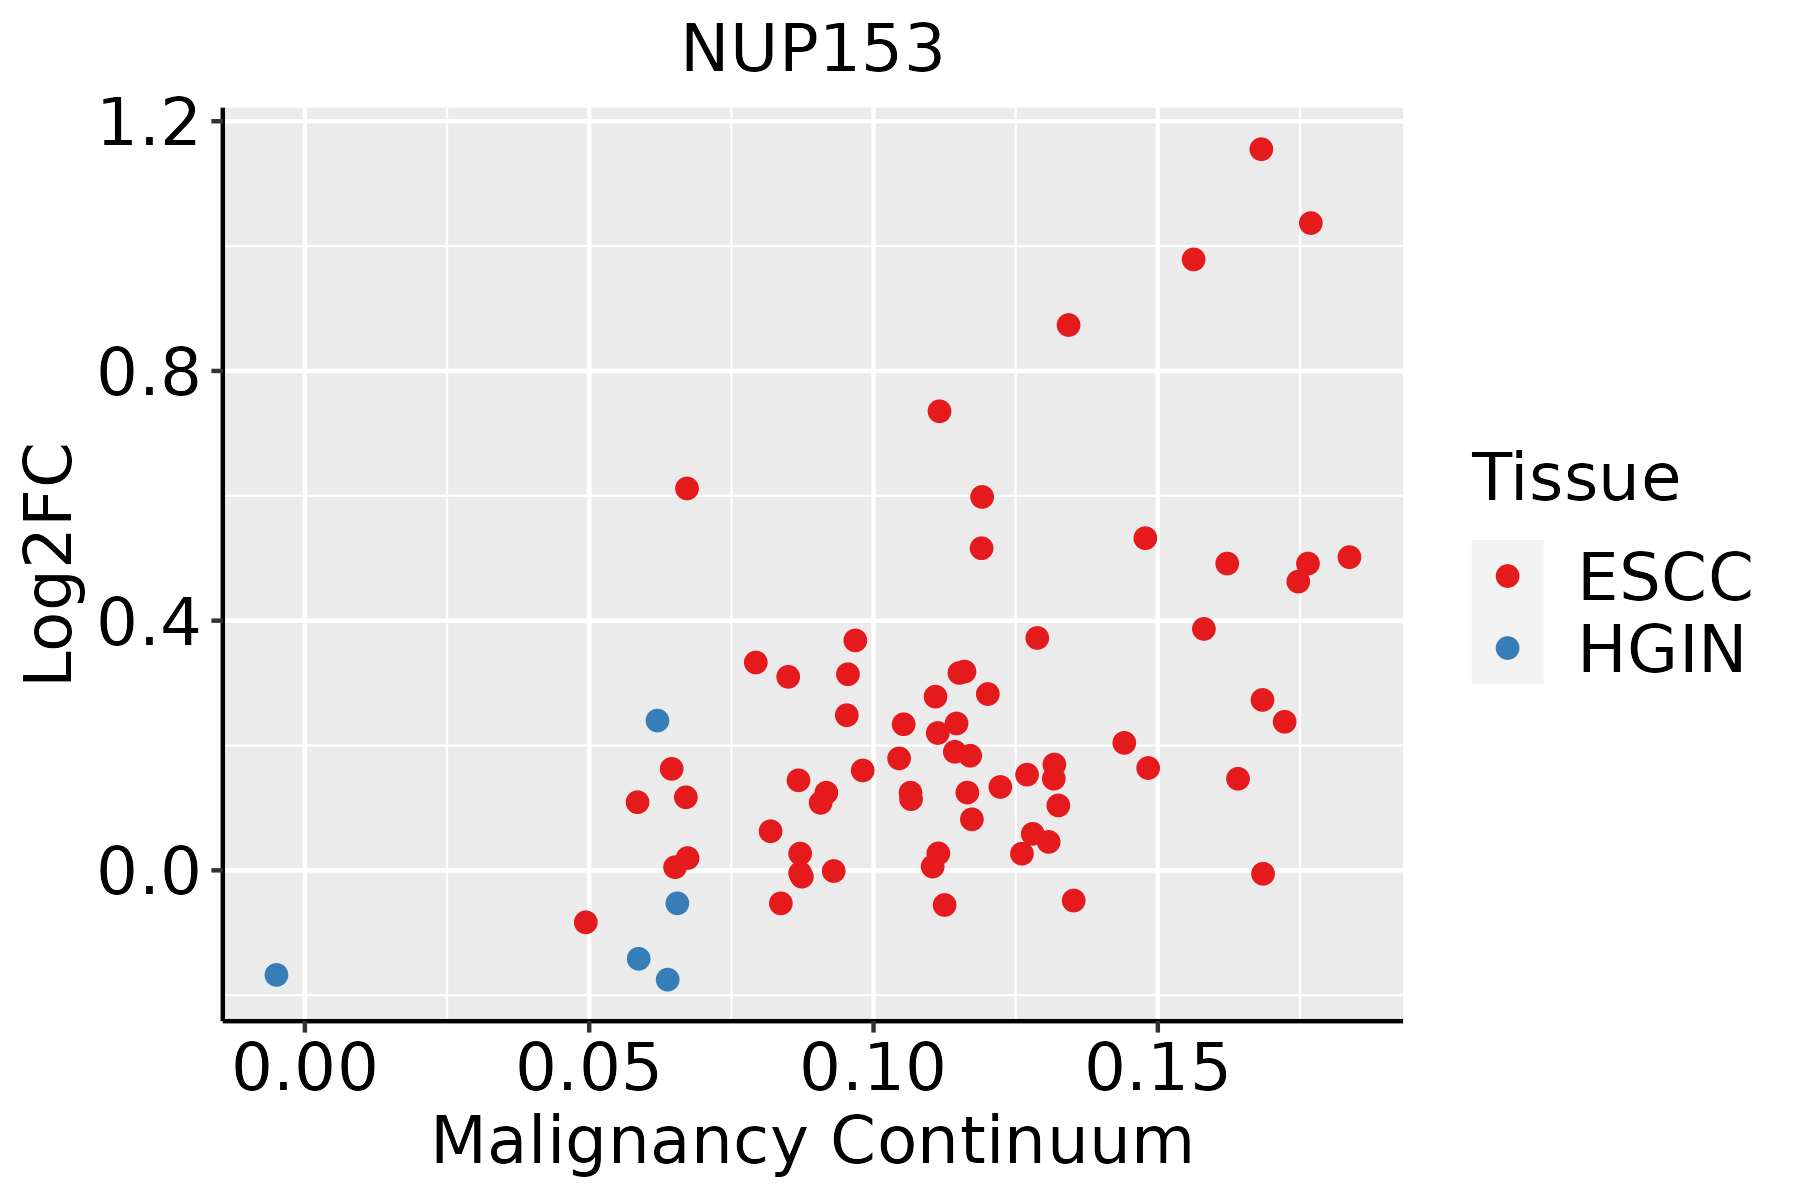 | ESCC: Esophageal squamous cell carcinoma |
| HGIN: High-grade intraepithelial neoplasias |
| LGIN: Low-grade intraepithelial neoplasias |
| Liver | 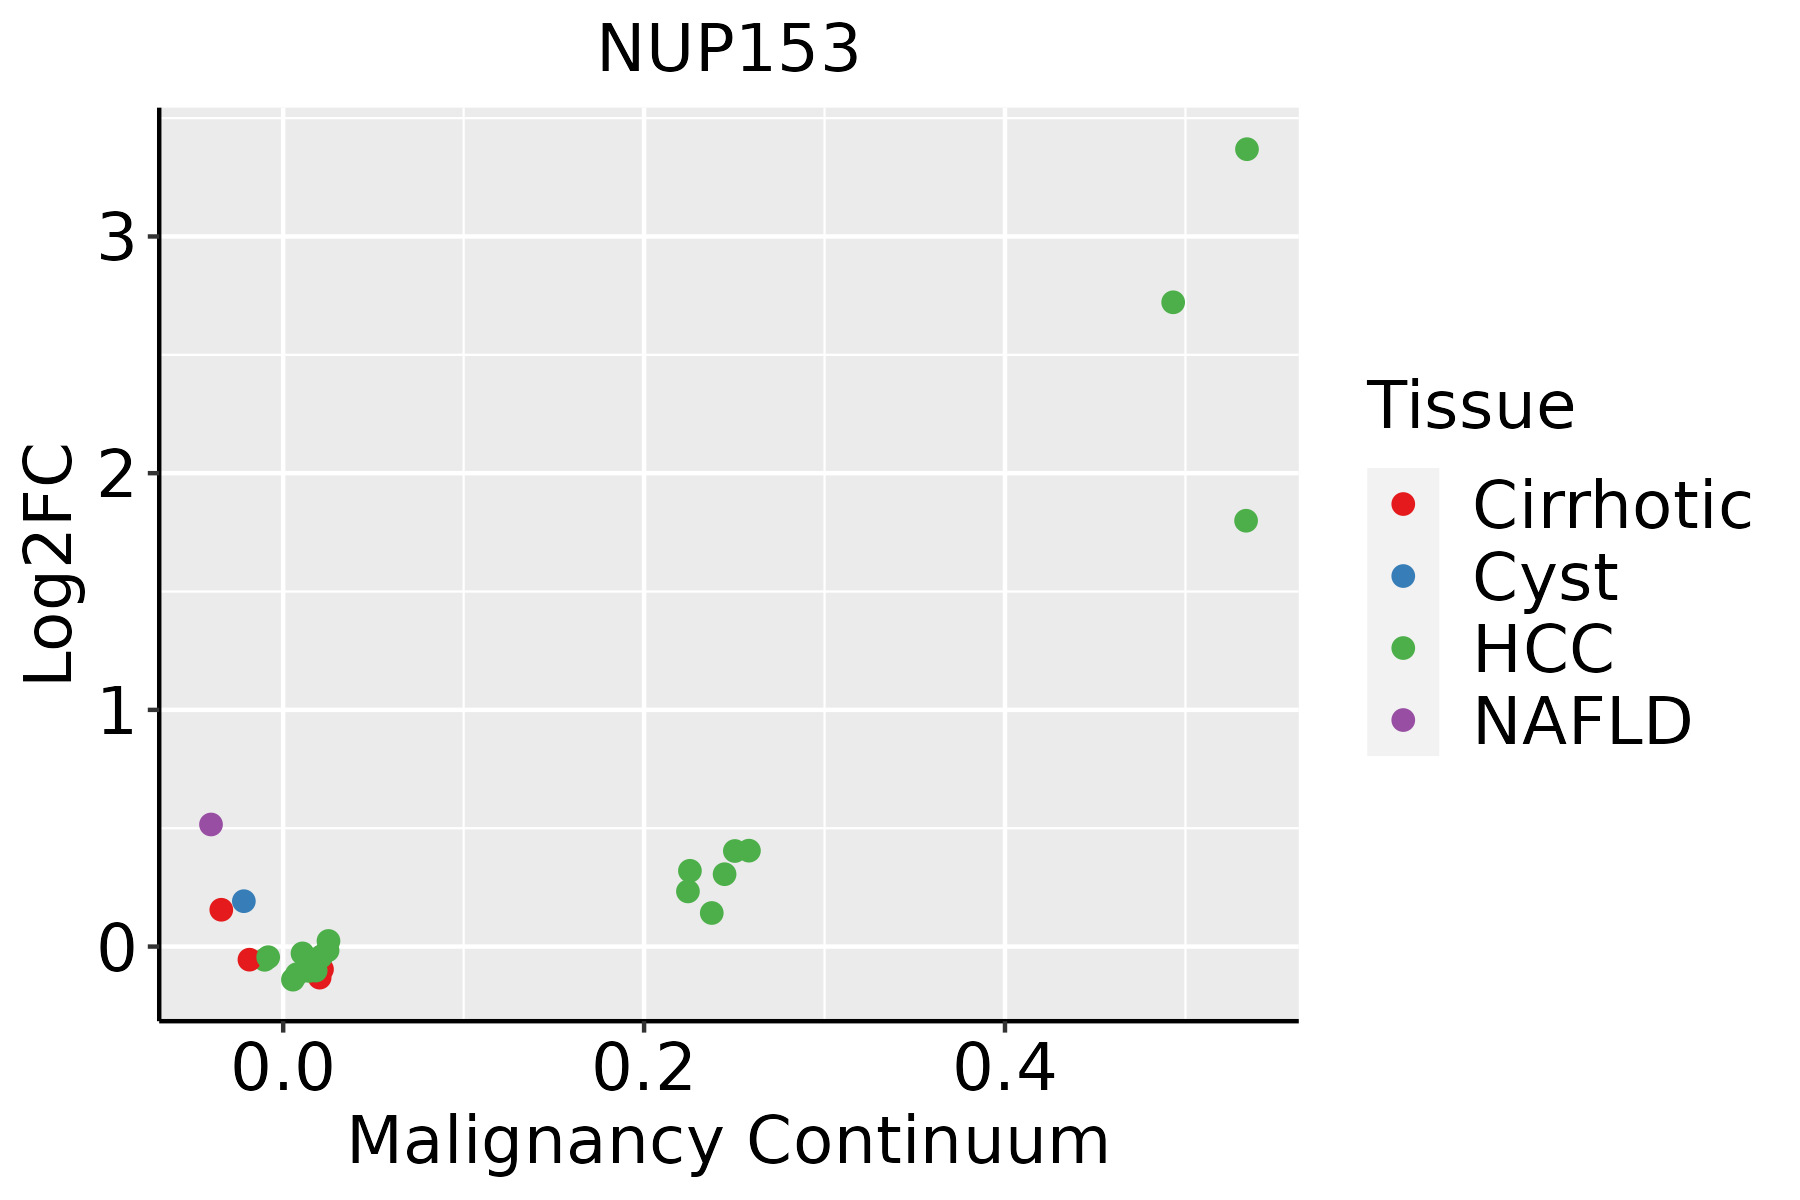 | HCC: Hepatocellular carcinoma |
| NAFLD: Non-alcoholic fatty liver disease |
| Lung | 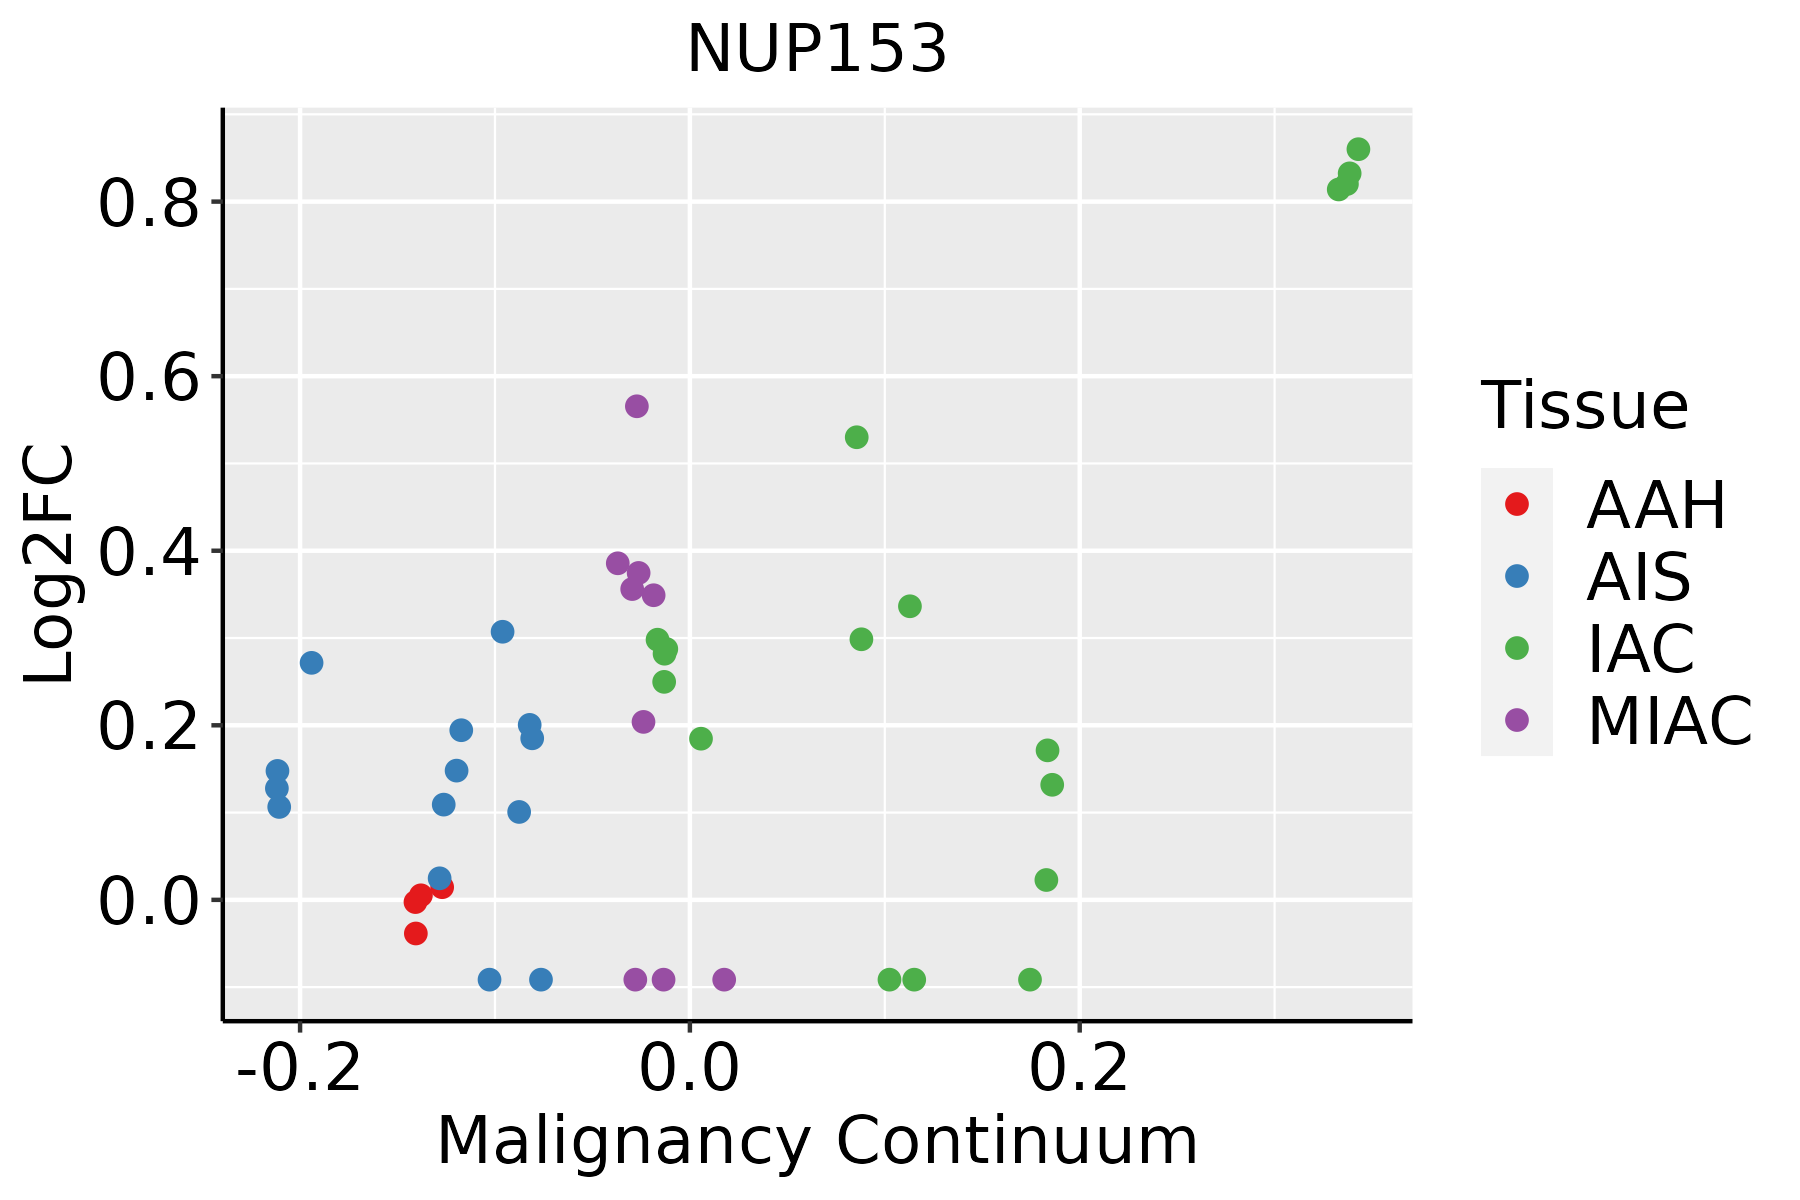 | AAH: Atypical adenomatous hyperplasia |
| AIS: Adenocarcinoma in situ |
| IAC: Invasive lung adenocarcinoma |
| MIA: Minimally invasive adenocarcinoma |
| Oral Cavity | 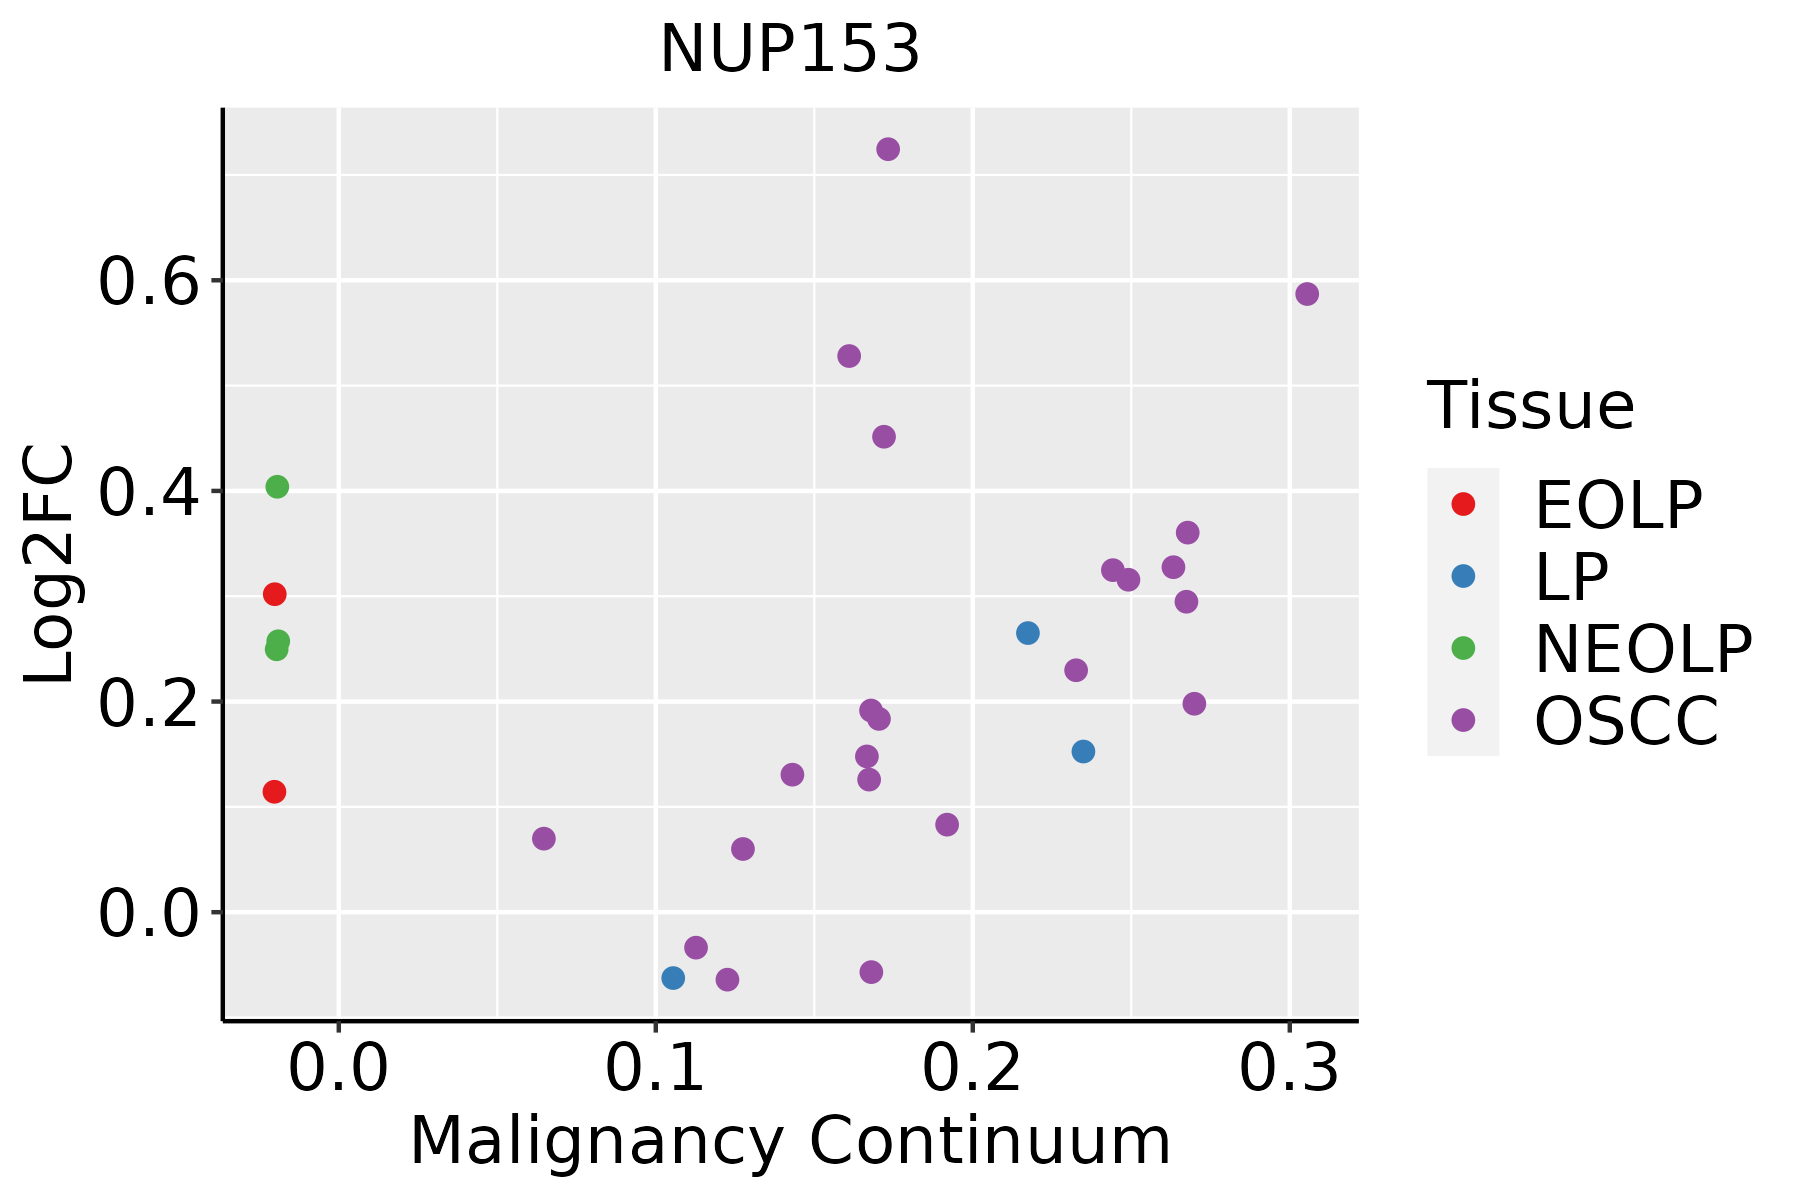 | EOLP: Erosive Oral lichen planus |
| LP: leukoplakia |
| NEOLP: Non-erosive oral lichen planus |
| OSCC: Oral squamous cell carcinoma |
| Prostate | 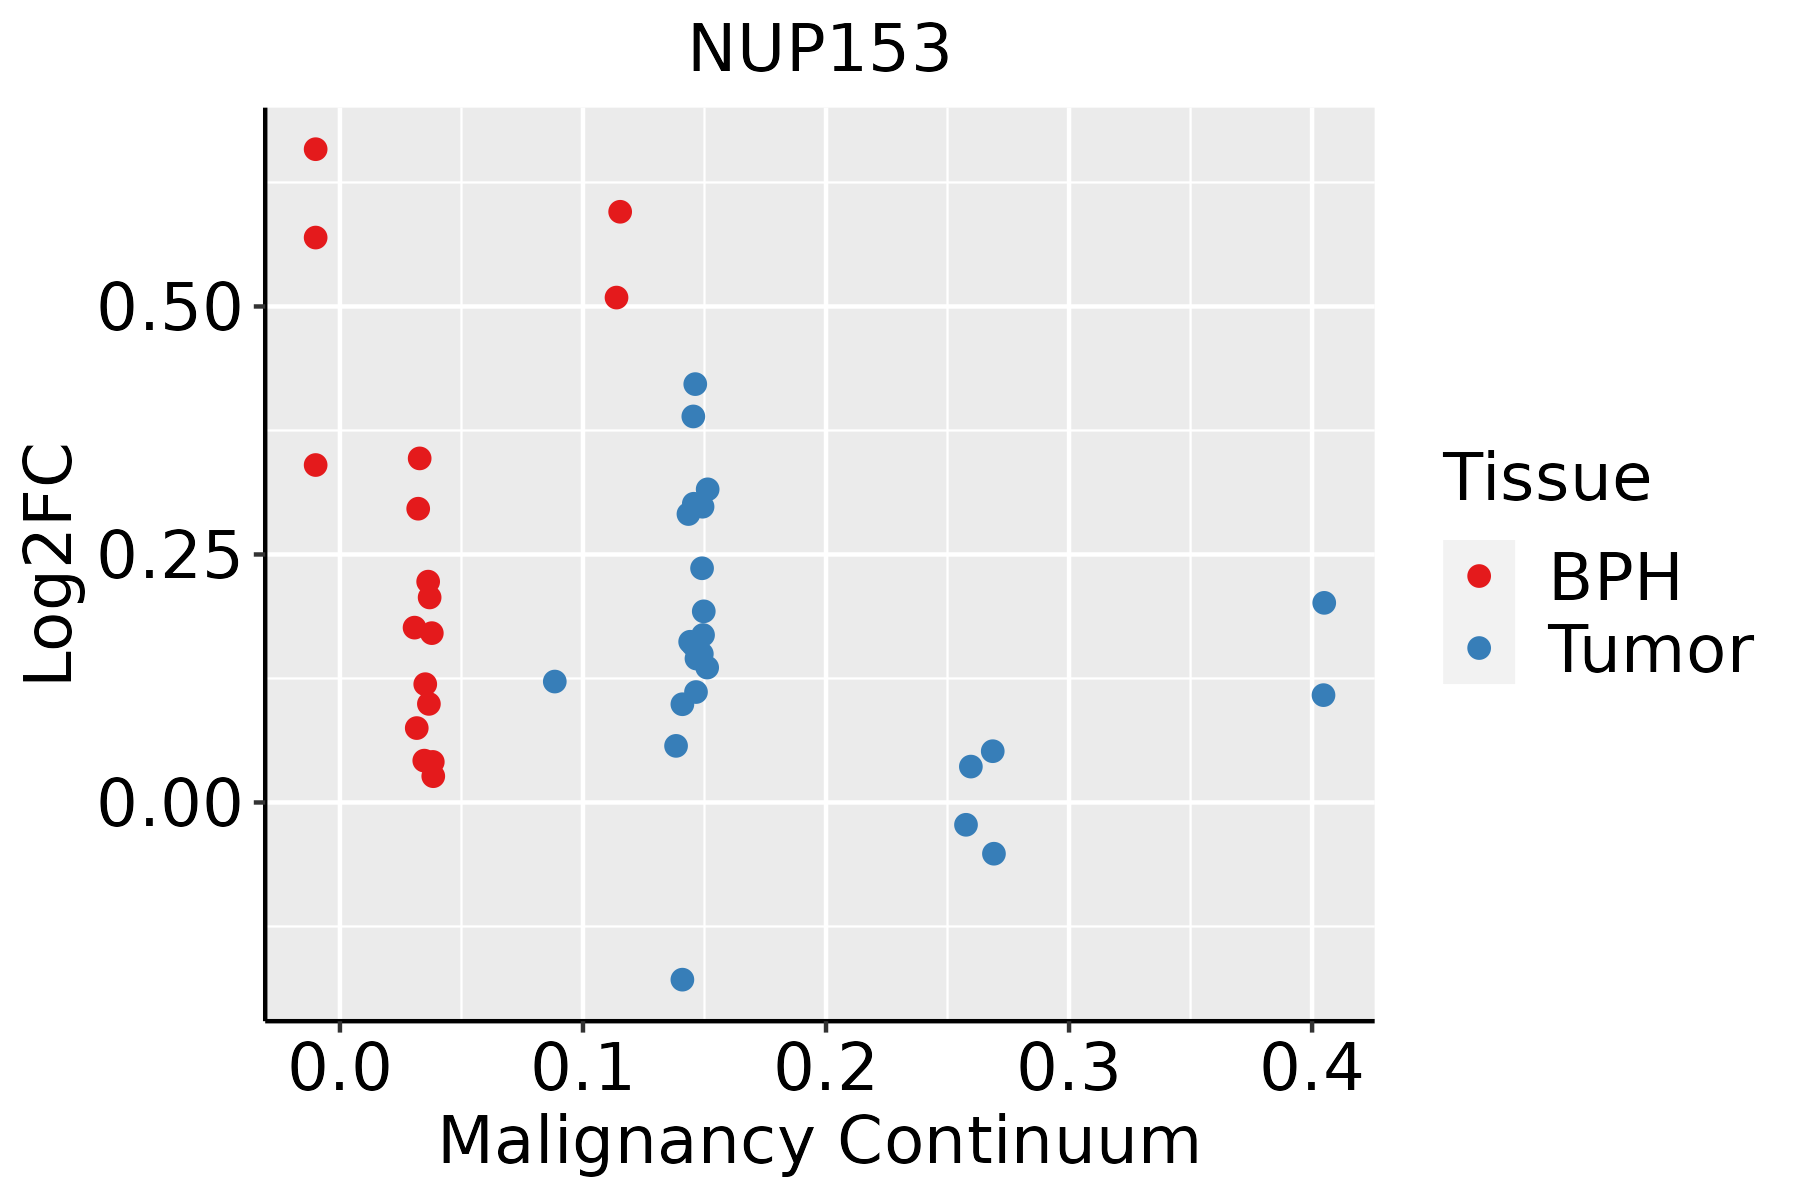 | BPH: Benign Prostatic Hyperplasia |
| GO ID | Tissue | Disease Stage | Description | Gene Ratio | Bg Ratio | pvalue | p.adjust | Count |
| GO:001603219 | Prostate | Tumor | viral process | 155/3246 | 415/18723 | 7.20e-23 | 1.12e-19 | 155 |
| GO:007259417 | Prostate | Tumor | establishment of protein localization to organelle | 151/3246 | 422/18723 | 3.19e-20 | 2.83e-17 | 151 |
| GO:001905819 | Prostate | Tumor | viral life cycle | 117/3246 | 317/18723 | 4.10e-17 | 1.18e-14 | 117 |
| GO:003450414 | Prostate | Tumor | protein localization to nucleus | 100/3246 | 290/18723 | 1.05e-12 | 9.98e-11 | 100 |
| GO:003238614 | Prostate | Tumor | regulation of intracellular transport | 111/3246 | 337/18723 | 1.83e-12 | 1.65e-10 | 111 |
| GO:004440319 | Prostate | Tumor | biological process involved in symbiotic interaction | 99/3246 | 290/18723 | 2.71e-12 | 2.37e-10 | 99 |
| GO:005212619 | Prostate | Tumor | movement in host environment | 68/3246 | 175/18723 | 1.06e-11 | 8.21e-10 | 68 |
| GO:005170119 | Prostate | Tumor | biological process involved in interaction with host | 75/3246 | 203/18723 | 1.69e-11 | 1.22e-09 | 75 |
| GO:000691316 | Prostate | Tumor | nucleocytoplasmic transport | 97/3246 | 301/18723 | 1.78e-10 | 1.05e-08 | 97 |
| GO:005116916 | Prostate | Tumor | nuclear transport | 97/3246 | 301/18723 | 1.78e-10 | 1.05e-08 | 97 |
| GO:004440919 | Prostate | Tumor | entry into host | 58/3246 | 151/18723 | 5.78e-10 | 2.99e-08 | 58 |
| GO:000640317 | Prostate | Tumor | RNA localization | 70/3246 | 201/18723 | 1.58e-09 | 7.32e-08 | 70 |
| GO:004671819 | Prostate | Tumor | viral entry into host cell | 55/3246 | 144/18723 | 2.03e-09 | 8.89e-08 | 55 |
| GO:004682216 | Prostate | Tumor | regulation of nucleocytoplasmic transport | 42/3246 | 106/18723 | 4.65e-08 | 1.43e-06 | 42 |
| GO:001703814 | Prostate | Tumor | protein import | 66/3246 | 206/18723 | 1.78e-07 | 4.38e-06 | 66 |
| GO:005117012 | Prostate | Tumor | import into nucleus | 51/3246 | 159/18723 | 4.08e-06 | 6.51e-05 | 51 |
| GO:000660611 | Prostate | Tumor | protein import into nucleus | 50/3246 | 155/18723 | 4.22e-06 | 6.67e-05 | 50 |
| GO:005123613 | Prostate | Tumor | establishment of RNA localization | 52/3246 | 166/18723 | 7.11e-06 | 1.07e-04 | 52 |
| GO:005065713 | Prostate | Tumor | nucleic acid transport | 51/3246 | 163/18723 | 8.99e-06 | 1.32e-04 | 51 |
| GO:005065813 | Prostate | Tumor | RNA transport | 51/3246 | 163/18723 | 8.99e-06 | 1.32e-04 | 51 |
| Pathway ID | Tissue | Disease Stage | Description | Gene Ratio | Bg Ratio | pvalue | p.adjust | qvalue | Count |
| hsa0501418 | Cervix | CC | Amyotrophic lateral sclerosis | 103/1267 | 364/8465 | 1.79e-11 | 4.47e-10 | 2.64e-10 | 103 |
| hsa0501419 | Cervix | CC | Amyotrophic lateral sclerosis | 103/1267 | 364/8465 | 1.79e-11 | 4.47e-10 | 2.64e-10 | 103 |
| hsa0501420 | Endometrium | AEH | Amyotrophic lateral sclerosis | 123/1197 | 364/8465 | 2.17e-22 | 7.82e-21 | 5.72e-21 | 123 |
| hsa05014110 | Endometrium | AEH | Amyotrophic lateral sclerosis | 123/1197 | 364/8465 | 2.17e-22 | 7.82e-21 | 5.72e-21 | 123 |
| hsa0501425 | Endometrium | EEC | Amyotrophic lateral sclerosis | 128/1237 | 364/8465 | 9.83e-24 | 4.04e-22 | 3.01e-22 | 128 |
| hsa0501435 | Endometrium | EEC | Amyotrophic lateral sclerosis | 128/1237 | 364/8465 | 9.83e-24 | 4.04e-22 | 3.01e-22 | 128 |
| hsa05014210 | Esophagus | ESCC | Amyotrophic lateral sclerosis | 266/4205 | 364/8465 | 1.31e-20 | 2.20e-18 | 1.13e-18 | 266 |
| hsa0301321 | Esophagus | ESCC | Nucleocytoplasmic transport | 89/4205 | 108/8465 | 1.20e-12 | 2.37e-11 | 1.21e-11 | 89 |
| hsa032509 | Esophagus | ESCC | Viral life cycle - HIV-1 | 54/4205 | 63/8465 | 2.01e-09 | 2.17e-08 | 1.11e-08 | 54 |
| hsa0501438 | Esophagus | ESCC | Amyotrophic lateral sclerosis | 266/4205 | 364/8465 | 1.31e-20 | 2.20e-18 | 1.13e-18 | 266 |
| hsa0301331 | Esophagus | ESCC | Nucleocytoplasmic transport | 89/4205 | 108/8465 | 1.20e-12 | 2.37e-11 | 1.21e-11 | 89 |
| hsa0325014 | Esophagus | ESCC | Viral life cycle - HIV-1 | 54/4205 | 63/8465 | 2.01e-09 | 2.17e-08 | 1.11e-08 | 54 |
| hsa0501414 | Liver | Cirrhotic | Amyotrophic lateral sclerosis | 187/2530 | 364/8465 | 1.56e-18 | 6.50e-17 | 4.01e-17 | 187 |
| hsa0501415 | Liver | Cirrhotic | Amyotrophic lateral sclerosis | 187/2530 | 364/8465 | 1.56e-18 | 6.50e-17 | 4.01e-17 | 187 |
| hsa0501422 | Liver | HCC | Amyotrophic lateral sclerosis | 252/4020 | 364/8465 | 8.85e-18 | 7.41e-16 | 4.12e-16 | 252 |
| hsa03013 | Liver | HCC | Nucleocytoplasmic transport | 81/4020 | 108/8465 | 4.28e-09 | 6.83e-08 | 3.80e-08 | 81 |
| hsa032502 | Liver | HCC | Viral life cycle - HIV-1 | 46/4020 | 63/8465 | 3.25e-05 | 1.88e-04 | 1.04e-04 | 46 |
| hsa0501432 | Liver | HCC | Amyotrophic lateral sclerosis | 252/4020 | 364/8465 | 8.85e-18 | 7.41e-16 | 4.12e-16 | 252 |
| hsa030131 | Liver | HCC | Nucleocytoplasmic transport | 81/4020 | 108/8465 | 4.28e-09 | 6.83e-08 | 3.80e-08 | 81 |
| hsa0325011 | Liver | HCC | Viral life cycle - HIV-1 | 46/4020 | 63/8465 | 3.25e-05 | 1.88e-04 | 1.04e-04 | 46 |
| Hugo Symbol | Variant Class | Variant Classification | dbSNP RS | HGVSc | HGVSp | HGVSp Short | SWISSPROT | BIOTYPE | SIFT | PolyPhen | Tumor Sample Barcode | Tissue | Histology | Sex | Age | Stage | Therapy Types | Drugs | Outcome |
| NUP153 | SNV | Missense_Mutation | novel | c.4027N>C | p.Ala1343Pro | p.A1343P | P49790 | protein_coding | deleterious(0.02) | possibly_damaging(0.675) | TCGA-5L-AAT1-01 | Breast | breast invasive carcinoma | Female | <65 | III/IV | Hormone Therapy | letrozol | SD |
| NUP153 | SNV | Missense_Mutation | | c.211N>A | p.Asp71Asn | p.D71N | P49790 | protein_coding | tolerated(0.07) | benign(0.015) | TCGA-A2-A0YG-01 | Breast | breast invasive carcinoma | Female | <65 | III/IV | Chemotherapy | cytoxan | SD |
| NUP153 | SNV | Missense_Mutation | rs568893774 | c.2384C>T | p.Ser795Leu | p.S795L | P49790 | protein_coding | tolerated(0.11) | benign(0.062) | TCGA-AN-A046-01 | Breast | breast invasive carcinoma | Female | >=65 | I/II | Unknown | Unknown | SD |
| NUP153 | SNV | Missense_Mutation | | c.3250N>T | p.Ile1084Leu | p.I1084L | P49790 | protein_coding | tolerated(0.18) | benign(0) | TCGA-AN-A0G0-01 | Breast | breast invasive carcinoma | Female | <65 | I/II | Unknown | Unknown | SD |
| NUP153 | SNV | Missense_Mutation | | c.3458N>A | p.Ala1153Asp | p.A1153D | P49790 | protein_coding | deleterious(0) | possibly_damaging(0.782) | TCGA-AR-A1AO-01 | Breast | breast invasive carcinoma | Female | <65 | I/II | Chemotherapy | doxorubicin | SD |
| NUP153 | SNV | Missense_Mutation | | c.1006C>G | p.Leu336Val | p.L336V | P49790 | protein_coding | deleterious(0.04) | benign(0.082) | TCGA-BH-A0BF-01 | Breast | breast invasive carcinoma | Female | <65 | I/II | Unknown | Unknown | SD |
| NUP153 | SNV | Missense_Mutation | | c.2395G>C | p.Glu799Gln | p.E799Q | P49790 | protein_coding | tolerated(0.43) | benign(0.123) | TCGA-BH-A0DZ-01 | Breast | breast invasive carcinoma | Female | <65 | I/II | Chemotherapy | docetaxel | SD |
| NUP153 | SNV | Missense_Mutation | | c.2105N>T | p.Asn702Ile | p.N702I | P49790 | protein_coding | deleterious(0) | probably_damaging(1) | TCGA-C8-A12P-01 | Breast | breast invasive carcinoma | Female | <65 | I/II | Unknown | Unknown | SD |
| NUP153 | SNV | Missense_Mutation | | c.3403G>A | p.Glu1135Lys | p.E1135K | P49790 | protein_coding | deleterious(0.01) | probably_damaging(0.919) | TCGA-D8-A1JA-01 | Breast | breast invasive carcinoma | Female | <65 | III/IV | Chemotherapy | adriamycin | PD |
| NUP153 | SNV | Missense_Mutation | | c.4278N>G | p.Phe1426Leu | p.F1426L | P49790 | protein_coding | deleterious(0) | probably_damaging(0.997) | TCGA-D8-A27G-01 | Breast | breast invasive carcinoma | Female | >=65 | I/II | Unknown | Unknown | SD |


