
|
|||||
|
 | |
| |
| |
| |
| |
| |
|
Gene: NUMB |
Gene summary for NUMB |
| Gene information | Species | Human | Gene symbol | NUMB | Gene ID | 8650 |
| Gene name | NUMB endocytic adaptor protein | |
| Gene Alias | C14orf41 | |
| Cytomap | 14q24.2-q24.3 | |
| Gene Type | protein-coding | GO ID | GO:0000902 | UniProtAcc | A0A024R6F4 |
Top |
Malignant transformation analysis |
| Identification of the aberrant gene expression in precancerous and cancerous lesions by comparing the gene expression of stem-like cells in diseased tissues with normal stem cells |
| Entrez ID | Symbol | Replicates | Species | Organ | Tissue | Adj P-value | Log2FC | Malignancy |
| 8650 | NUMB | HTA11_3410_2000001011 | Human | Colorectum | AD | 4.40e-17 | -5.36e-01 | 0.0155 |
| 8650 | NUMB | HTA11_347_2000001011 | Human | Colorectum | AD | 8.86e-11 | 5.99e-01 | -0.1954 |
| 8650 | NUMB | HTA11_3361_2000001011 | Human | Colorectum | AD | 2.49e-02 | -2.72e-01 | -0.1207 |
| 8650 | NUMB | HTA11_5216_2000001011 | Human | Colorectum | SER | 1.16e-03 | -4.80e-01 | -0.1462 |
| 8650 | NUMB | HTA11_866_3004761011 | Human | Colorectum | AD | 2.34e-06 | -4.22e-01 | 0.096 |
| 8650 | NUMB | HTA11_4255_2000001011 | Human | Colorectum | SER | 6.90e-03 | -2.02e-01 | 0.0446 |
| 8650 | NUMB | HTA11_7696_3000711011 | Human | Colorectum | AD | 3.38e-11 | -4.14e-01 | 0.0674 |
| 8650 | NUMB | HTA11_11156_2000001011 | Human | Colorectum | AD | 1.44e-03 | -6.32e-01 | 0.0397 |
| 8650 | NUMB | HTA11_99999970781_79442 | Human | Colorectum | MSS | 9.26e-04 | -3.38e-01 | 0.294 |
| 8650 | NUMB | HTA11_99999971662_82457 | Human | Colorectum | MSS | 7.54e-10 | -4.86e-01 | 0.3859 |
| 8650 | NUMB | HTA11_99999973899_84307 | Human | Colorectum | MSS | 4.68e-04 | -4.41e-01 | 0.2585 |
| 8650 | NUMB | HTA11_99999974143_84620 | Human | Colorectum | MSS | 4.26e-22 | -6.18e-01 | 0.3005 |
| 8650 | NUMB | F007 | Human | Colorectum | FAP | 1.61e-05 | -4.19e-01 | 0.1176 |
| 8650 | NUMB | A001-C-207 | Human | Colorectum | FAP | 2.29e-10 | -5.70e-01 | 0.1278 |
| 8650 | NUMB | A015-C-203 | Human | Colorectum | FAP | 4.65e-42 | -7.11e-01 | -0.1294 |
| 8650 | NUMB | A015-C-204 | Human | Colorectum | FAP | 1.69e-09 | -4.60e-01 | -0.0228 |
| 8650 | NUMB | A014-C-040 | Human | Colorectum | FAP | 3.77e-08 | -6.22e-01 | -0.1184 |
| 8650 | NUMB | A002-C-201 | Human | Colorectum | FAP | 1.05e-24 | -6.80e-01 | 0.0324 |
| 8650 | NUMB | A002-C-203 | Human | Colorectum | FAP | 1.02e-02 | -3.50e-01 | 0.2786 |
| 8650 | NUMB | A001-C-119 | Human | Colorectum | FAP | 4.12e-08 | -3.27e-01 | -0.1557 |
| Page: 1 2 3 4 5 6 7 8 9 10 11 12 |
| Tissue | Expression Dynamics | Abbreviation |
| Colorectum (GSE201348) |  | FAP: Familial adenomatous polyposis |
| CRC: Colorectal cancer | ||
| Colorectum (HTA11) |  | AD: Adenomas |
| SER: Sessile serrated lesions | ||
| MSI-H: Microsatellite-high colorectal cancer | ||
| MSS: Microsatellite stable colorectal cancer | ||
| Endometrium |  | AEH: Atypical endometrial hyperplasia |
| EEC: Endometrioid Cancer | ||
| Esophagus | 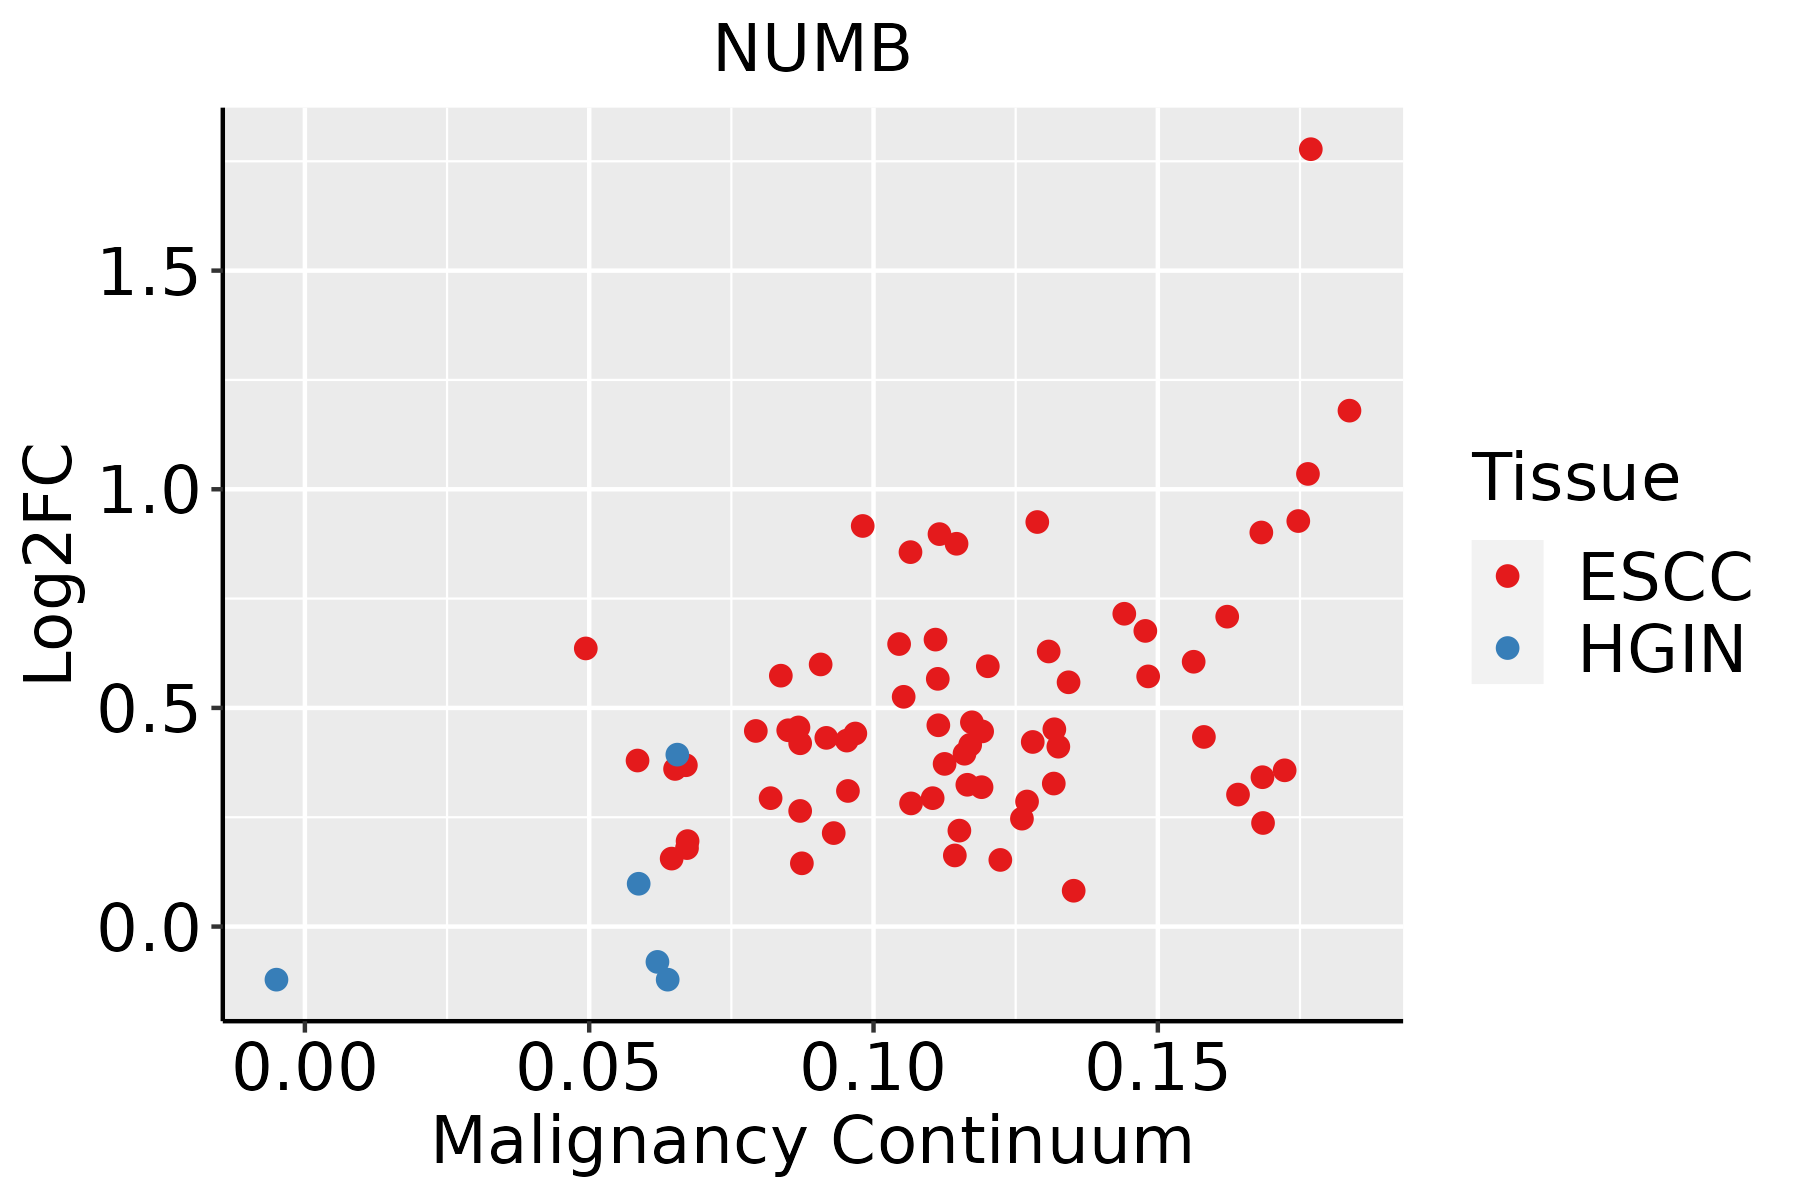 | ESCC: Esophageal squamous cell carcinoma |
| HGIN: High-grade intraepithelial neoplasias | ||
| LGIN: Low-grade intraepithelial neoplasias | ||
| Liver | 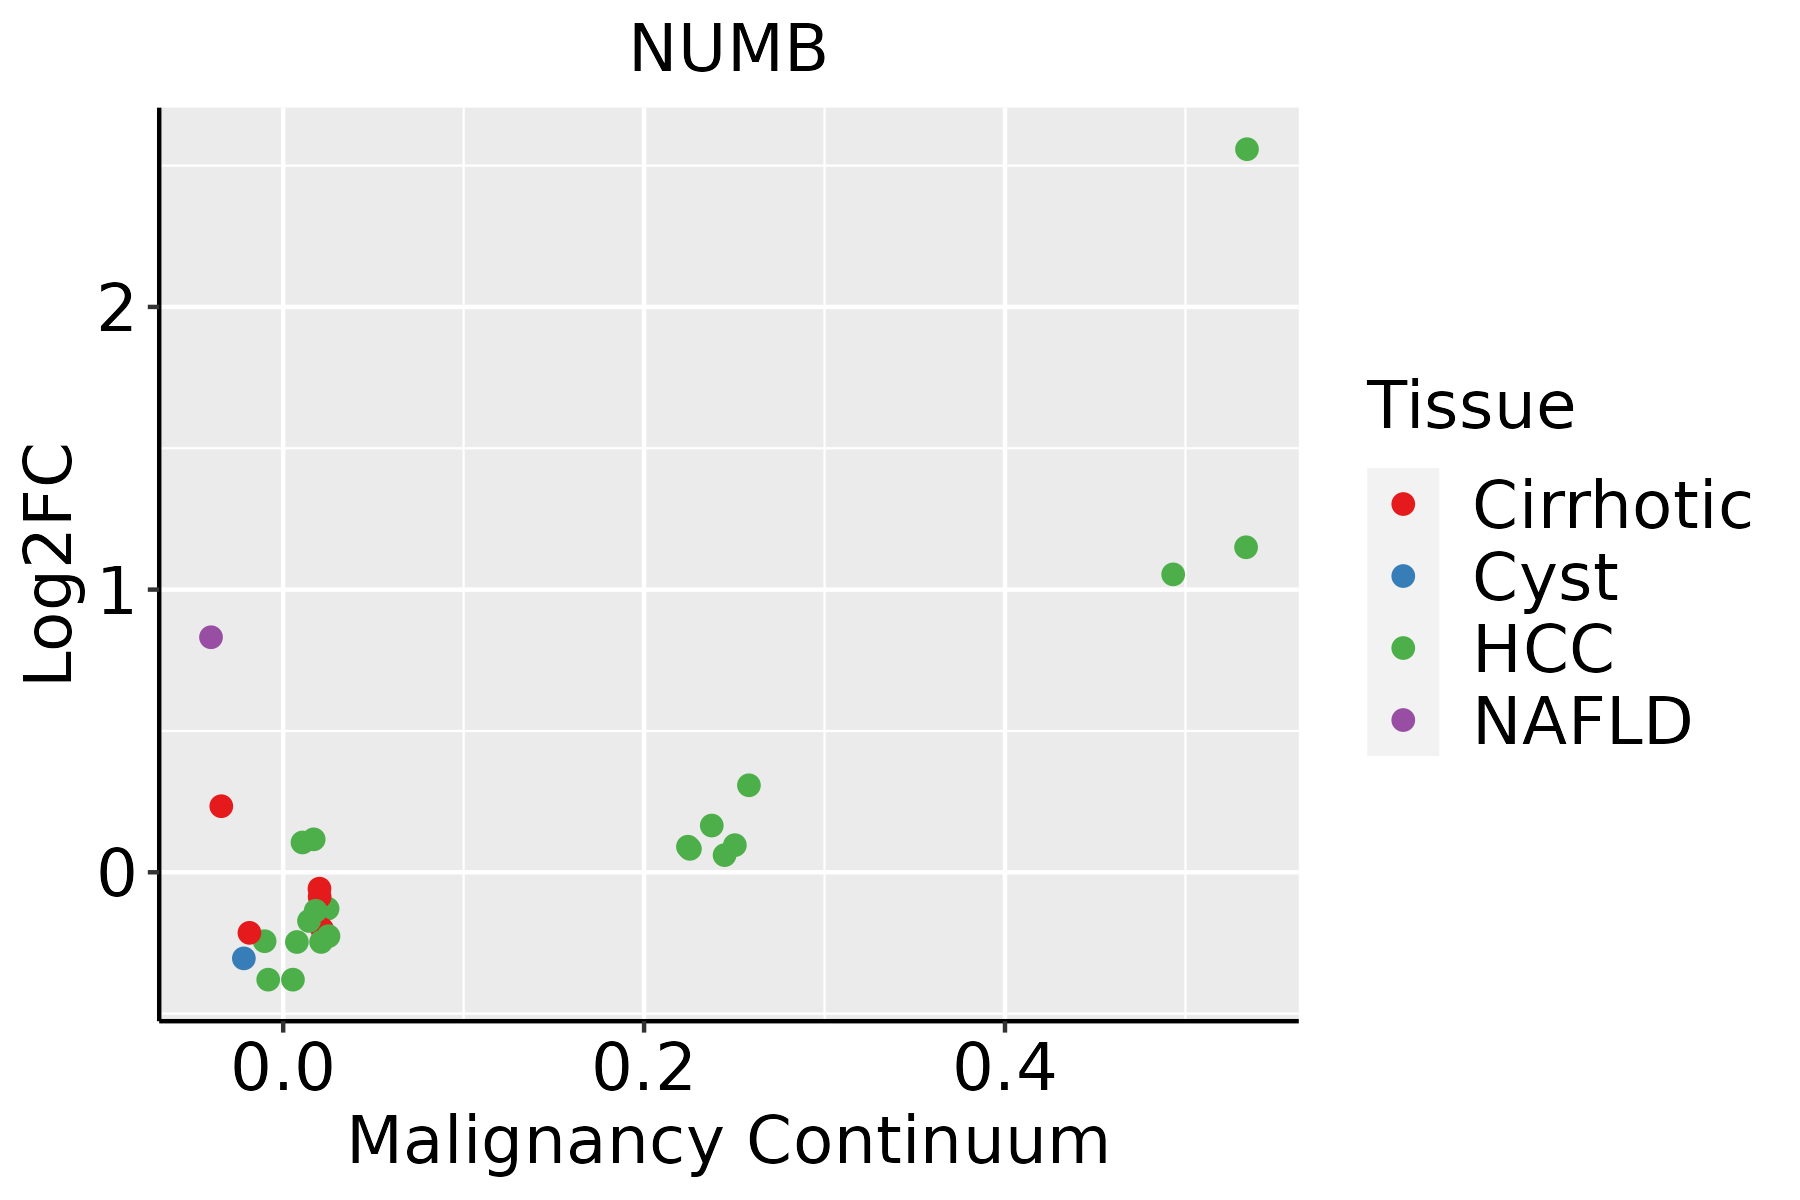 | HCC: Hepatocellular carcinoma |
| NAFLD: Non-alcoholic fatty liver disease | ||
| Lung | 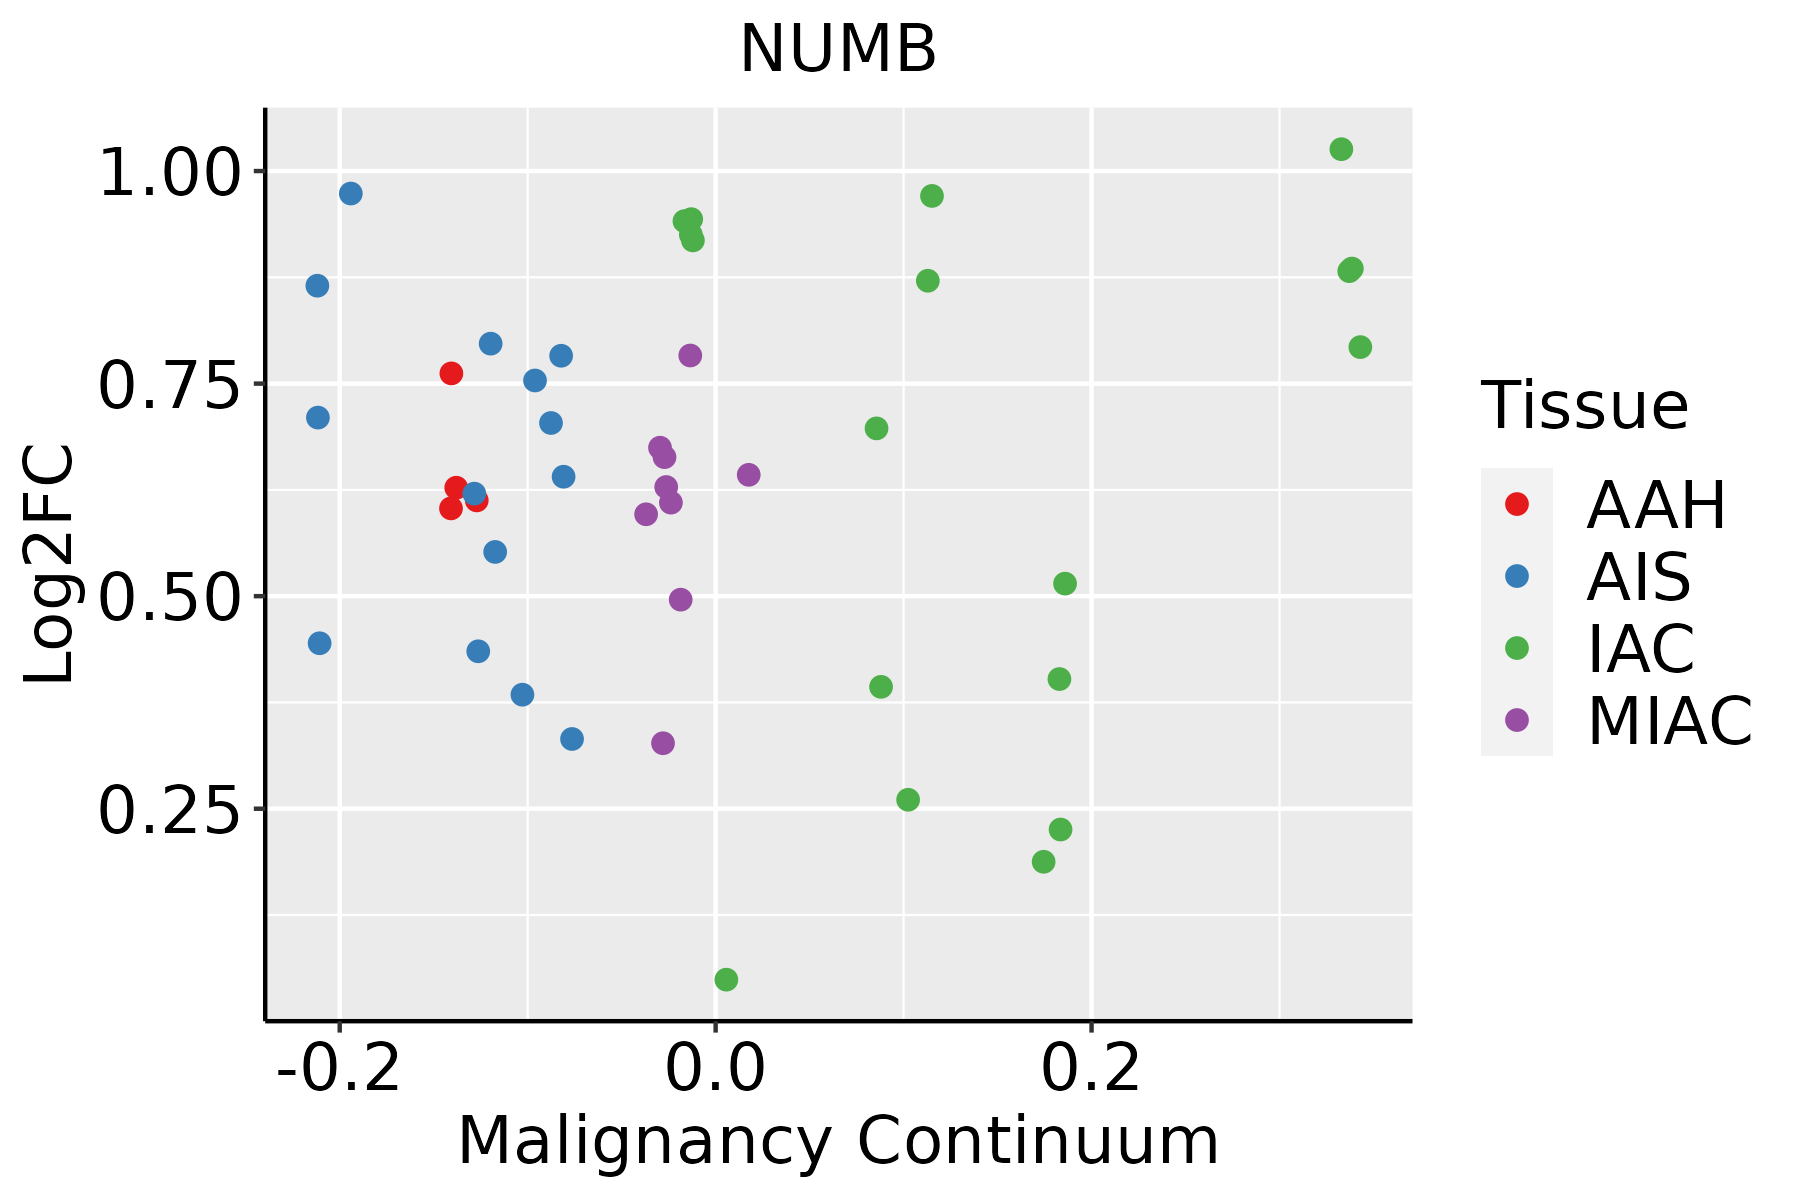 | AAH: Atypical adenomatous hyperplasia |
| AIS: Adenocarcinoma in situ | ||
| IAC: Invasive lung adenocarcinoma | ||
| MIA: Minimally invasive adenocarcinoma | ||
| Oral Cavity | 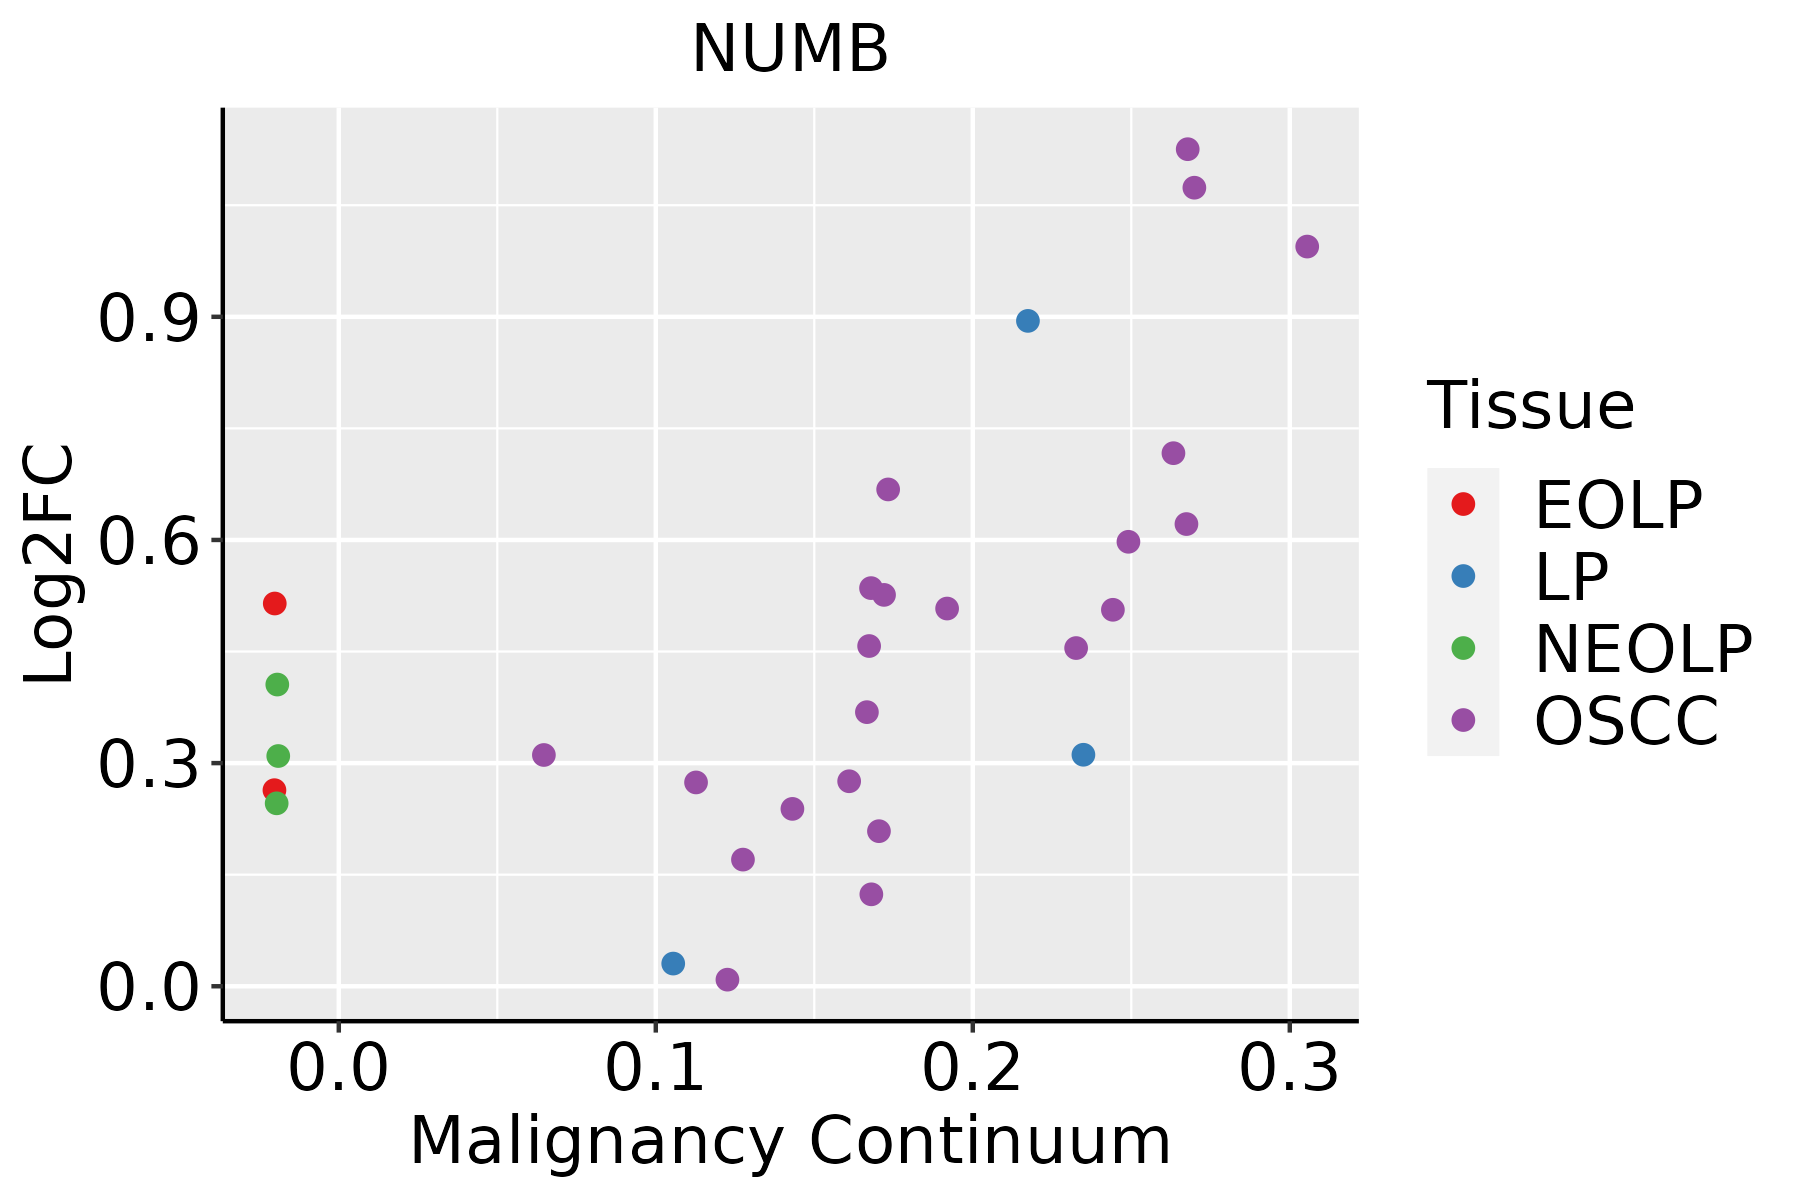 | EOLP: Erosive Oral lichen planus |
| LP: leukoplakia | ||
| NEOLP: Non-erosive oral lichen planus | ||
| OSCC: Oral squamous cell carcinoma | ||
| Prostate | 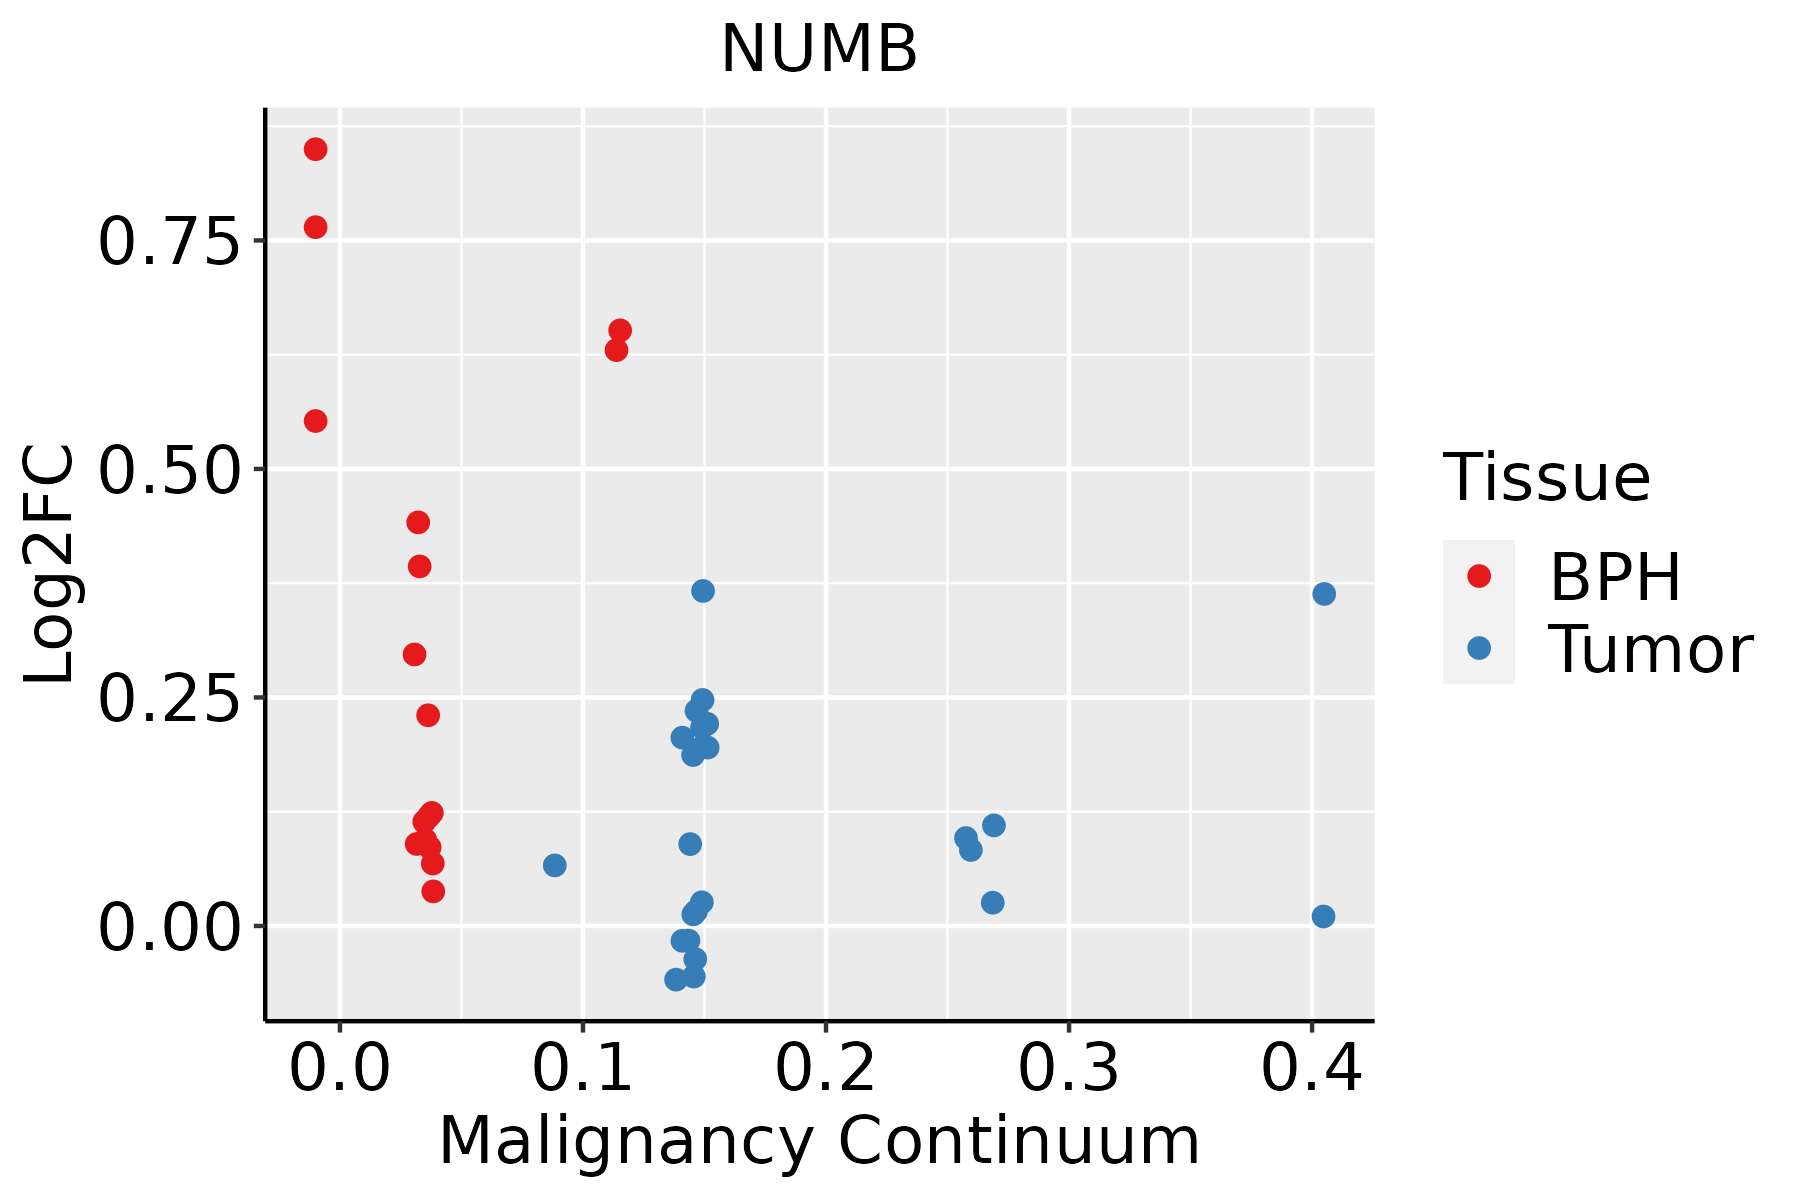 | BPH: Benign Prostatic Hyperplasia |
| Skin | 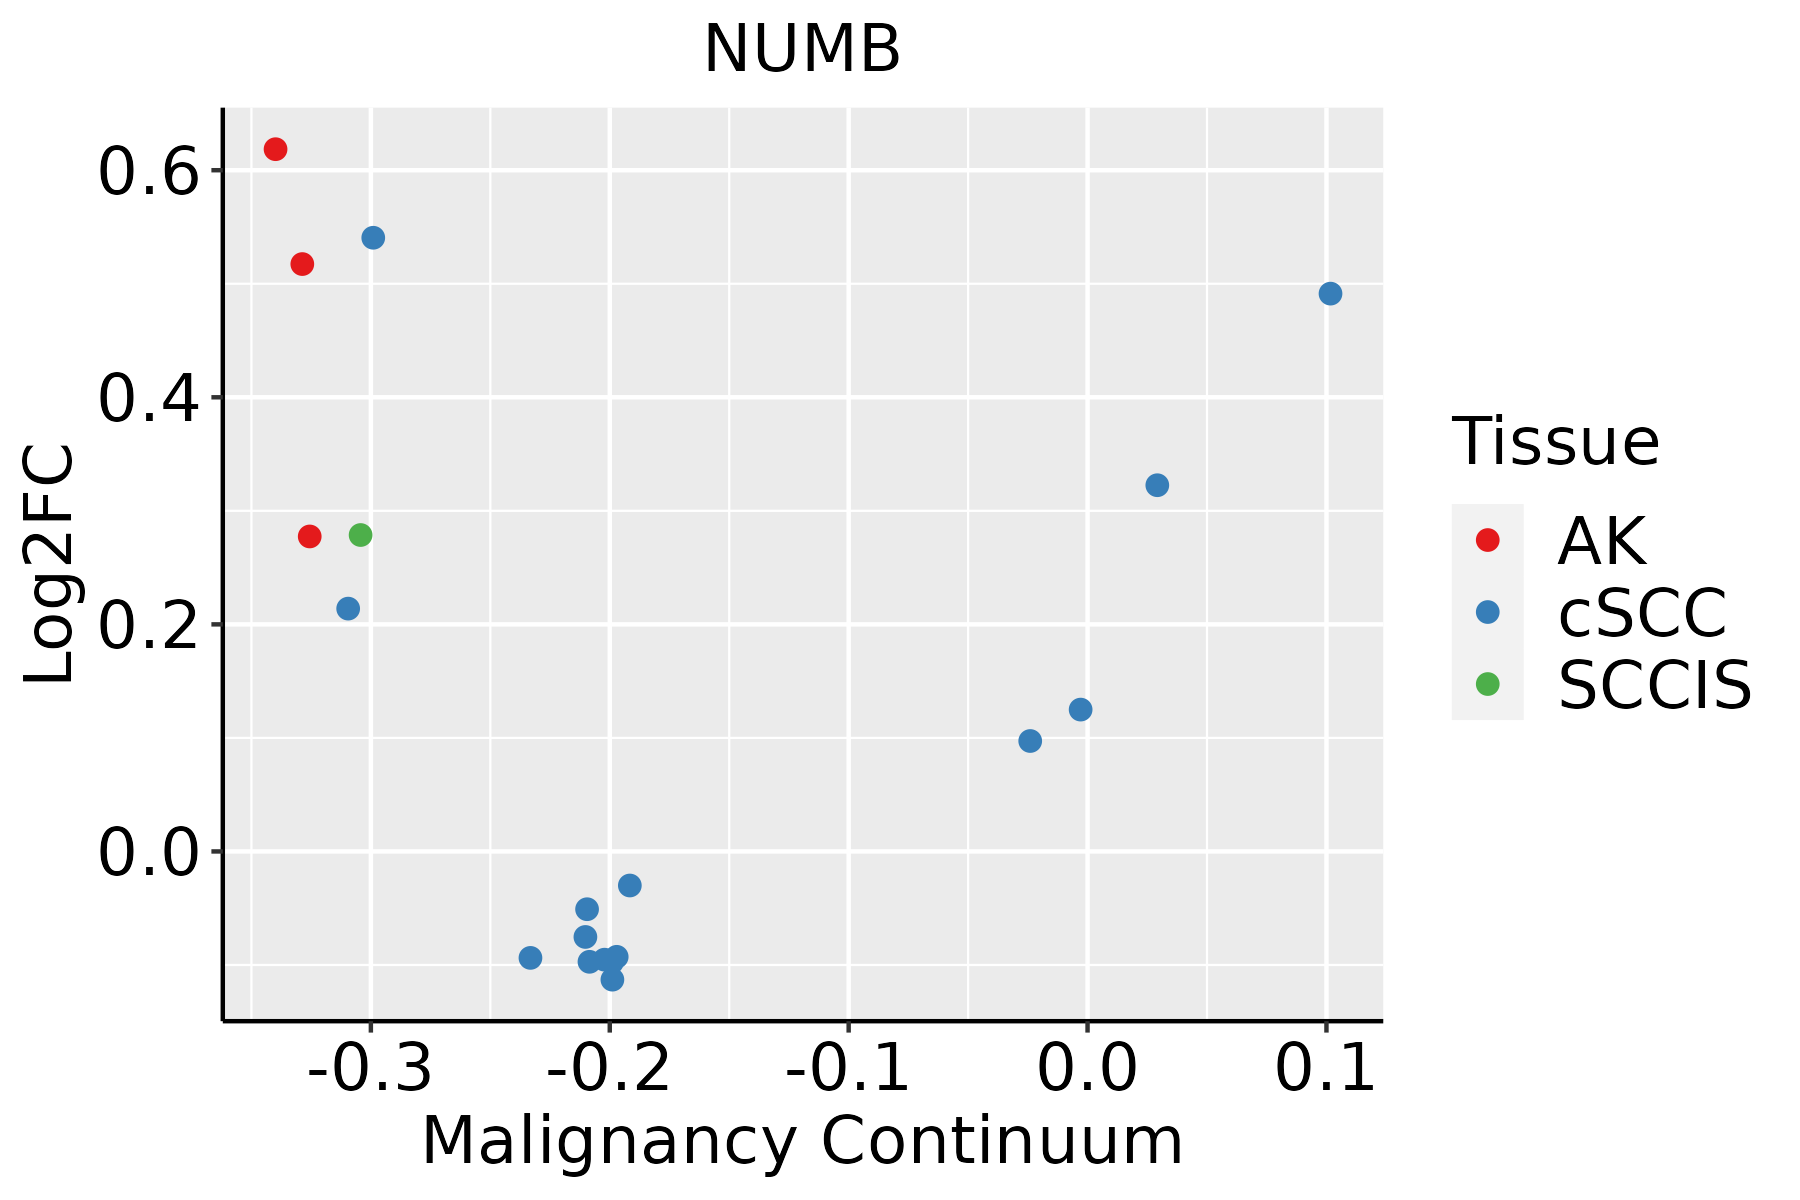 | AK: Actinic keratosis |
| cSCC: Cutaneous squamous cell carcinoma | ||
| SCCIS:squamous cell carcinoma in situ | ||
| Thyroid | 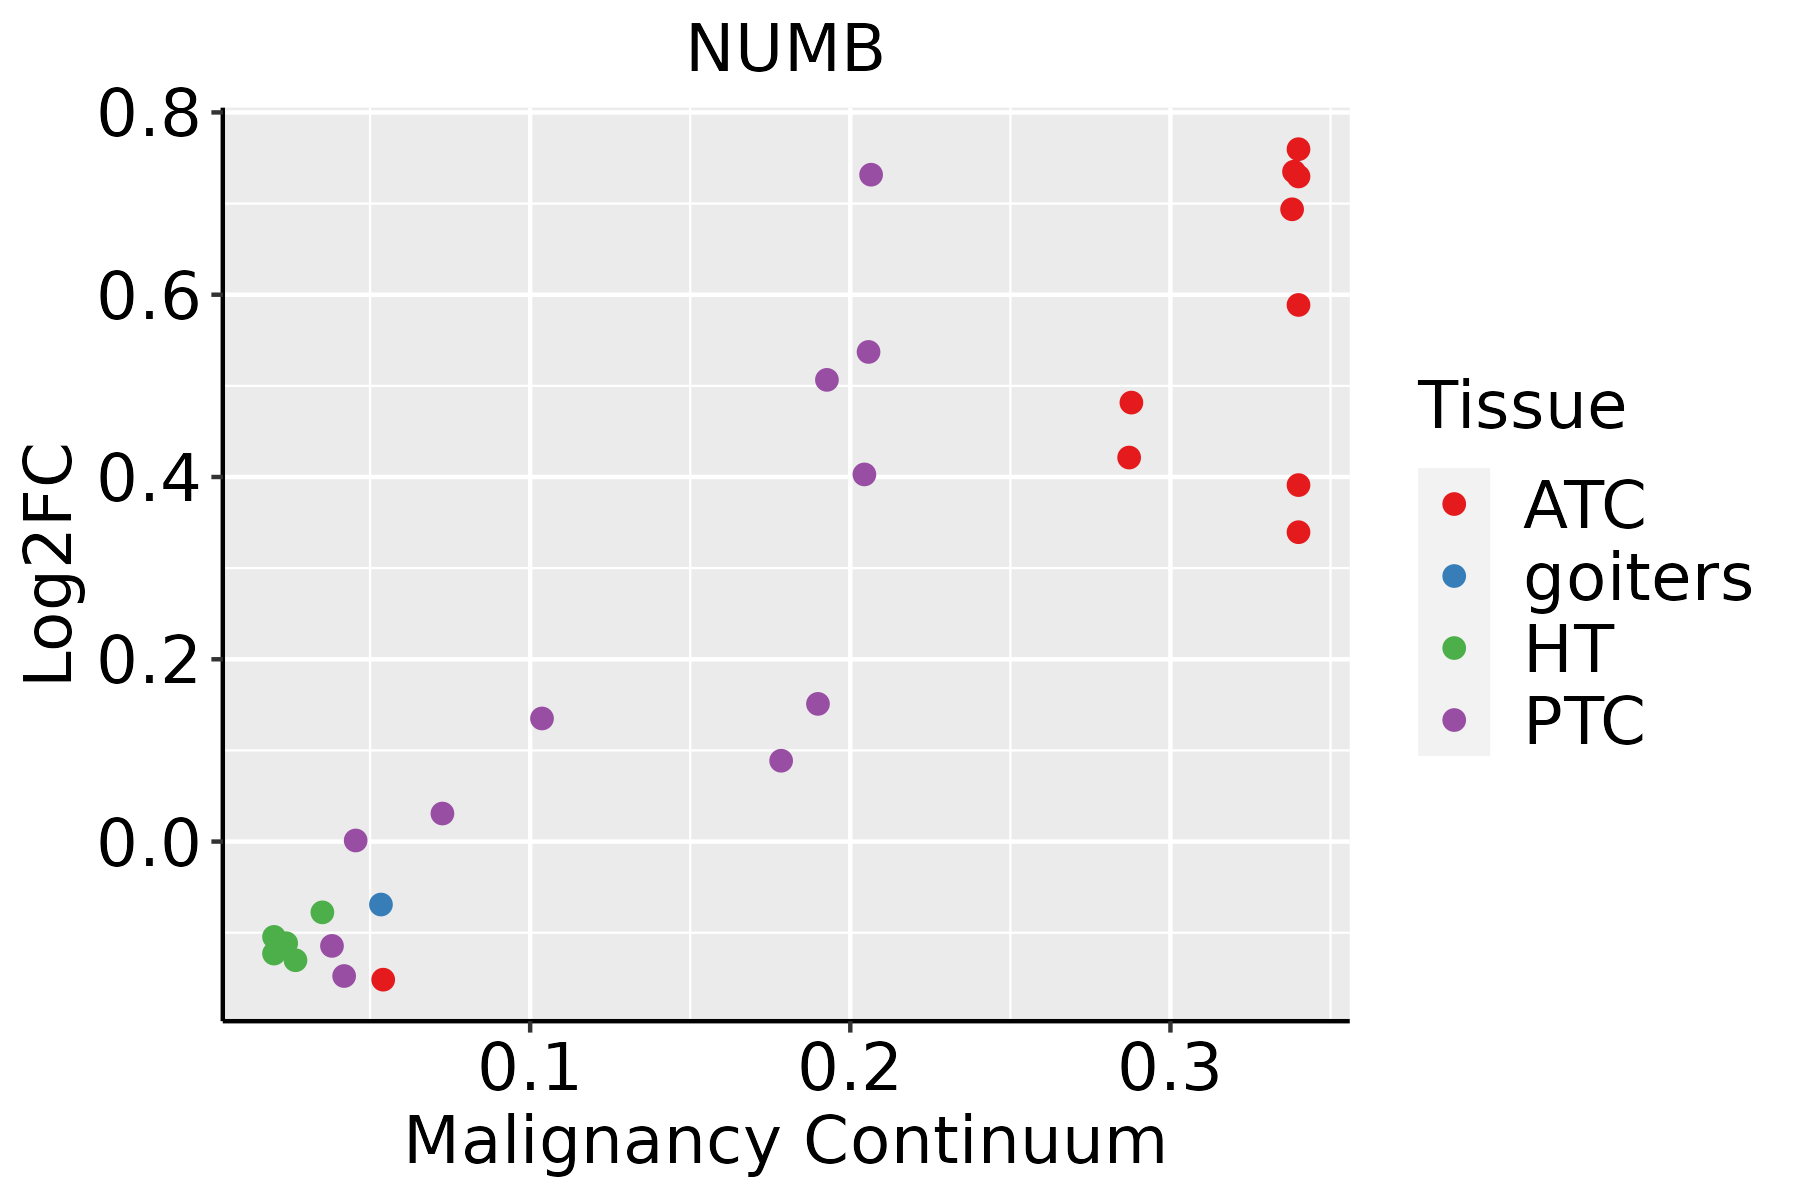 | ATC: Anaplastic thyroid cancer |
| HT: Hashimoto's thyroiditis | ||
| PTC: Papillary thyroid cancer |
| ∗log2FC in expression of this searched gene in stem-like cells from each diseased tissue sample relative to stem-like cells in normal samples in each tissue plotted against the malignancy continuum. Samples are colored based on if they are from different disease stage. |
Top |
Malignant transformation related pathway analysis |
| Find out the enriched GO biological processes and KEGG pathways involved in transition from healthy to precancer to cancer |
| Tissue | Disease Stage | Enriched GO biological Processes |
| Colorectum | AD |  |
| Colorectum | SER |  |
| Colorectum | MSS |  |
| Colorectum | MSI-H |  |
| Colorectum | FAP |  |
| ∗Top 15 enriched GO BP terms are showed in the bar plot of each disease state in each tissue. Each row represents a significant GO biological process which is colored according to the -log10(p.adjust). |
| Page: 1 2 3 4 5 6 7 8 9 |
| GO ID | Tissue | Disease Stage | Description | Gene Ratio | Bg Ratio | pvalue | p.adjust | Count |
| GO:005196212 | Oral cavity | NEOLP | positive regulation of nervous system development | 47/2005 | 272/18723 | 6.49e-04 | 5.47e-03 | 47 |
| GO:005196012 | Oral cavity | NEOLP | regulation of nervous system development | 68/2005 | 443/18723 | 1.46e-03 | 1.03e-02 | 68 |
| GO:00343329 | Oral cavity | NEOLP | adherens junction organization | 13/2005 | 49/18723 | 1.52e-03 | 1.07e-02 | 13 |
| GO:00613512 | Oral cavity | NEOLP | neural precursor cell proliferation | 27/2005 | 145/18723 | 2.95e-03 | 1.81e-02 | 27 |
| GO:003150331 | Oral cavity | NEOLP | protein-containing complex localization | 37/2005 | 220/18723 | 3.69e-03 | 2.15e-02 | 37 |
| GO:00215371 | Oral cavity | NEOLP | telencephalon development | 40/2005 | 248/18723 | 5.50e-03 | 2.93e-02 | 40 |
| GO:190547531 | Oral cavity | NEOLP | regulation of protein localization to membrane | 30/2005 | 175/18723 | 6.34e-03 | 3.29e-02 | 30 |
| GO:190307631 | Oral cavity | NEOLP | regulation of protein localization to plasma membrane | 20/2005 | 104/18723 | 6.71e-03 | 3.42e-02 | 20 |
| GO:007265916 | Prostate | BPH | protein localization to plasma membrane | 89/3107 | 284/18723 | 5.00e-10 | 2.56e-08 | 89 |
| GO:199077810 | Prostate | BPH | protein localization to cell periphery | 95/3107 | 333/18723 | 2.78e-08 | 8.13e-07 | 95 |
| GO:00107208 | Prostate | BPH | positive regulation of cell development | 86/3107 | 298/18723 | 7.11e-08 | 1.85e-06 | 86 |
| GO:190307610 | Prostate | BPH | regulation of protein localization to plasma membrane | 38/3107 | 104/18723 | 7.15e-07 | 1.37e-05 | 38 |
| GO:190547510 | Prostate | BPH | regulation of protein localization to membrane | 55/3107 | 175/18723 | 8.75e-07 | 1.61e-05 | 55 |
| GO:004521616 | Prostate | BPH | cell-cell junction organization | 59/3107 | 200/18723 | 3.57e-06 | 5.54e-05 | 59 |
| GO:00431129 | Prostate | BPH | receptor metabolic process | 51/3107 | 166/18723 | 4.49e-06 | 6.71e-05 | 51 |
| GO:003010010 | Prostate | BPH | regulation of endocytosis | 60/3107 | 211/18723 | 1.06e-05 | 1.45e-04 | 60 |
| GO:00507695 | Prostate | BPH | positive regulation of neurogenesis | 63/3107 | 225/18723 | 1.11e-05 | 1.51e-04 | 63 |
| GO:00507678 | Prostate | BPH | regulation of neurogenesis | 92/3107 | 364/18723 | 1.36e-05 | 1.78e-04 | 92 |
| GO:190437510 | Prostate | BPH | regulation of protein localization to cell periphery | 40/3107 | 125/18723 | 1.61e-05 | 2.02e-04 | 40 |
| GO:00068989 | Prostate | BPH | receptor-mediated endocytosis | 66/3107 | 244/18723 | 2.34e-05 | 2.80e-04 | 66 |
| Page: 1 2 3 4 5 6 7 8 9 10 11 12 13 14 15 16 17 18 19 20 21 22 23 24 25 |
| Pathway ID | Tissue | Disease Stage | Description | Gene Ratio | Bg Ratio | pvalue | p.adjust | qvalue | Count |
| hsa043306 | Esophagus | ESCC | Notch signaling pathway | 42/4205 | 62/8465 | 2.97e-03 | 7.97e-03 | 4.08e-03 | 42 |
| hsa0433013 | Esophagus | ESCC | Notch signaling pathway | 42/4205 | 62/8465 | 2.97e-03 | 7.97e-03 | 4.08e-03 | 42 |
| hsa043305 | Oral cavity | OSCC | Notch signaling pathway | 44/3704 | 62/8465 | 1.26e-05 | 5.55e-05 | 2.83e-05 | 44 |
| hsa0433012 | Oral cavity | OSCC | Notch signaling pathway | 44/3704 | 62/8465 | 1.26e-05 | 5.55e-05 | 2.83e-05 | 44 |
| hsa0433021 | Oral cavity | NEOLP | Notch signaling pathway | 21/1112 | 62/8465 | 2.23e-05 | 1.87e-04 | 1.18e-04 | 21 |
| hsa0433031 | Oral cavity | NEOLP | Notch signaling pathway | 21/1112 | 62/8465 | 2.23e-05 | 1.87e-04 | 1.18e-04 | 21 |
| hsa043304 | Prostate | BPH | Notch signaling pathway | 21/1718 | 62/8465 | 8.53e-03 | 2.68e-02 | 1.66e-02 | 21 |
| hsa0433011 | Prostate | BPH | Notch signaling pathway | 21/1718 | 62/8465 | 8.53e-03 | 2.68e-02 | 1.66e-02 | 21 |
| hsa043302 | Prostate | Tumor | Notch signaling pathway | 22/1791 | 62/8465 | 6.45e-03 | 2.16e-02 | 1.34e-02 | 22 |
| hsa043303 | Prostate | Tumor | Notch signaling pathway | 22/1791 | 62/8465 | 6.45e-03 | 2.16e-02 | 1.34e-02 | 22 |
| Page: 1 |
Top |
Cell-cell communication analysis |
| Identification of potential cell-cell interactions between two cell types and their ligand-receptor pairs for different disease states |
| Ligand | Receptor | LRpair | Pathway | Tissue | Disease Stage |
| Page: 1 |
Top |
Single-cell gene regulatory network inference analysis |
| Find out the significant the regulons (TFs) and the target genes of each regulon across cell types for different disease states |
| TF | Cell Type | Tissue | Disease Stage | Target Gene | RSS | Regulon Activity |
| ∗The dot plots of a searched regulon are shown for all cell subpopulations in each disease state of each tissue based on the regulon specific score inferred using pySCENIC and by calculating the average expression. |
| Page: 1 |
Top |
Somatic mutation of malignant transformation related genes |
| Annotation of somatic variants for genes involved in malignant transformation |
| Hugo Symbol | Variant Class | Variant Classification | dbSNP RS | HGVSc | HGVSp | HGVSp Short | SWISSPROT | BIOTYPE | SIFT | PolyPhen | Tumor Sample Barcode | Tissue | Histology | Sex | Age | Stage | Therapy Types | Drugs | Outcome |
| NUMB | SNV | Missense_Mutation | novel | c.203N>T | p.Glu68Val | p.E68V | P49757 | protein_coding | tolerated(0.17) | probably_damaging(0.939) | TCGA-A8-A06P-01 | Breast | breast invasive carcinoma | Female | <65 | III/IV | Unspecific | SD | |
| NUMB | SNV | Missense_Mutation | c.1813N>A | p.Glu605Lys | p.E605K | P49757 | protein_coding | tolerated_low_confidence(0.46) | benign(0.017) | TCGA-AC-A23H-01 | Breast | breast invasive carcinoma | Female | >=65 | I/II | Unknown | Unknown | PD | |
| NUMB | SNV | Missense_Mutation | rs755122928 | c.1174N>T | p.Arg392Cys | p.R392C | P49757 | protein_coding | deleterious(0) | probably_damaging(0.959) | TCGA-AN-A0AK-01 | Breast | breast invasive carcinoma | Female | >=65 | I/II | Unknown | Unknown | SD |
| NUMB | SNV | Missense_Mutation | c.1457N>T | p.Ala486Val | p.A486V | P49757 | protein_coding | tolerated(0.43) | benign(0.027) | TCGA-AO-A0J9-01 | Breast | breast invasive carcinoma | Female | <65 | III/IV | Chemotherapy | cyclophosphamide | PD | |
| NUMB | SNV | Missense_Mutation | c.1876A>C | p.Lys626Gln | p.K626Q | P49757 | protein_coding | deleterious(0) | possibly_damaging(0.811) | TCGA-D8-A1JP-01 | Breast | breast invasive carcinoma | Female | >=65 | I/II | Hormone Therapy | tamoxiphen | SD | |
| NUMB | SNV | Missense_Mutation | c.601A>T | p.Thr201Ser | p.T201S | P49757 | protein_coding | tolerated(0.44) | possibly_damaging(0.692) | TCGA-E9-A1NF-01 | Breast | breast invasive carcinoma | Female | <65 | I/II | Chemotherapy | doxorubicin | PD | |
| NUMB | SNV | Missense_Mutation | c.1024N>A | p.Glu342Lys | p.E342K | P49757 | protein_coding | deleterious(0.05) | benign(0.24) | TCGA-C5-A1MH-01 | Cervix | cervical & endocervical cancer | Female | >=65 | III/IV | Chemotherapy | cisplatin | PD | |
| NUMB | SNV | Missense_Mutation | rs774508876 | c.874N>T | p.Arg292Cys | p.R292C | P49757 | protein_coding | deleterious(0) | probably_damaging(0.999) | TCGA-EA-A3HS-01 | Cervix | cervical & endocervical cancer | Female | <65 | I/II | Unknown | Unknown | SD |
| NUMB | SNV | Missense_Mutation | rs149035382 | c.1175G>A | p.Arg392His | p.R392H | P49757 | protein_coding | tolerated(0.08) | probably_damaging(0.959) | TCGA-A6-5665-01 | Colorectum | colon adenocarcinoma | Female | >=65 | I/II | Unknown | Unknown | PD |
| NUMB | SNV | Missense_Mutation | c.514C>T | p.Arg172Trp | p.R172W | P49757 | protein_coding | deleterious(0) | probably_damaging(0.997) | TCGA-A6-6141-01 | Colorectum | colon adenocarcinoma | Male | <65 | I/II | Chemotherapy | 5-fu | SD |
| Page: 1 2 3 4 5 6 7 8 |
Top |
Related drugs of malignant transformation related genes |
| Identification of chemicals and drugs interact with genes involved in malignant transfromation |
| (DGIdb 4.0) |
| Entrez ID | Symbol | Category | Interaction Types | Drug Claim Name | Drug Name | PMIDs |
| Page: 1 |

Copyright 2023-Present -The University of Texas Health Science Center at Houston |