
|
|||||
|
 | |
| |
| |
| |
| |
| |
|
Gene: N4BP1 |
Gene summary for N4BP1 |
| Gene information | Species | Human | Gene symbol | N4BP1 | Gene ID | 9683 |
| Gene name | NEDD4 binding protein 1 | |
| Gene Alias | N4BP1 | |
| Cytomap | 16q12.1 | |
| Gene Type | protein-coding | GO ID | GO:0001816 | UniProtAcc | O75113 |
Top |
Malignant transformation analysis |
| Identification of the aberrant gene expression in precancerous and cancerous lesions by comparing the gene expression of stem-like cells in diseased tissues with normal stem cells |
| Entrez ID | Symbol | Replicates | Species | Organ | Tissue | Adj P-value | Log2FC | Malignancy |
| 9683 | N4BP1 | CCI_1 | Human | Cervix | CC | 1.52e-03 | 6.20e-01 | 0.528 |
| 9683 | N4BP1 | CCI_2 | Human | Cervix | CC | 2.70e-07 | 1.04e+00 | 0.5249 |
| 9683 | N4BP1 | CCI_3 | Human | Cervix | CC | 5.41e-06 | 8.63e-01 | 0.516 |
| 9683 | N4BP1 | sample3 | Human | Cervix | CC | 1.14e-04 | 2.31e-01 | 0.1387 |
| 9683 | N4BP1 | T3 | Human | Cervix | CC | 1.94e-04 | 2.46e-01 | 0.1389 |
| 9683 | N4BP1 | LZE4T | Human | Esophagus | ESCC | 2.67e-11 | 3.32e-01 | 0.0811 |
| 9683 | N4BP1 | LZE7T | Human | Esophagus | ESCC | 5.24e-07 | 2.85e-01 | 0.0667 |
| 9683 | N4BP1 | LZE8T | Human | Esophagus | ESCC | 9.08e-07 | 1.35e-01 | 0.067 |
| 9683 | N4BP1 | LZE20T | Human | Esophagus | ESCC | 3.68e-07 | 3.43e-01 | 0.0662 |
| 9683 | N4BP1 | LZE22T | Human | Esophagus | ESCC | 8.82e-04 | 2.97e-01 | 0.068 |
| 9683 | N4BP1 | LZE24T | Human | Esophagus | ESCC | 2.50e-17 | 4.24e-01 | 0.0596 |
| 9683 | N4BP1 | LZE21T | Human | Esophagus | ESCC | 3.02e-05 | 2.78e-01 | 0.0655 |
| 9683 | N4BP1 | P1T-E | Human | Esophagus | ESCC | 8.86e-17 | 7.60e-01 | 0.0875 |
| 9683 | N4BP1 | P2T-E | Human | Esophagus | ESCC | 7.05e-32 | 1.67e-01 | 0.1177 |
| 9683 | N4BP1 | P4T-E | Human | Esophagus | ESCC | 9.70e-20 | 5.09e-01 | 0.1323 |
| 9683 | N4BP1 | P5T-E | Human | Esophagus | ESCC | 4.29e-22 | 3.85e-01 | 0.1327 |
| 9683 | N4BP1 | P8T-E | Human | Esophagus | ESCC | 9.09e-16 | 2.80e-01 | 0.0889 |
| 9683 | N4BP1 | P9T-E | Human | Esophagus | ESCC | 1.06e-09 | 1.74e-01 | 0.1131 |
| 9683 | N4BP1 | P10T-E | Human | Esophagus | ESCC | 2.67e-15 | 1.23e-01 | 0.116 |
| 9683 | N4BP1 | P11T-E | Human | Esophagus | ESCC | 2.06e-10 | 4.49e-01 | 0.1426 |
| Page: 1 2 3 4 5 6 |
| Tissue | Expression Dynamics | Abbreviation |
| Cervix | 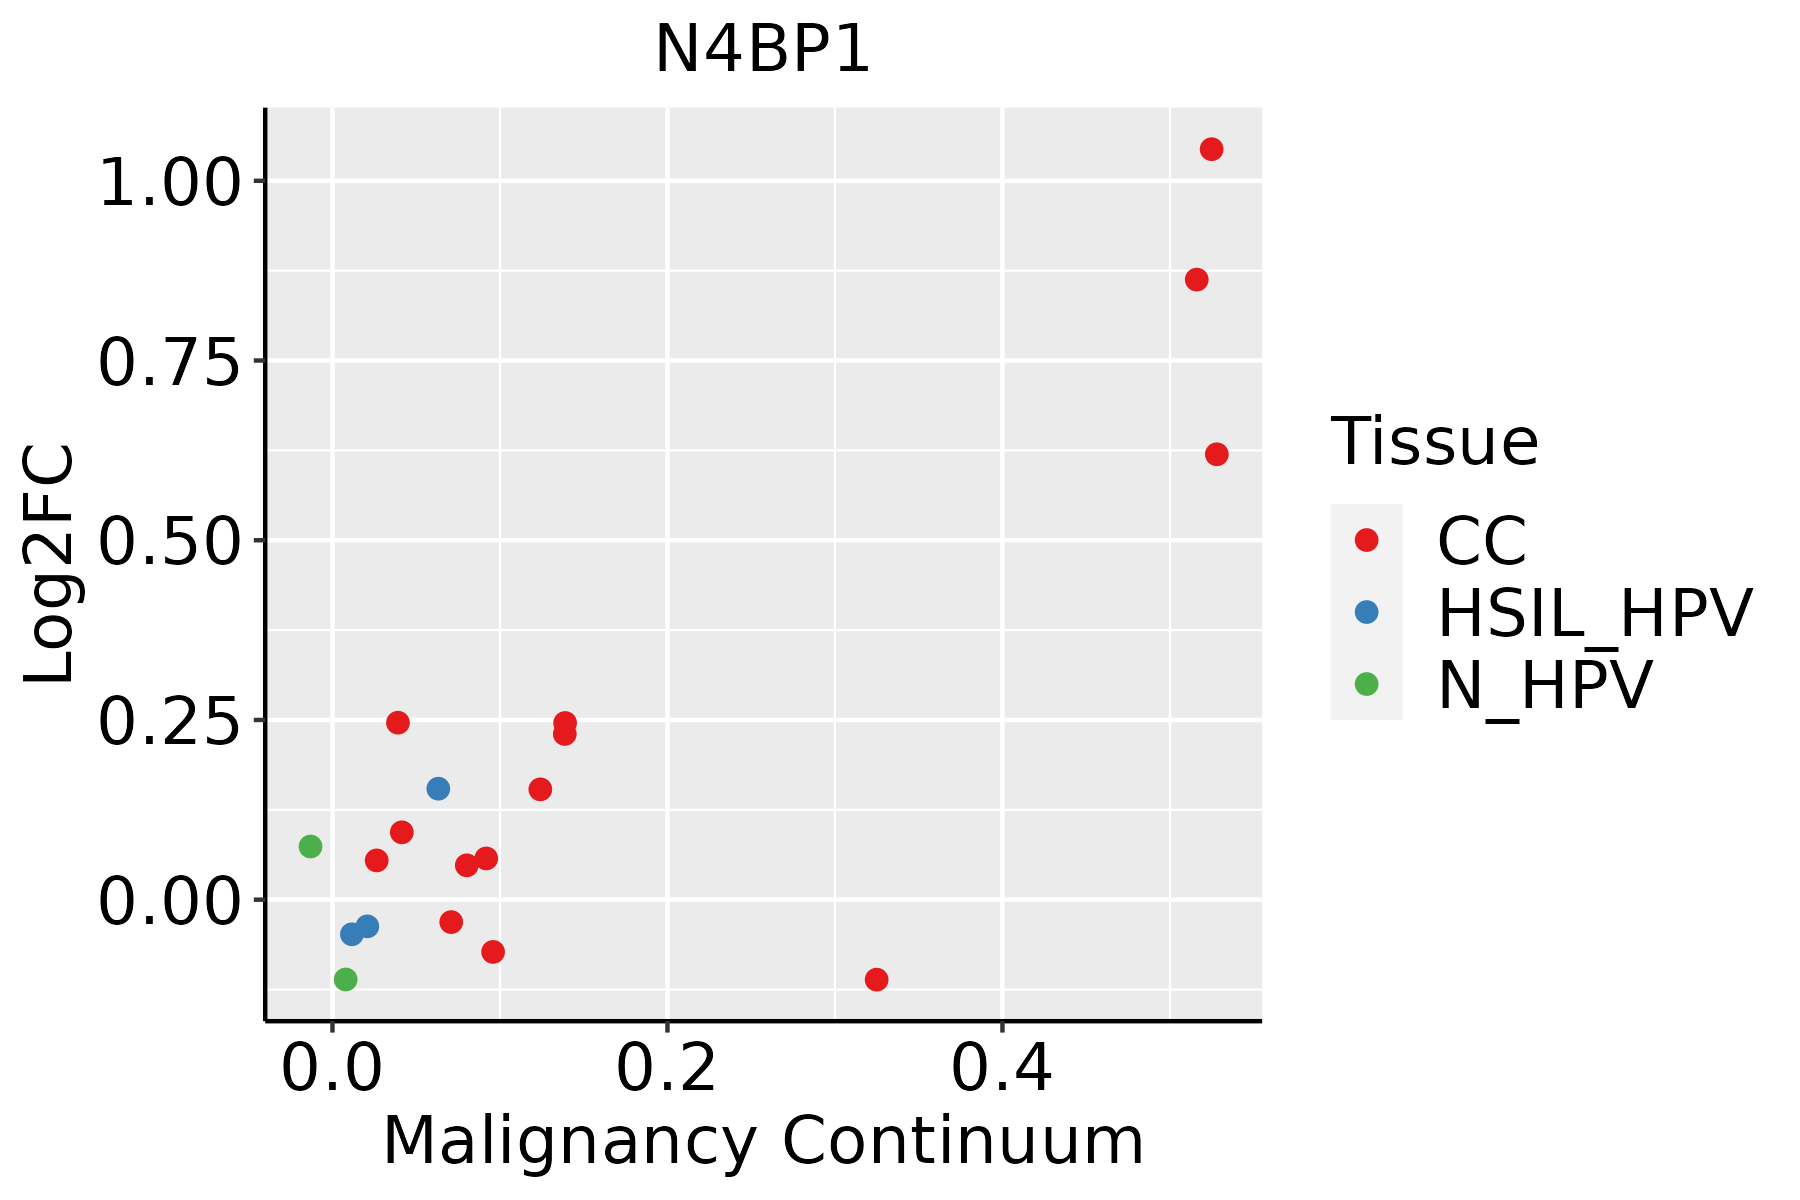 | CC: Cervix cancer |
| HSIL_HPV: HPV-infected high-grade squamous intraepithelial lesions | ||
| N_HPV: HPV-infected normal cervix | ||
| Esophagus | 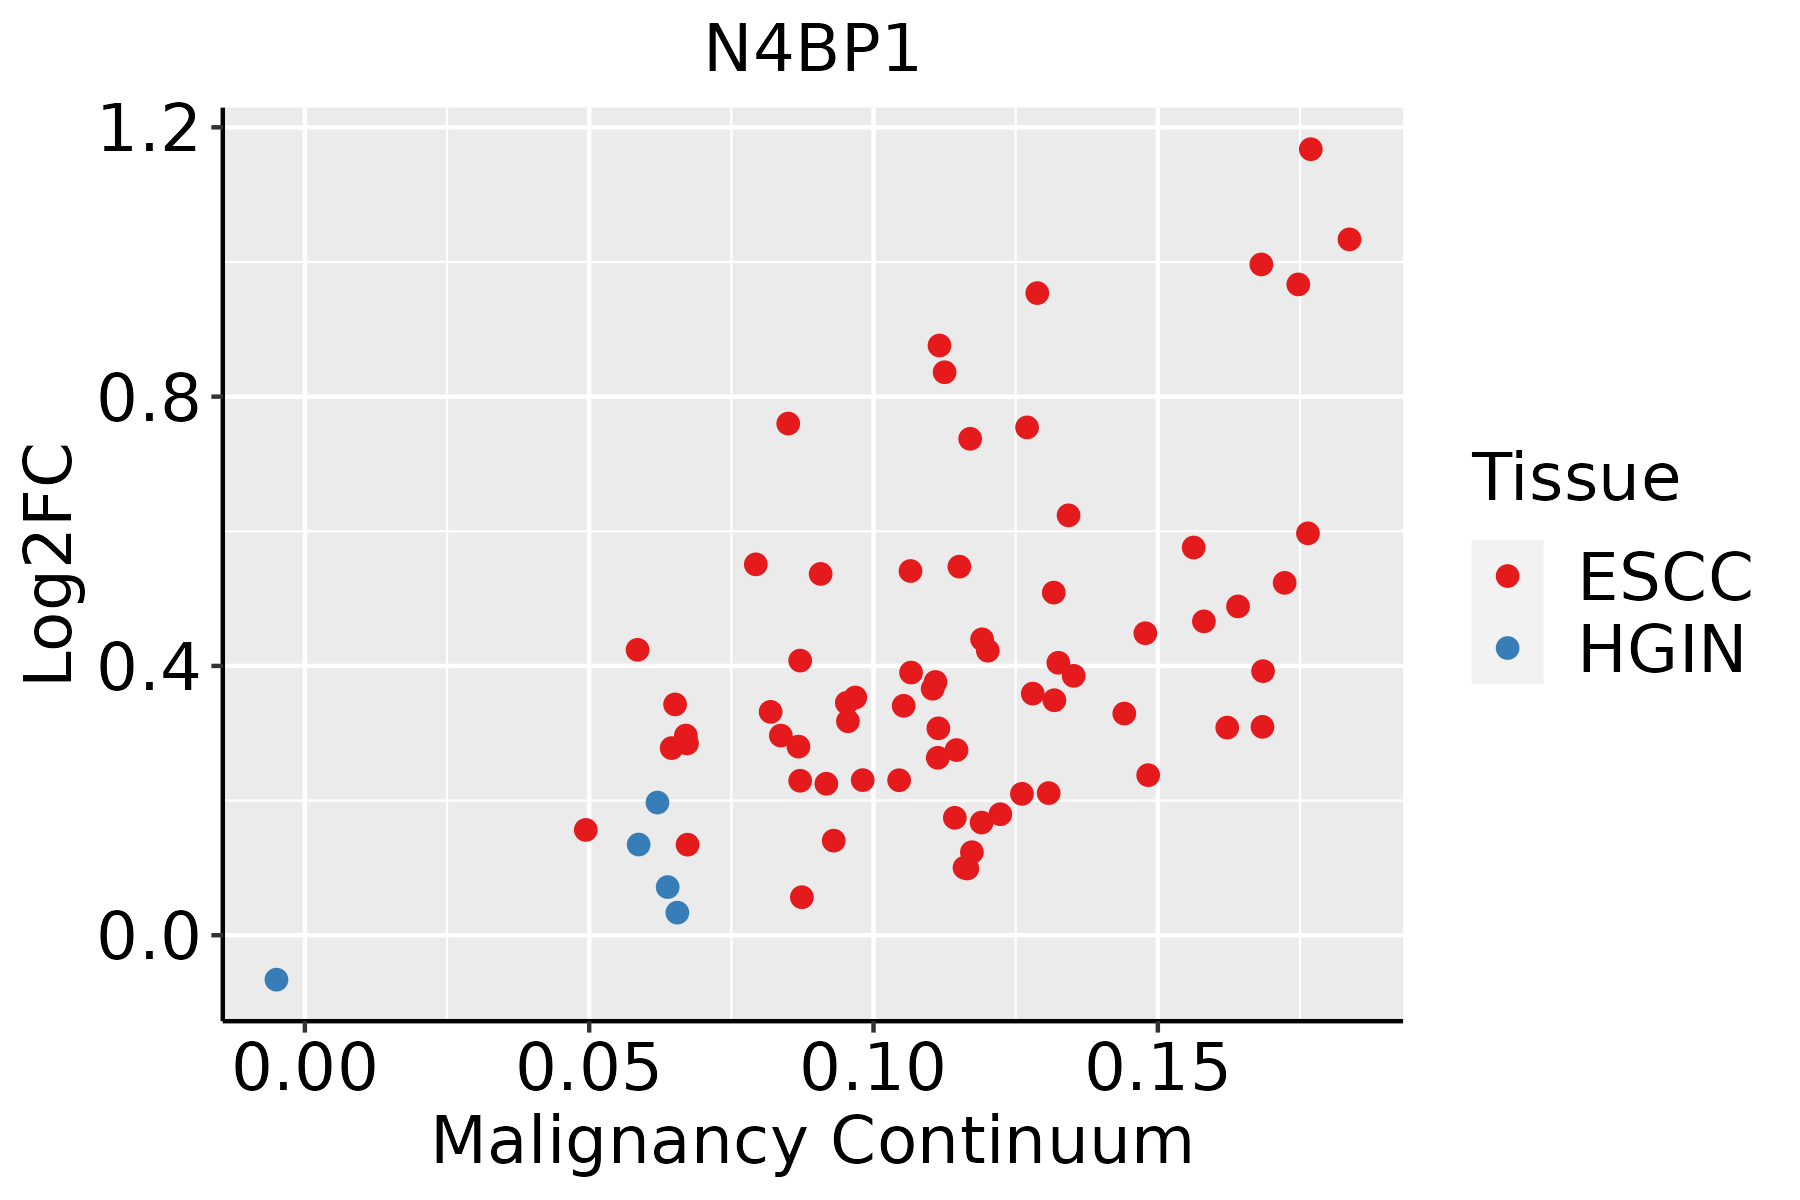 | ESCC: Esophageal squamous cell carcinoma |
| HGIN: High-grade intraepithelial neoplasias | ||
| LGIN: Low-grade intraepithelial neoplasias | ||
| Liver |  | HCC: Hepatocellular carcinoma |
| NAFLD: Non-alcoholic fatty liver disease | ||
| Oral Cavity | 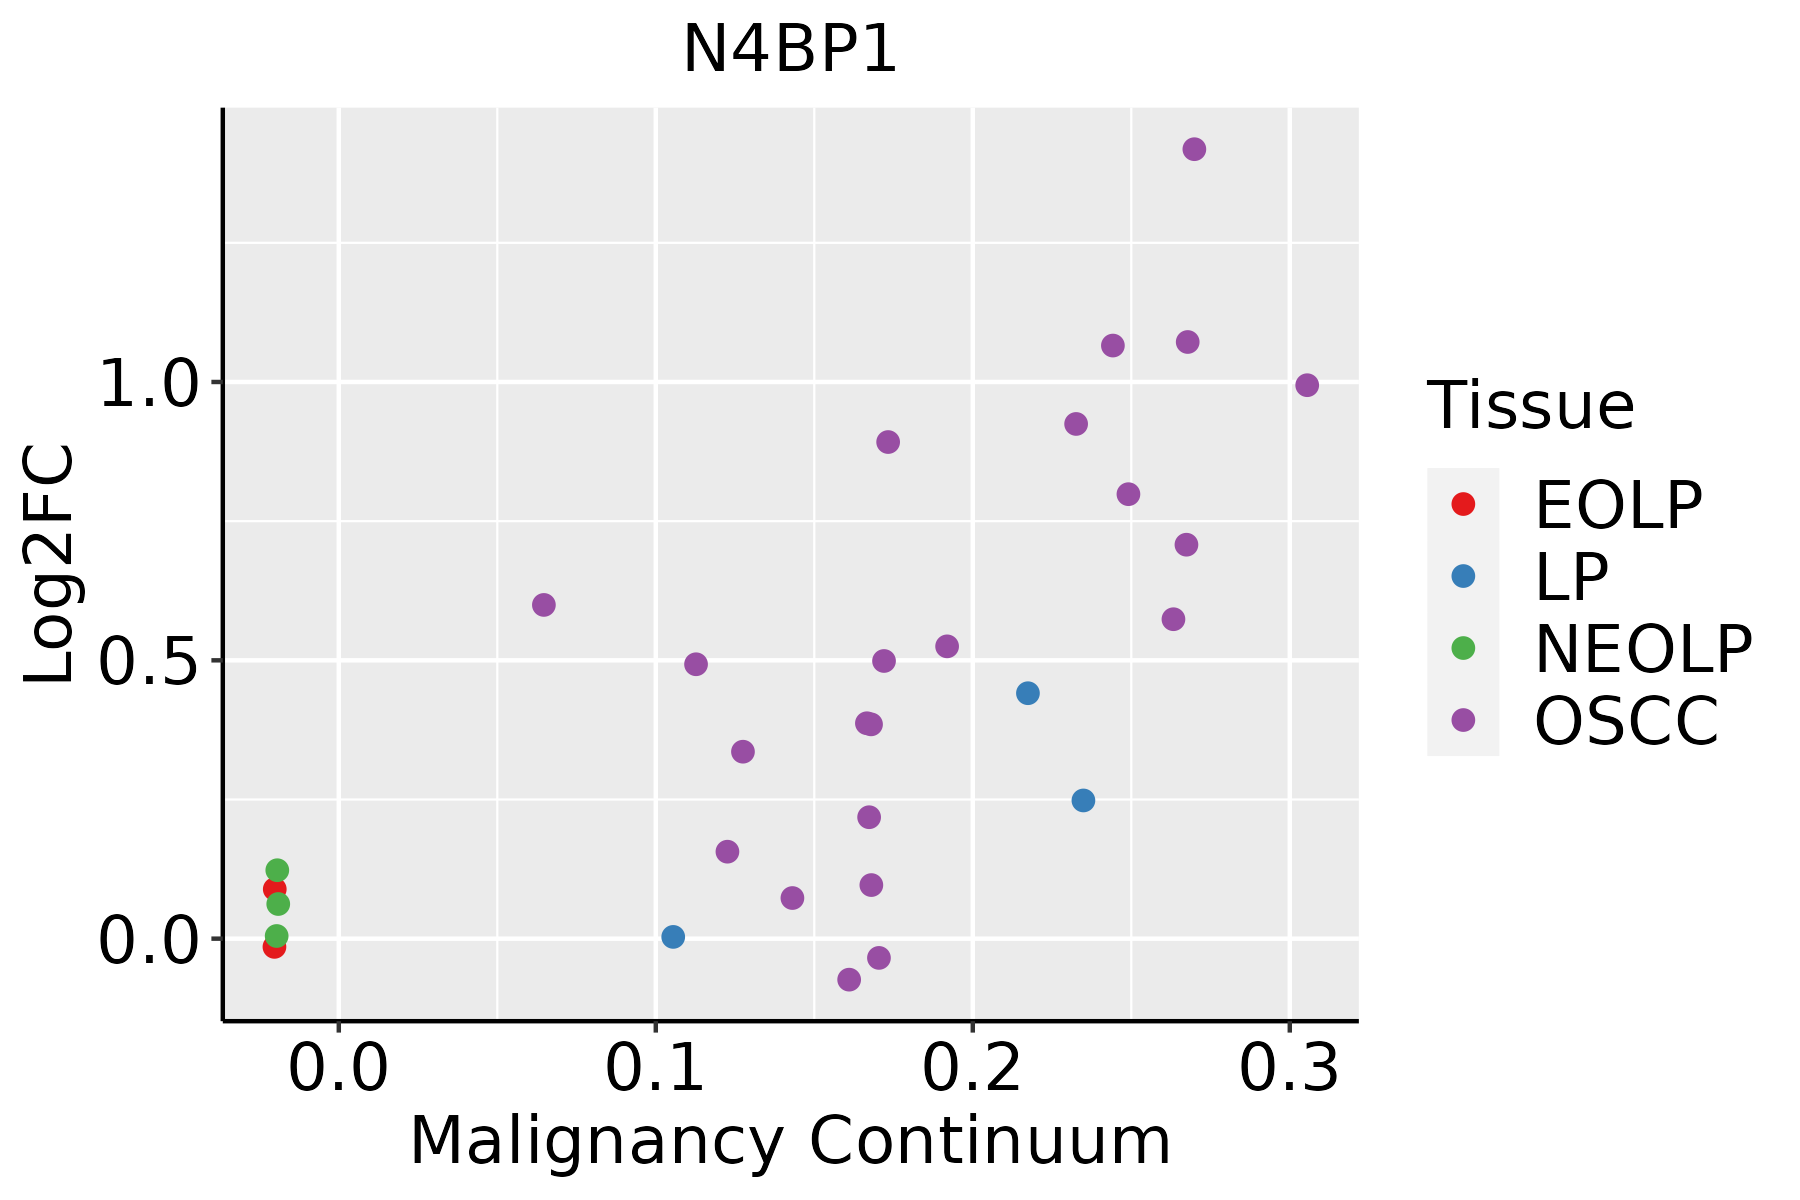 | EOLP: Erosive Oral lichen planus |
| LP: leukoplakia | ||
| NEOLP: Non-erosive oral lichen planus | ||
| OSCC: Oral squamous cell carcinoma | ||
| Skin | 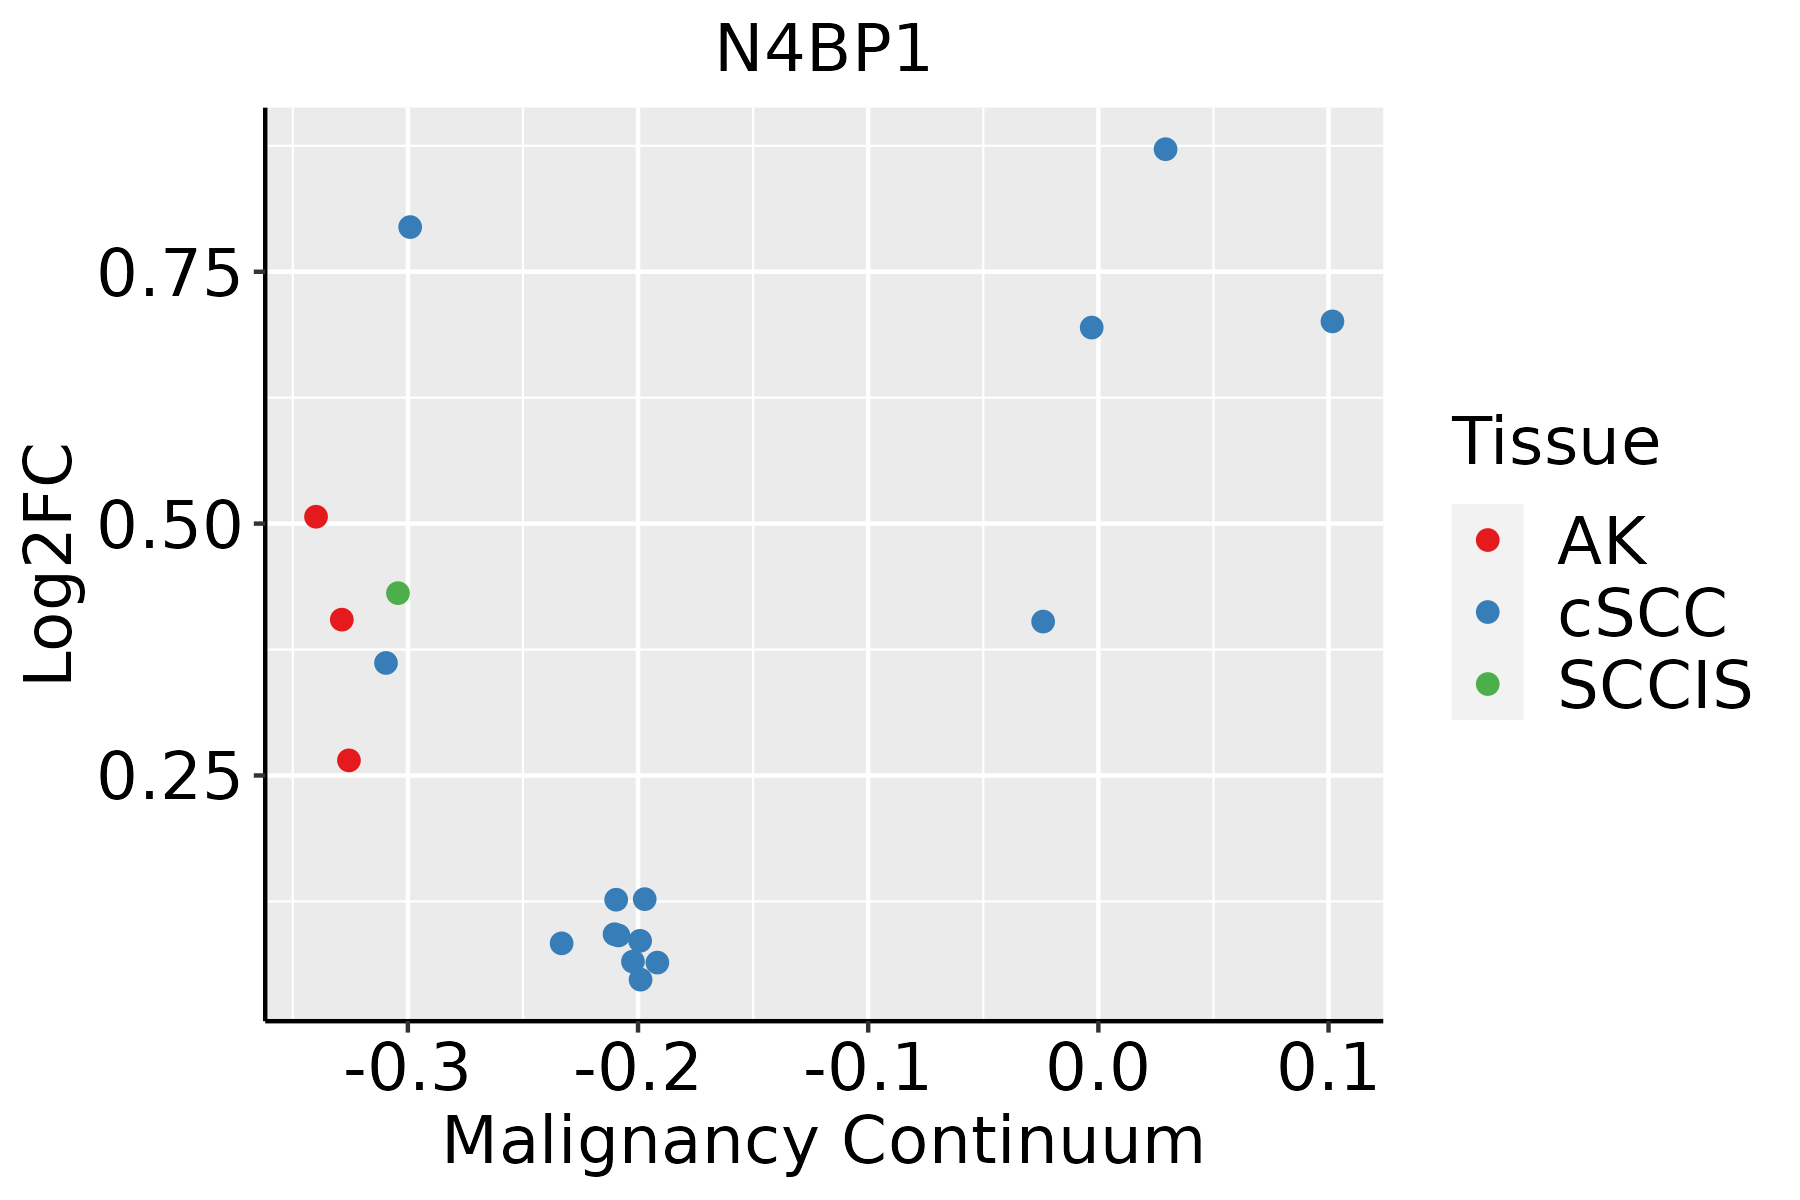 | AK: Actinic keratosis |
| cSCC: Cutaneous squamous cell carcinoma | ||
| SCCIS:squamous cell carcinoma in situ | ||
| Thyroid |  | ATC: Anaplastic thyroid cancer |
| HT: Hashimoto's thyroiditis | ||
| PTC: Papillary thyroid cancer |
| ∗log2FC in expression of this searched gene in stem-like cells from each diseased tissue sample relative to stem-like cells in normal samples in each tissue plotted against the malignancy continuum. Samples are colored based on if they are from different disease stage. |
Top |
Malignant transformation related pathway analysis |
| Find out the enriched GO biological processes and KEGG pathways involved in transition from healthy to precancer to cancer |
| Tissue | Disease Stage | Enriched GO biological Processes |
| Colorectum | AD |  |
| Colorectum | SER |  |
| Colorectum | MSS |  |
| Colorectum | MSI-H |  |
| Colorectum | FAP |  |
| ∗Top 15 enriched GO BP terms are showed in the bar plot of each disease state in each tissue. Each row represents a significant GO biological process which is colored according to the -log10(p.adjust). |
| Page: 1 2 3 4 5 6 7 8 9 |
| GO ID | Tissue | Disease Stage | Description | Gene Ratio | Bg Ratio | pvalue | p.adjust | Count |
| GO:190179915 | Thyroid | ATC | negative regulation of proteasomal protein catabolic process | 27/6293 | 49/18723 | 1.58e-03 | 7.99e-03 | 27 |
| GO:004508813 | Thyroid | ATC | regulation of innate immune response | 94/6293 | 218/18723 | 2.05e-03 | 9.71e-03 | 94 |
| GO:004507110 | Thyroid | ATC | negative regulation of viral genome replication | 29/6293 | 56/18723 | 3.76e-03 | 1.64e-02 | 29 |
| GO:004852518 | Thyroid | ATC | negative regulation of viral process | 43/6293 | 92/18723 | 6.02e-03 | 2.42e-02 | 43 |
| GO:009030511 | Thyroid | ATC | nucleic acid phosphodiester bond hydrolysis | 107/6293 | 261/18723 | 7.21e-03 | 2.84e-02 | 107 |
| Page: 1 2 3 4 5 6 7 8 9 10 11 12 13 14 15 16 17 18 |
| Pathway ID | Tissue | Disease Stage | Description | Gene Ratio | Bg Ratio | pvalue | p.adjust | qvalue | Count |
| Page: 1 |
Top |
Cell-cell communication analysis |
| Identification of potential cell-cell interactions between two cell types and their ligand-receptor pairs for different disease states |
| Ligand | Receptor | LRpair | Pathway | Tissue | Disease Stage |
| Page: 1 |
Top |
Single-cell gene regulatory network inference analysis |
| Find out the significant the regulons (TFs) and the target genes of each regulon across cell types for different disease states |
| TF | Cell Type | Tissue | Disease Stage | Target Gene | RSS | Regulon Activity |
| ∗The dot plots of a searched regulon are shown for all cell subpopulations in each disease state of each tissue based on the regulon specific score inferred using pySCENIC and by calculating the average expression. |
| Page: 1 |
Top |
Somatic mutation of malignant transformation related genes |
| Annotation of somatic variants for genes involved in malignant transformation |
| Hugo Symbol | Variant Class | Variant Classification | dbSNP RS | HGVSc | HGVSp | HGVSp Short | SWISSPROT | BIOTYPE | SIFT | PolyPhen | Tumor Sample Barcode | Tissue | Histology | Sex | Age | Stage | Therapy Types | Drugs | Outcome |
| N4BP1 | SNV | Missense_Mutation | rs773100602 | c.2605G>C | p.Glu869Gln | p.E869Q | O75113 | protein_coding | tolerated(0.08) | probably_damaging(0.987) | TCGA-A8-A095-01 | Breast | breast invasive carcinoma | Female | <65 | I/II | Chemotherapy | 5-fluorouracil | CR |
| N4BP1 | SNV | Missense_Mutation | c.722G>A | p.Gly241Glu | p.G241E | O75113 | protein_coding | deleterious(0) | possibly_damaging(0.762) | TCGA-AC-A23C-01 | Breast | breast invasive carcinoma | Female | <65 | I/II | Chemotherapy | chemo | CR | |
| N4BP1 | SNV | Missense_Mutation | c.1184N>C | p.Arg395Thr | p.R395T | O75113 | protein_coding | tolerated(0.18) | benign(0.003) | TCGA-AR-A0TT-01 | Breast | breast invasive carcinoma | Female | <65 | III/IV | Chemotherapy | doxorubicin | SD | |
| N4BP1 | SNV | Missense_Mutation | c.855N>C | p.Arg285Ser | p.R285S | O75113 | protein_coding | deleterious(0) | probably_damaging(0.996) | TCGA-AR-A0TT-01 | Breast | breast invasive carcinoma | Female | <65 | III/IV | Chemotherapy | doxorubicin | SD | |
| N4BP1 | SNV | Missense_Mutation | novel | c.799N>G | p.Asn267Asp | p.N267D | O75113 | protein_coding | deleterious(0.02) | possibly_damaging(0.541) | TCGA-AR-A0TU-01 | Breast | breast invasive carcinoma | Female | <65 | I/II | Unspecific | Doxorubicin | SD |
| N4BP1 | SNV | Missense_Mutation | c.2113G>A | p.Asp705Asn | p.D705N | O75113 | protein_coding | deleterious(0) | probably_damaging(0.966) | TCGA-C8-A12Q-01 | Breast | breast invasive carcinoma | Female | >=65 | III/IV | Unknown | Unknown | PD | |
| N4BP1 | insertion | Frame_Shift_Ins | novel | c.2559_2560insTGTGG | p.Thr854CysfsTer6 | p.T854Cfs*6 | O75113 | protein_coding | TCGA-AN-A046-01 | Breast | breast invasive carcinoma | Female | >=65 | I/II | Unknown | Unknown | SD | ||
| N4BP1 | insertion | Frame_Shift_Ins | novel | c.2558_2559insTGCGTCCGTGATGCCTCCTA | p.Glu853AspfsTer12 | p.E853Dfs*12 | O75113 | protein_coding | TCGA-AN-A046-01 | Breast | breast invasive carcinoma | Female | >=65 | I/II | Unknown | Unknown | SD | ||
| N4BP1 | insertion | Nonsense_Mutation | novel | c.1735_1736insATGGAGGCACCTTTAGGCCAAATTTAATTTAATTTAA | p.Ser579TyrfsTer11 | p.S579Yfs*11 | O75113 | protein_coding | TCGA-AO-A03T-01 | Breast | breast invasive carcinoma | Female | <65 | I/II | Chemotherapy | cyclophosphamide | SD | ||
| N4BP1 | insertion | Frame_Shift_Ins | novel | c.797_798insGGTTCAGT | p.Ile266MetfsTer4 | p.I266Mfs*4 | O75113 | protein_coding | TCGA-AR-A0TU-01 | Breast | breast invasive carcinoma | Female | <65 | I/II | Unspecific | Doxorubicin | SD |
| Page: 1 2 3 4 5 6 7 8 9 10 11 |
Top |
Related drugs of malignant transformation related genes |
| Identification of chemicals and drugs interact with genes involved in malignant transfromation |
| (DGIdb 4.0) |
| Entrez ID | Symbol | Category | Interaction Types | Drug Claim Name | Drug Name | PMIDs |
| Page: 1 |

Copyright 2023-Present -The University of Texas Health Science Center at Houston |