
|
|||||
|
 | |
| |
| |
| |
| |
| |
|
Gene: LARP4 |
Gene summary for LARP4 |
| Gene information | Species | Human | Gene symbol | LARP4 | Gene ID | 113251 |
| Gene name | La ribonucleoprotein 4 | |
| Gene Alias | PP13296 | |
| Cytomap | 12q13.12 | |
| Gene Type | protein-coding | GO ID | GO:0000902 | UniProtAcc | Q6P4E2 |
Top |
Malignant transformation analysis |
| Identification of the aberrant gene expression in precancerous and cancerous lesions by comparing the gene expression of stem-like cells in diseased tissues with normal stem cells |
| Entrez ID | Symbol | Replicates | Species | Organ | Tissue | Adj P-value | Log2FC | Malignancy |
| 113251 | LARP4 | CCI_2 | Human | Cervix | CC | 3.36e-09 | 1.05e+00 | 0.5249 |
| 113251 | LARP4 | CCI_3 | Human | Cervix | CC | 2.57e-04 | 6.18e-01 | 0.516 |
| 113251 | LARP4 | LZE4T | Human | Esophagus | ESCC | 3.52e-06 | 2.70e-01 | 0.0811 |
| 113251 | LARP4 | LZE7T | Human | Esophagus | ESCC | 1.10e-04 | 3.02e-01 | 0.0667 |
| 113251 | LARP4 | LZE8T | Human | Esophagus | ESCC | 3.07e-04 | 1.63e-01 | 0.067 |
| 113251 | LARP4 | LZE20T | Human | Esophagus | ESCC | 2.98e-06 | 3.60e-02 | 0.0662 |
| 113251 | LARP4 | LZE24T | Human | Esophagus | ESCC | 5.87e-07 | 3.08e-01 | 0.0596 |
| 113251 | LARP4 | P1T-E | Human | Esophagus | ESCC | 1.34e-07 | 4.66e-01 | 0.0875 |
| 113251 | LARP4 | P2T-E | Human | Esophagus | ESCC | 7.72e-26 | 7.43e-01 | 0.1177 |
| 113251 | LARP4 | P4T-E | Human | Esophagus | ESCC | 1.15e-20 | 6.70e-01 | 0.1323 |
| 113251 | LARP4 | P5T-E | Human | Esophagus | ESCC | 1.02e-14 | 4.13e-01 | 0.1327 |
| 113251 | LARP4 | P8T-E | Human | Esophagus | ESCC | 7.93e-27 | 5.06e-01 | 0.0889 |
| 113251 | LARP4 | P9T-E | Human | Esophagus | ESCC | 2.14e-06 | 1.98e-01 | 0.1131 |
| 113251 | LARP4 | P10T-E | Human | Esophagus | ESCC | 4.99e-23 | 3.67e-01 | 0.116 |
| 113251 | LARP4 | P11T-E | Human | Esophagus | ESCC | 1.88e-06 | 3.58e-01 | 0.1426 |
| 113251 | LARP4 | P12T-E | Human | Esophagus | ESCC | 7.56e-07 | 3.07e-01 | 0.1122 |
| 113251 | LARP4 | P15T-E | Human | Esophagus | ESCC | 2.09e-17 | 4.21e-01 | 0.1149 |
| 113251 | LARP4 | P16T-E | Human | Esophagus | ESCC | 6.07e-25 | 3.99e-01 | 0.1153 |
| 113251 | LARP4 | P17T-E | Human | Esophagus | ESCC | 2.53e-02 | 1.69e-01 | 0.1278 |
| 113251 | LARP4 | P19T-E | Human | Esophagus | ESCC | 1.61e-03 | 6.53e-01 | 0.1662 |
| Page: 1 2 3 4 5 |
| Tissue | Expression Dynamics | Abbreviation |
| Cervix | 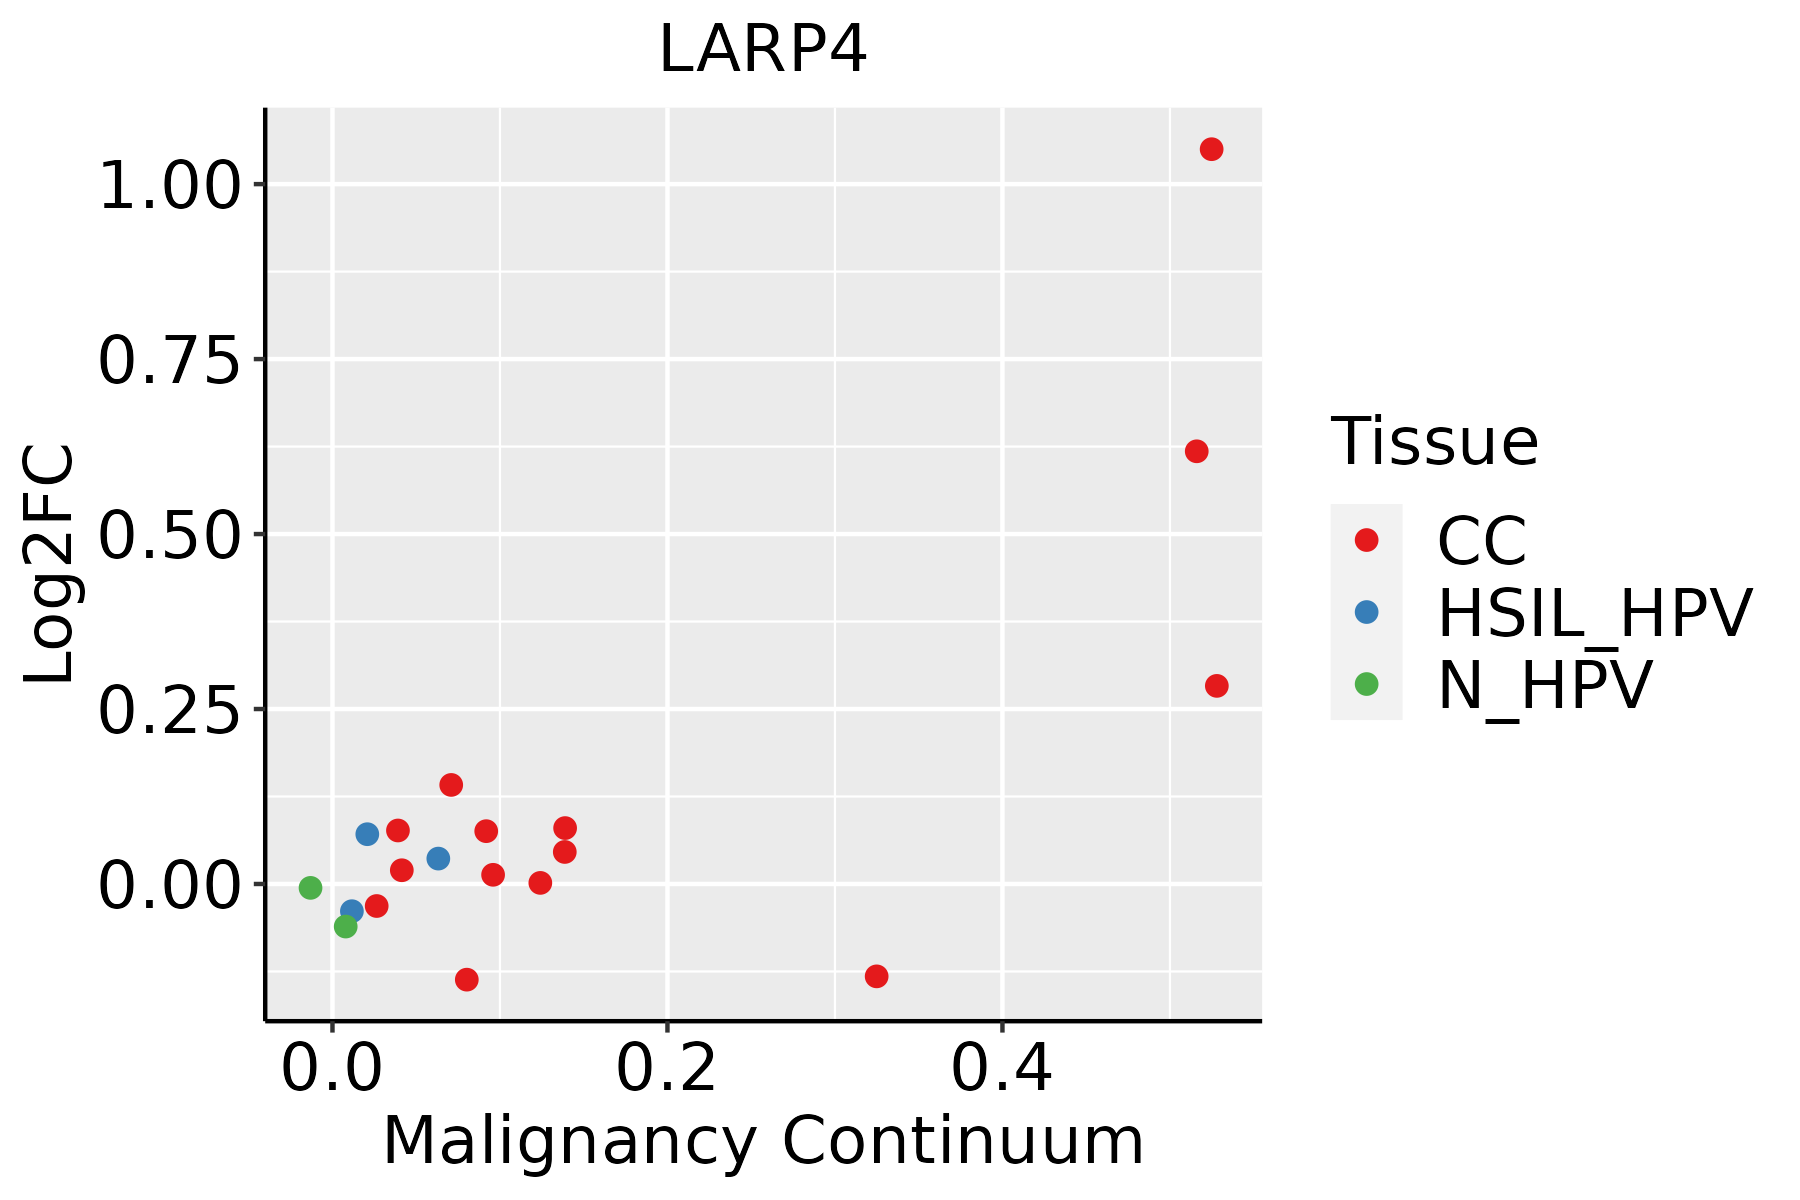 | CC: Cervix cancer |
| HSIL_HPV: HPV-infected high-grade squamous intraepithelial lesions | ||
| N_HPV: HPV-infected normal cervix | ||
| Esophagus | 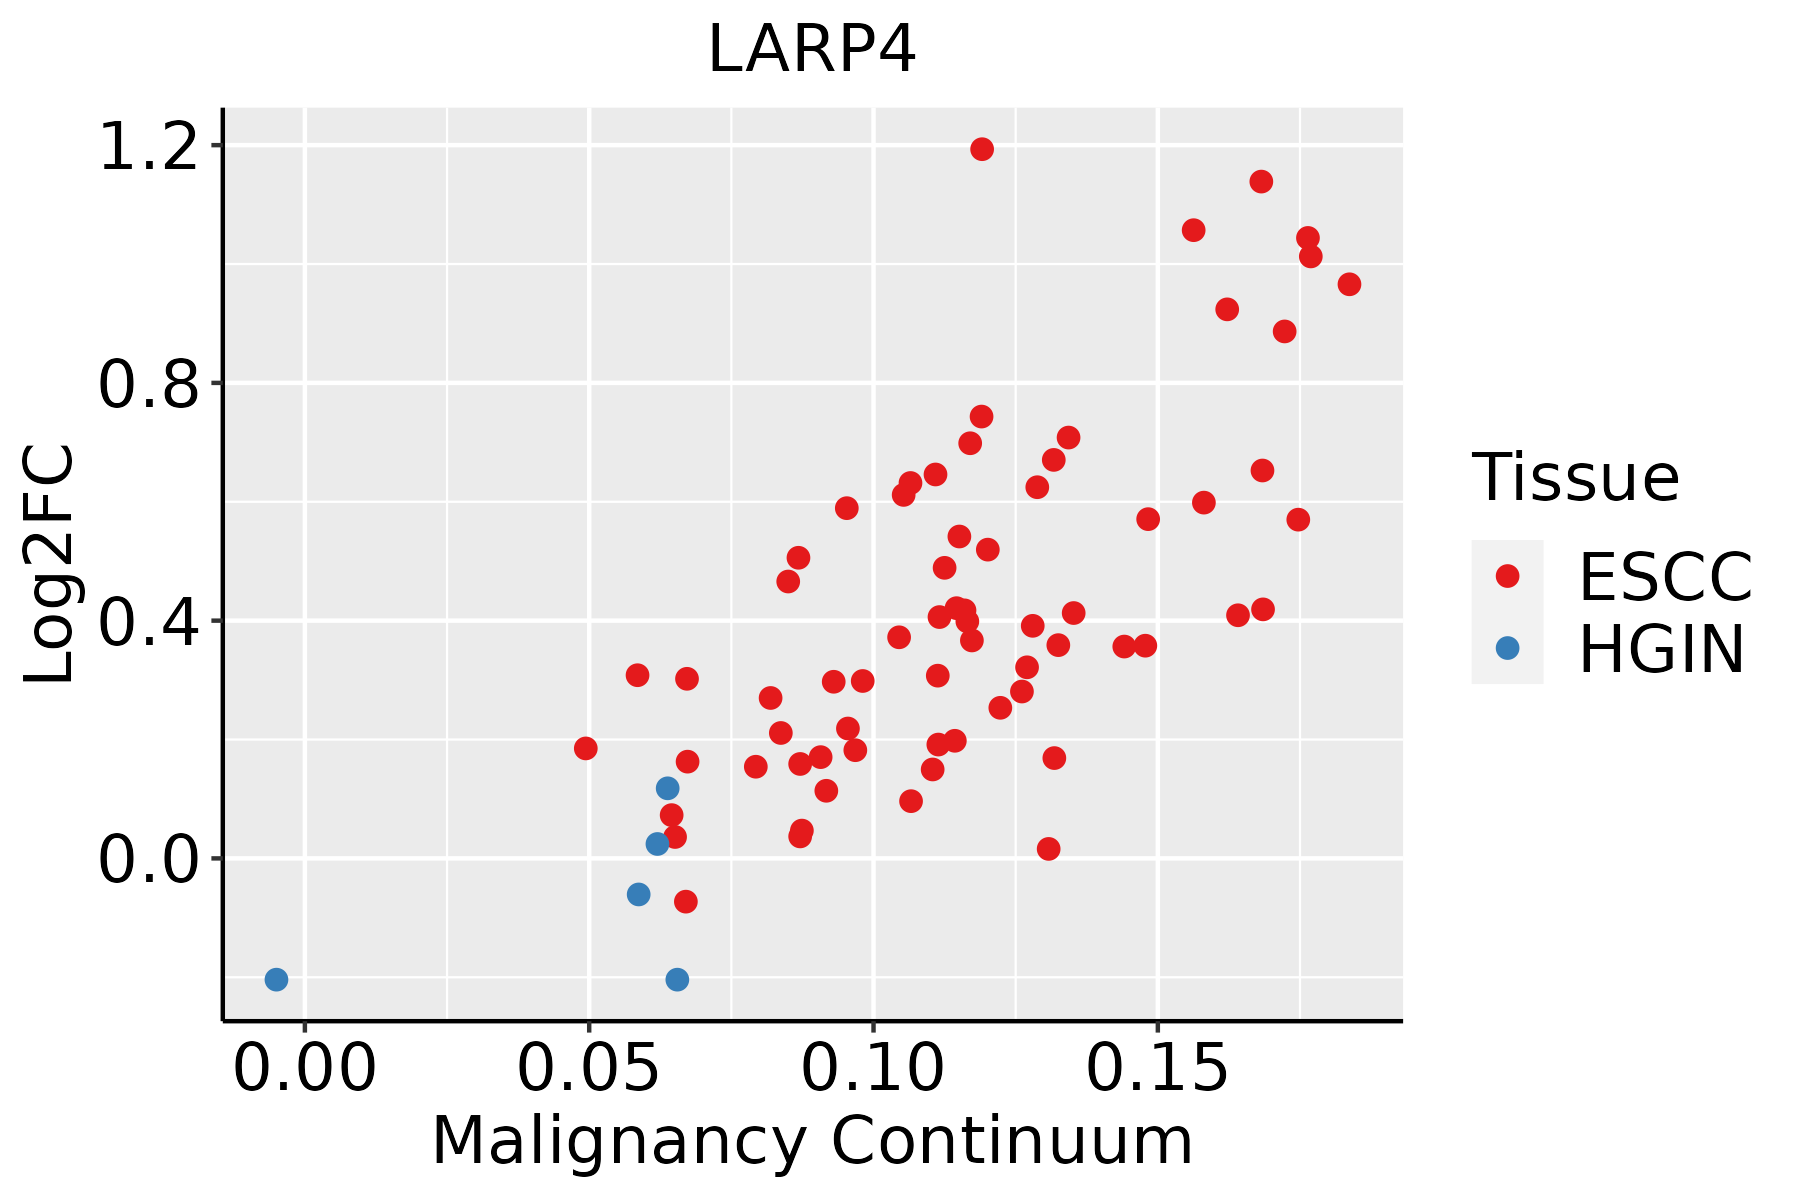 | ESCC: Esophageal squamous cell carcinoma |
| HGIN: High-grade intraepithelial neoplasias | ||
| LGIN: Low-grade intraepithelial neoplasias | ||
| Liver | 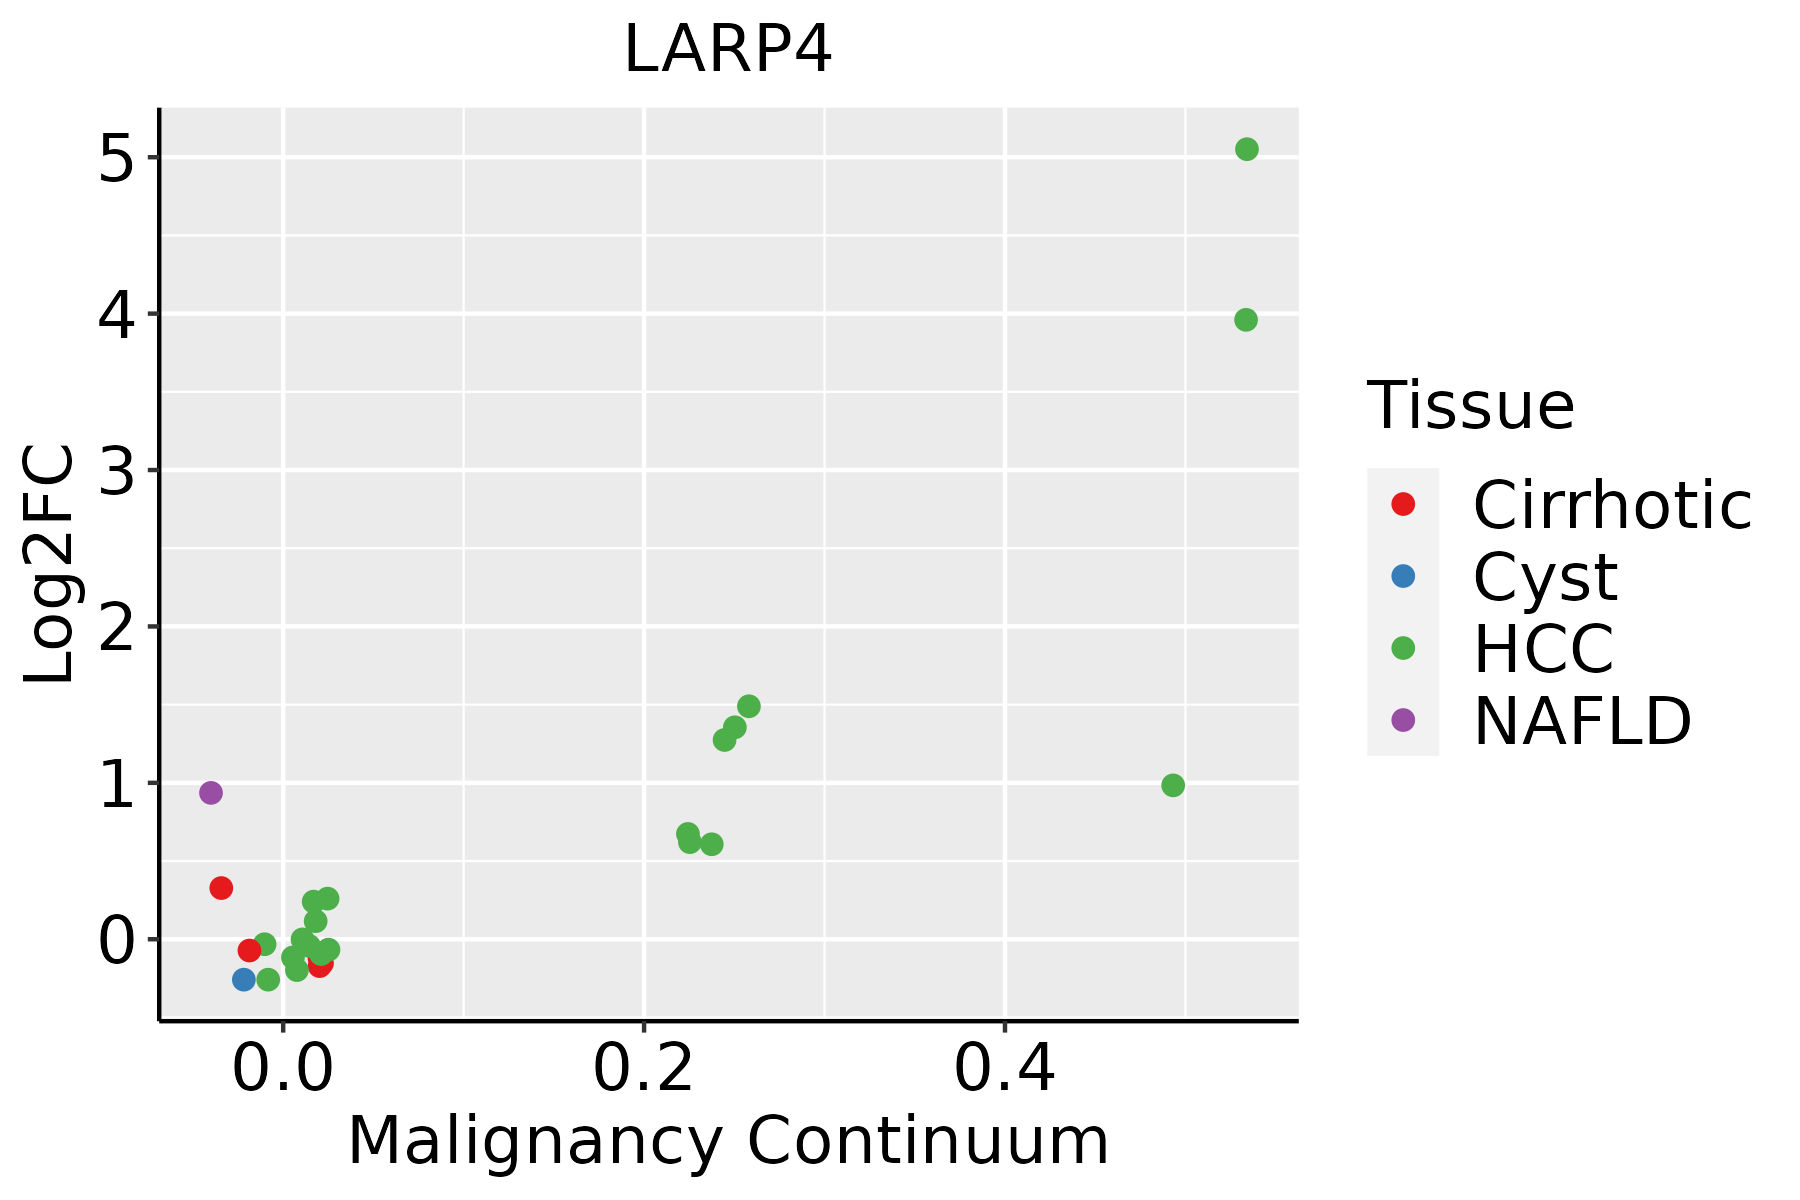 | HCC: Hepatocellular carcinoma |
| NAFLD: Non-alcoholic fatty liver disease | ||
| Thyroid | 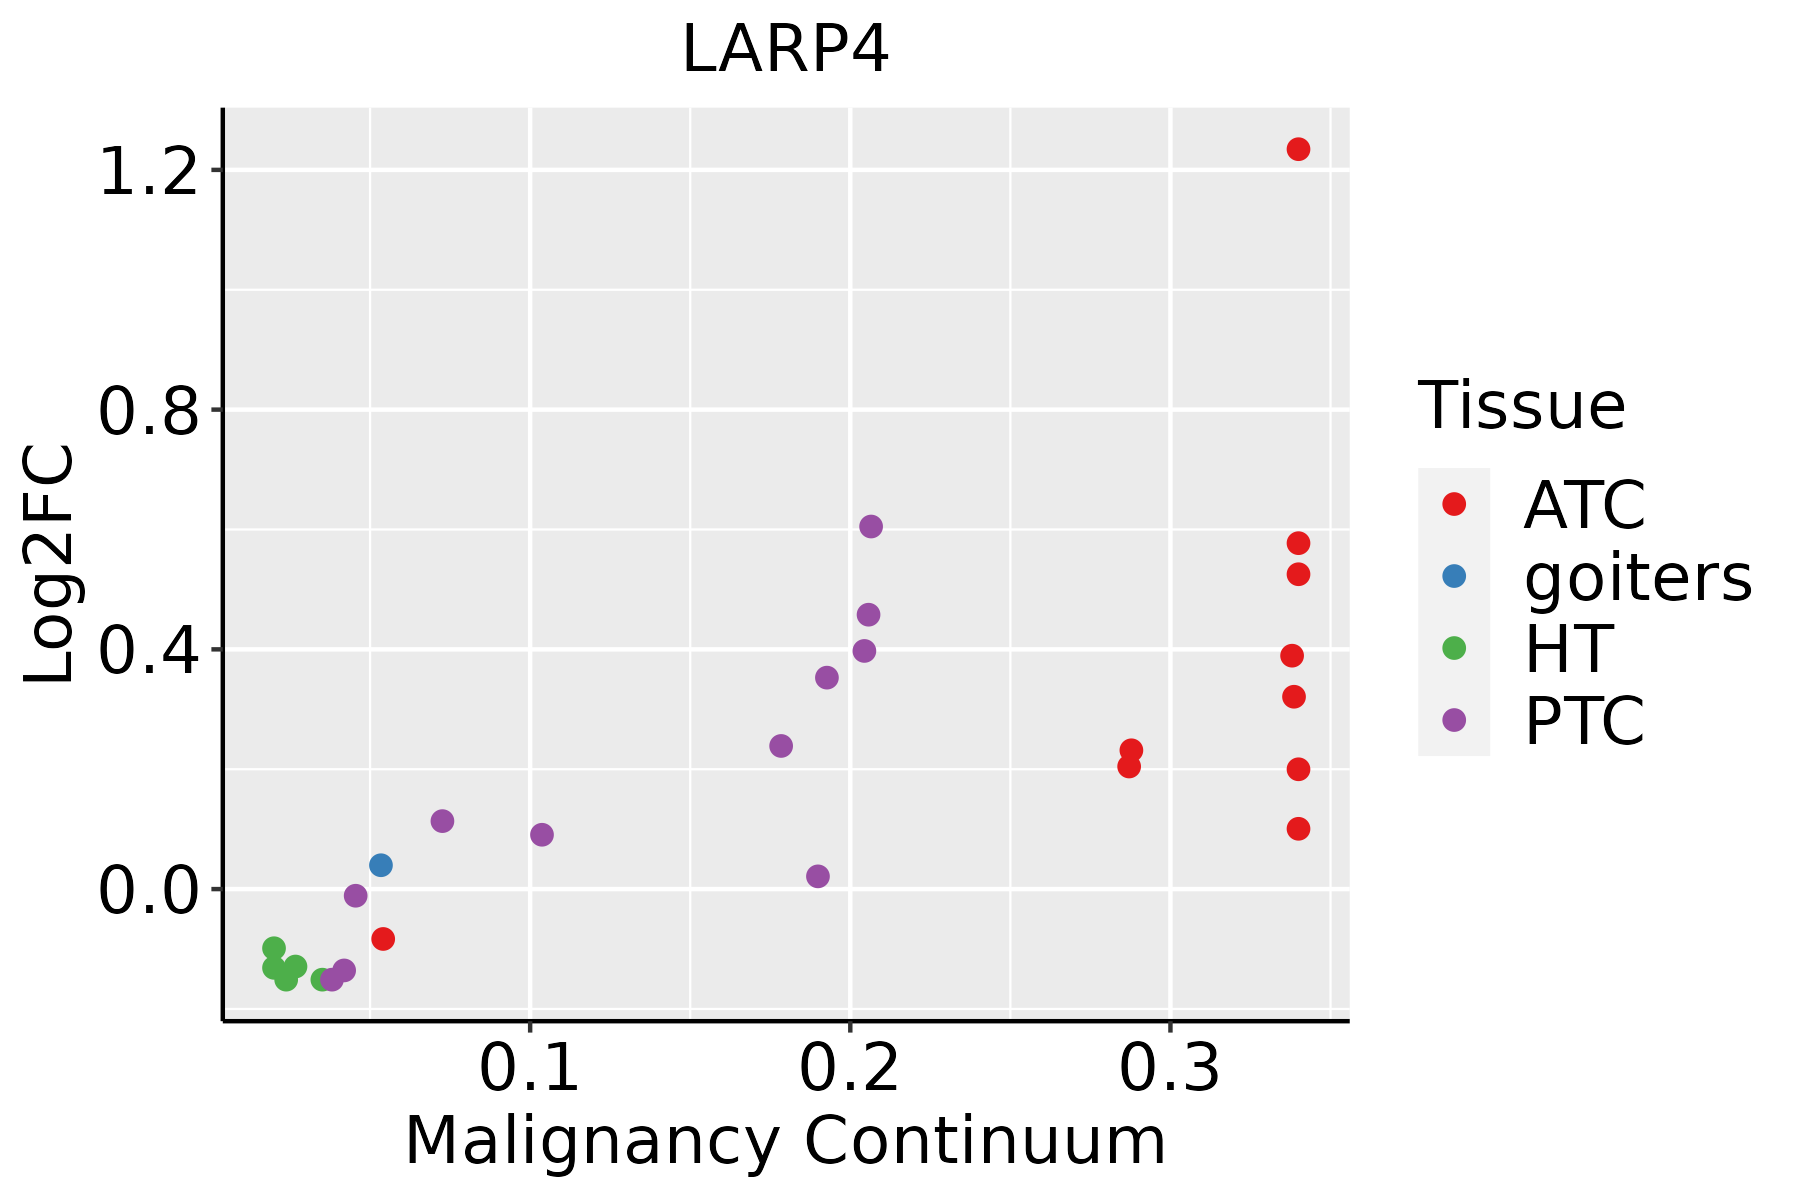 | ATC: Anaplastic thyroid cancer |
| HT: Hashimoto's thyroiditis | ||
| PTC: Papillary thyroid cancer |
| ∗log2FC in expression of this searched gene in stem-like cells from each diseased tissue sample relative to stem-like cells in normal samples in each tissue plotted against the malignancy continuum. Samples are colored based on if they are from different disease stage. |
Top |
Malignant transformation related pathway analysis |
| Find out the enriched GO biological processes and KEGG pathways involved in transition from healthy to precancer to cancer |
| Tissue | Disease Stage | Enriched GO biological Processes |
| Colorectum | AD |  |
| Colorectum | SER |  |
| Colorectum | MSS |  |
| Colorectum | MSI-H |  |
| Colorectum | FAP |  |
| ∗Top 15 enriched GO BP terms are showed in the bar plot of each disease state in each tissue. Each row represents a significant GO biological process which is colored according to the -log10(p.adjust). |
| Page: 1 2 3 4 5 6 7 8 9 |
| GO ID | Tissue | Disease Stage | Description | Gene Ratio | Bg Ratio | pvalue | p.adjust | Count |
| GO:000640117 | Prostate | Tumor | RNA catabolic process | 94/3246 | 278/18723 | 1.77e-11 | 1.25e-09 | 94 |
| GO:000989518 | Prostate | Tumor | negative regulation of catabolic process | 96/3246 | 320/18723 | 1.40e-08 | 5.07e-07 | 96 |
| GO:003133019 | Prostate | Tumor | negative regulation of cellular catabolic process | 81/3246 | 262/18723 | 4.42e-08 | 1.37e-06 | 81 |
| GO:190331219 | Prostate | Tumor | negative regulation of mRNA metabolic process | 38/3246 | 92/18723 | 5.44e-08 | 1.64e-06 | 38 |
| GO:006101315 | Prostate | Tumor | regulation of mRNA catabolic process | 57/3246 | 166/18723 | 8.79e-08 | 2.39e-06 | 57 |
| GO:003465516 | Prostate | Tumor | nucleobase-containing compound catabolic process | 112/3246 | 407/18723 | 1.61e-07 | 4.02e-06 | 112 |
| GO:004348815 | Prostate | Tumor | regulation of mRNA stability | 54/3246 | 158/18723 | 2.26e-07 | 5.42e-06 | 54 |
| GO:004670014 | Prostate | Tumor | heterocycle catabolic process | 117/3246 | 445/18723 | 1.11e-06 | 2.10e-05 | 117 |
| GO:004427015 | Prostate | Tumor | cellular nitrogen compound catabolic process | 118/3246 | 451/18723 | 1.30e-06 | 2.39e-05 | 118 |
| GO:004348715 | Prostate | Tumor | regulation of RNA stability | 54/3246 | 170/18723 | 3.00e-06 | 4.95e-05 | 54 |
| GO:190136114 | Prostate | Tumor | organic cyclic compound catabolic process | 124/3246 | 495/18723 | 7.37e-06 | 1.10e-04 | 124 |
| GO:001943914 | Prostate | Tumor | aromatic compound catabolic process | 118/3246 | 467/18723 | 7.92e-06 | 1.17e-04 | 118 |
| GO:190236912 | Prostate | Tumor | negative regulation of RNA catabolic process | 24/3246 | 75/18723 | 1.41e-03 | 8.80e-03 | 24 |
| GO:190237312 | Prostate | Tumor | negative regulation of mRNA catabolic process | 21/3246 | 63/18723 | 1.55e-03 | 9.51e-03 | 21 |
| GO:004825513 | Prostate | Tumor | mRNA stabilization | 18/3246 | 56/18723 | 5.05e-03 | 2.45e-02 | 18 |
| GO:004348913 | Prostate | Tumor | RNA stabilization | 19/3246 | 65/18723 | 1.23e-02 | 4.99e-02 | 19 |
| GO:190331125 | Skin | AK | regulation of mRNA metabolic process | 81/1910 | 288/18723 | 7.27e-18 | 8.61e-15 | 81 |
| GO:000641728 | Skin | AK | regulation of translation | 102/1910 | 468/18723 | 6.79e-14 | 2.36e-11 | 102 |
| GO:003133027 | Skin | AK | negative regulation of cellular catabolic process | 61/1910 | 262/18723 | 4.95e-10 | 5.42e-08 | 61 |
| GO:000640225 | Skin | AK | mRNA catabolic process | 56/1910 | 232/18723 | 6.06e-10 | 6.41e-08 | 56 |
| Page: 1 2 3 4 5 6 7 8 9 10 11 12 13 14 15 16 17 18 19 20 21 22 23 |
| Pathway ID | Tissue | Disease Stage | Description | Gene Ratio | Bg Ratio | pvalue | p.adjust | qvalue | Count |
| Page: 1 |
Top |
Cell-cell communication analysis |
| Identification of potential cell-cell interactions between two cell types and their ligand-receptor pairs for different disease states |
| Ligand | Receptor | LRpair | Pathway | Tissue | Disease Stage |
| Page: 1 |
Top |
Single-cell gene regulatory network inference analysis |
| Find out the significant the regulons (TFs) and the target genes of each regulon across cell types for different disease states |
| TF | Cell Type | Tissue | Disease Stage | Target Gene | RSS | Regulon Activity |
| ∗The dot plots of a searched regulon are shown for all cell subpopulations in each disease state of each tissue based on the regulon specific score inferred using pySCENIC and by calculating the average expression. |
| Page: 1 |
Top |
Somatic mutation of malignant transformation related genes |
| Annotation of somatic variants for genes involved in malignant transformation |
| Hugo Symbol | Variant Class | Variant Classification | dbSNP RS | HGVSc | HGVSp | HGVSp Short | SWISSPROT | BIOTYPE | SIFT | PolyPhen | Tumor Sample Barcode | Tissue | Histology | Sex | Age | Stage | Therapy Types | Drugs | Outcome |
| LARP4 | SNV | Missense_Mutation | c.236N>G | p.Ser79Cys | p.S79C | Q71RC2 | protein_coding | deleterious(0.01) | probably_damaging(0.976) | TCGA-AC-A23H-01 | Breast | breast invasive carcinoma | Female | >=65 | I/II | Unknown | Unknown | PD | |
| LARP4 | SNV | Missense_Mutation | novel | c.1235N>T | p.Arg412Ile | p.R412I | Q71RC2 | protein_coding | tolerated(0.09) | possibly_damaging(0.533) | TCGA-AN-A046-01 | Breast | breast invasive carcinoma | Female | >=65 | I/II | Unknown | Unknown | SD |
| LARP4 | SNV | Missense_Mutation | novel | c.1484N>T | p.Gly495Val | p.G495V | Q71RC2 | protein_coding | deleterious(0) | probably_damaging(1) | TCGA-AN-A046-01 | Breast | breast invasive carcinoma | Female | >=65 | I/II | Unknown | Unknown | SD |
| LARP4 | SNV | Missense_Mutation | novel | c.1427N>T | p.Ser476Leu | p.S476L | Q71RC2 | protein_coding | tolerated(0.1) | benign(0.007) | TCGA-BH-A2L8-01 | Breast | breast invasive carcinoma | Female | <65 | I/II | Chemotherapy | cytoxan | CR |
| LARP4 | deletion | Frame_Shift_Del | novel | c.954_966delNNNNNNNNNNNNN | p.Pro319ThrfsTer32 | p.P319Tfs*32 | Q71RC2 | protein_coding | TCGA-PL-A8LZ-01 | Breast | breast invasive carcinoma | Female | <65 | III/IV | Chemotherapy | paclitaxel | SD | ||
| LARP4 | SNV | Missense_Mutation | novel | c.1652N>A | p.Ser551Asn | p.S551N | Q71RC2 | protein_coding | tolerated(0.11) | benign(0.101) | TCGA-2W-A8YY-01 | Cervix | cervical & endocervical cancer | Female | <65 | I/II | Chemotherapy | cisplatin | CR |
| LARP4 | SNV | Missense_Mutation | novel | c.149N>T | p.Ser50Leu | p.S50L | Q71RC2 | protein_coding | tolerated(0.22) | benign(0.006) | TCGA-C5-A8YR-01 | Cervix | cervical & endocervical cancer | Female | <65 | I/II | Unknown | Unknown | PD |
| LARP4 | SNV | Missense_Mutation | c.1463C>T | p.Ser488Leu | p.S488L | Q71RC2 | protein_coding | deleterious(0) | possibly_damaging(0.544) | TCGA-EK-A2H0-01 | Cervix | cervical & endocervical cancer | Female | <65 | I/II | Chemotherapy | cisplatin | CR | |
| LARP4 | SNV | Missense_Mutation | c.1918C>A | p.Leu640Ile | p.L640I | Q71RC2 | protein_coding | tolerated(0.15) | benign(0.091) | TCGA-FU-A3HZ-01 | Cervix | cervical & endocervical cancer | Female | <65 | I/II | Chemotherapy | cisplatin | CR | |
| LARP4 | SNV | Missense_Mutation | novel | c.1657N>T | p.Pro553Ser | p.P553S | Q71RC2 | protein_coding | tolerated(0.2) | benign(0.006) | TCGA-HM-A4S6-01 | Cervix | cervical & endocervical cancer | Female | <65 | III/IV | Chemotherapy | cisplatin | CR |
| Page: 1 2 3 4 5 6 7 |
Top |
Related drugs of malignant transformation related genes |
| Identification of chemicals and drugs interact with genes involved in malignant transfromation |
| (DGIdb 4.0) |
| Entrez ID | Symbol | Category | Interaction Types | Drug Claim Name | Drug Name | PMIDs |
| Page: 1 |

Copyright 2023-Present -The University of Texas Health Science Center at Houston |