
|
|||||
|
 | |
| |
| |
| |
| |
| |
|
Gene: ILK |
Gene summary for ILK |
| Gene information | Species | Human | Gene symbol | ILK | Gene ID | 3611 |
| Gene name | integrin linked kinase | |
| Gene Alias | HEL-S-28 | |
| Cytomap | 11p15.4 | |
| Gene Type | protein-coding | GO ID | GO:0000165 | UniProtAcc | Q13418 |
Top |
Malignant transformation analysis |
| Identification of the aberrant gene expression in precancerous and cancerous lesions by comparing the gene expression of stem-like cells in diseased tissues with normal stem cells |
| Entrez ID | Symbol | Replicates | Species | Organ | Tissue | Adj P-value | Log2FC | Malignancy |
| 3611 | ILK | AEH-subject1 | Human | Endometrium | AEH | 1.59e-04 | -2.30e-01 | -0.3059 |
| 3611 | ILK | AEH-subject2 | Human | Endometrium | AEH | 7.86e-03 | -1.64e-01 | -0.2525 |
| 3611 | ILK | AEH-subject3 | Human | Endometrium | AEH | 9.40e-03 | -1.91e-01 | -0.2576 |
| 3611 | ILK | AEH-subject4 | Human | Endometrium | AEH | 1.91e-02 | -2.08e-01 | -0.2657 |
| 3611 | ILK | AEH-subject5 | Human | Endometrium | AEH | 1.39e-05 | -2.51e-01 | -0.2953 |
| 3611 | ILK | EEC-subject1 | Human | Endometrium | EEC | 6.72e-08 | -2.41e-01 | -0.2682 |
| 3611 | ILK | EEC-subject2 | Human | Endometrium | EEC | 9.21e-04 | -1.99e-01 | -0.2607 |
| 3611 | ILK | EEC-subject3 | Human | Endometrium | EEC | 1.47e-17 | -3.49e-01 | -0.2525 |
| 3611 | ILK | EEC-subject4 | Human | Endometrium | EEC | 1.98e-05 | -3.05e-01 | -0.2571 |
| 3611 | ILK | EEC-subject5 | Human | Endometrium | EEC | 8.62e-06 | -3.03e-01 | -0.249 |
| 3611 | ILK | GSM5276934 | Human | Endometrium | EEC | 3.13e-04 | -2.77e-01 | -0.0913 |
| 3611 | ILK | GSM5276935 | Human | Endometrium | EEC | 4.62e-02 | -2.27e-01 | -0.123 |
| 3611 | ILK | GSM5276937 | Human | Endometrium | EEC | 7.46e-03 | -2.84e-01 | -0.0897 |
| 3611 | ILK | GSM6177620_NYU_UCEC1_lib1_lib1 | Human | Endometrium | EEC | 5.17e-21 | -1.63e-01 | -0.1869 |
| 3611 | ILK | GSM6177620_NYU_UCEC1_lib2_lib2 | Human | Endometrium | EEC | 2.43e-22 | -3.49e-01 | -0.1875 |
| 3611 | ILK | GSM6177620_NYU_UCEC1_lib3_lib3 | Human | Endometrium | EEC | 9.11e-24 | -3.54e-01 | -0.1883 |
| 3611 | ILK | GSM6177621_NYU_UCEC2_lib1_lib1 | Human | Endometrium | EEC | 5.13e-26 | -2.48e-01 | -0.1934 |
| 3611 | ILK | GSM6177622_NYU_UCEC3_lib1_lib1 | Human | Endometrium | EEC | 8.45e-35 | -2.45e-01 | -0.1917 |
| 3611 | ILK | GSM6177622_NYU_UCEC3_lib2_lib2 | Human | Endometrium | EEC | 2.89e-31 | -3.10e-01 | -0.1916 |
| 3611 | ILK | GSM6177623_NYU_UCEC3_Vis | Human | Endometrium | EEC | 1.18e-02 | -1.13e-01 | -0.1269 |
| Page: 1 2 3 4 5 6 7 8 |
| Tissue | Expression Dynamics | Abbreviation |
| Endometrium | 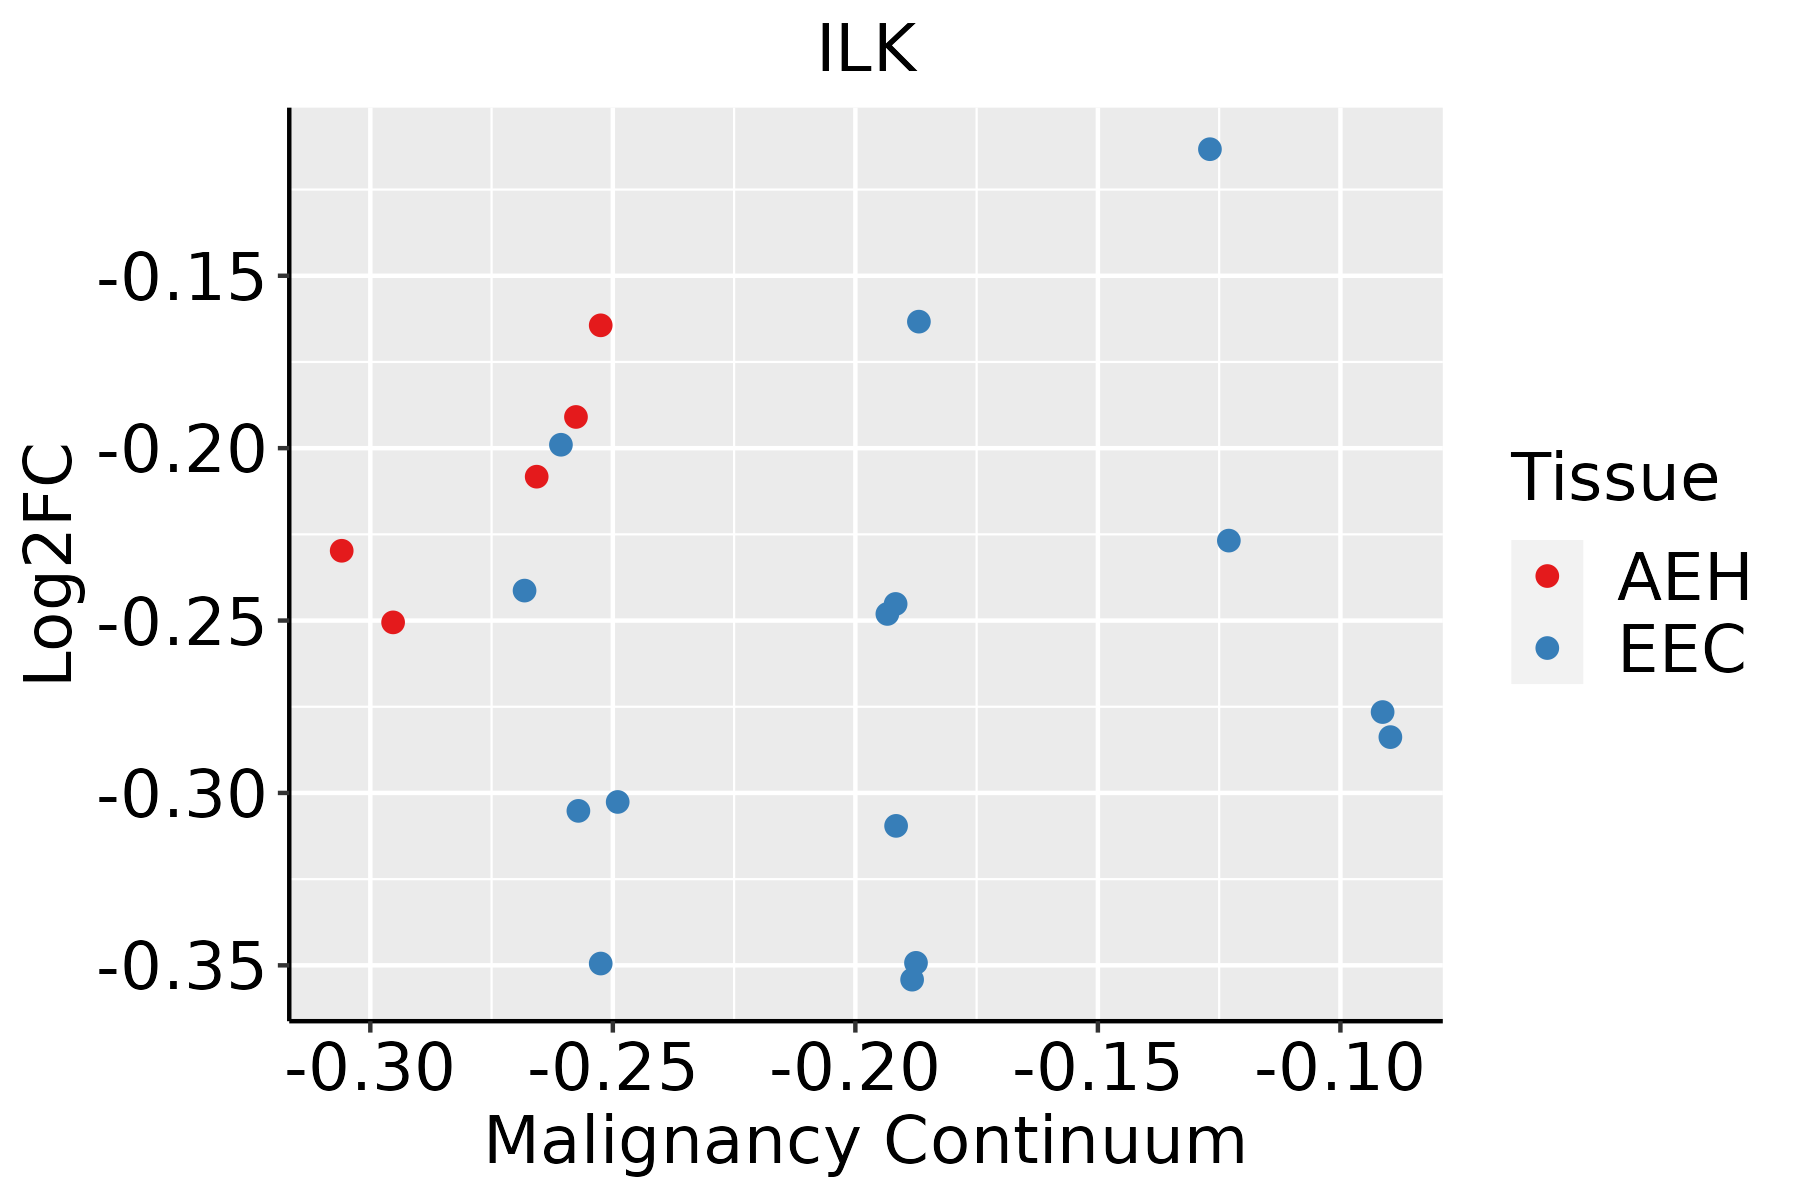 | AEH: Atypical endometrial hyperplasia |
| EEC: Endometrioid Cancer | ||
| Esophagus |  | ESCC: Esophageal squamous cell carcinoma |
| HGIN: High-grade intraepithelial neoplasias | ||
| LGIN: Low-grade intraepithelial neoplasias | ||
| Liver |  | HCC: Hepatocellular carcinoma |
| NAFLD: Non-alcoholic fatty liver disease | ||
| Oral Cavity |  | EOLP: Erosive Oral lichen planus |
| LP: leukoplakia | ||
| NEOLP: Non-erosive oral lichen planus | ||
| OSCC: Oral squamous cell carcinoma | ||
| Skin | 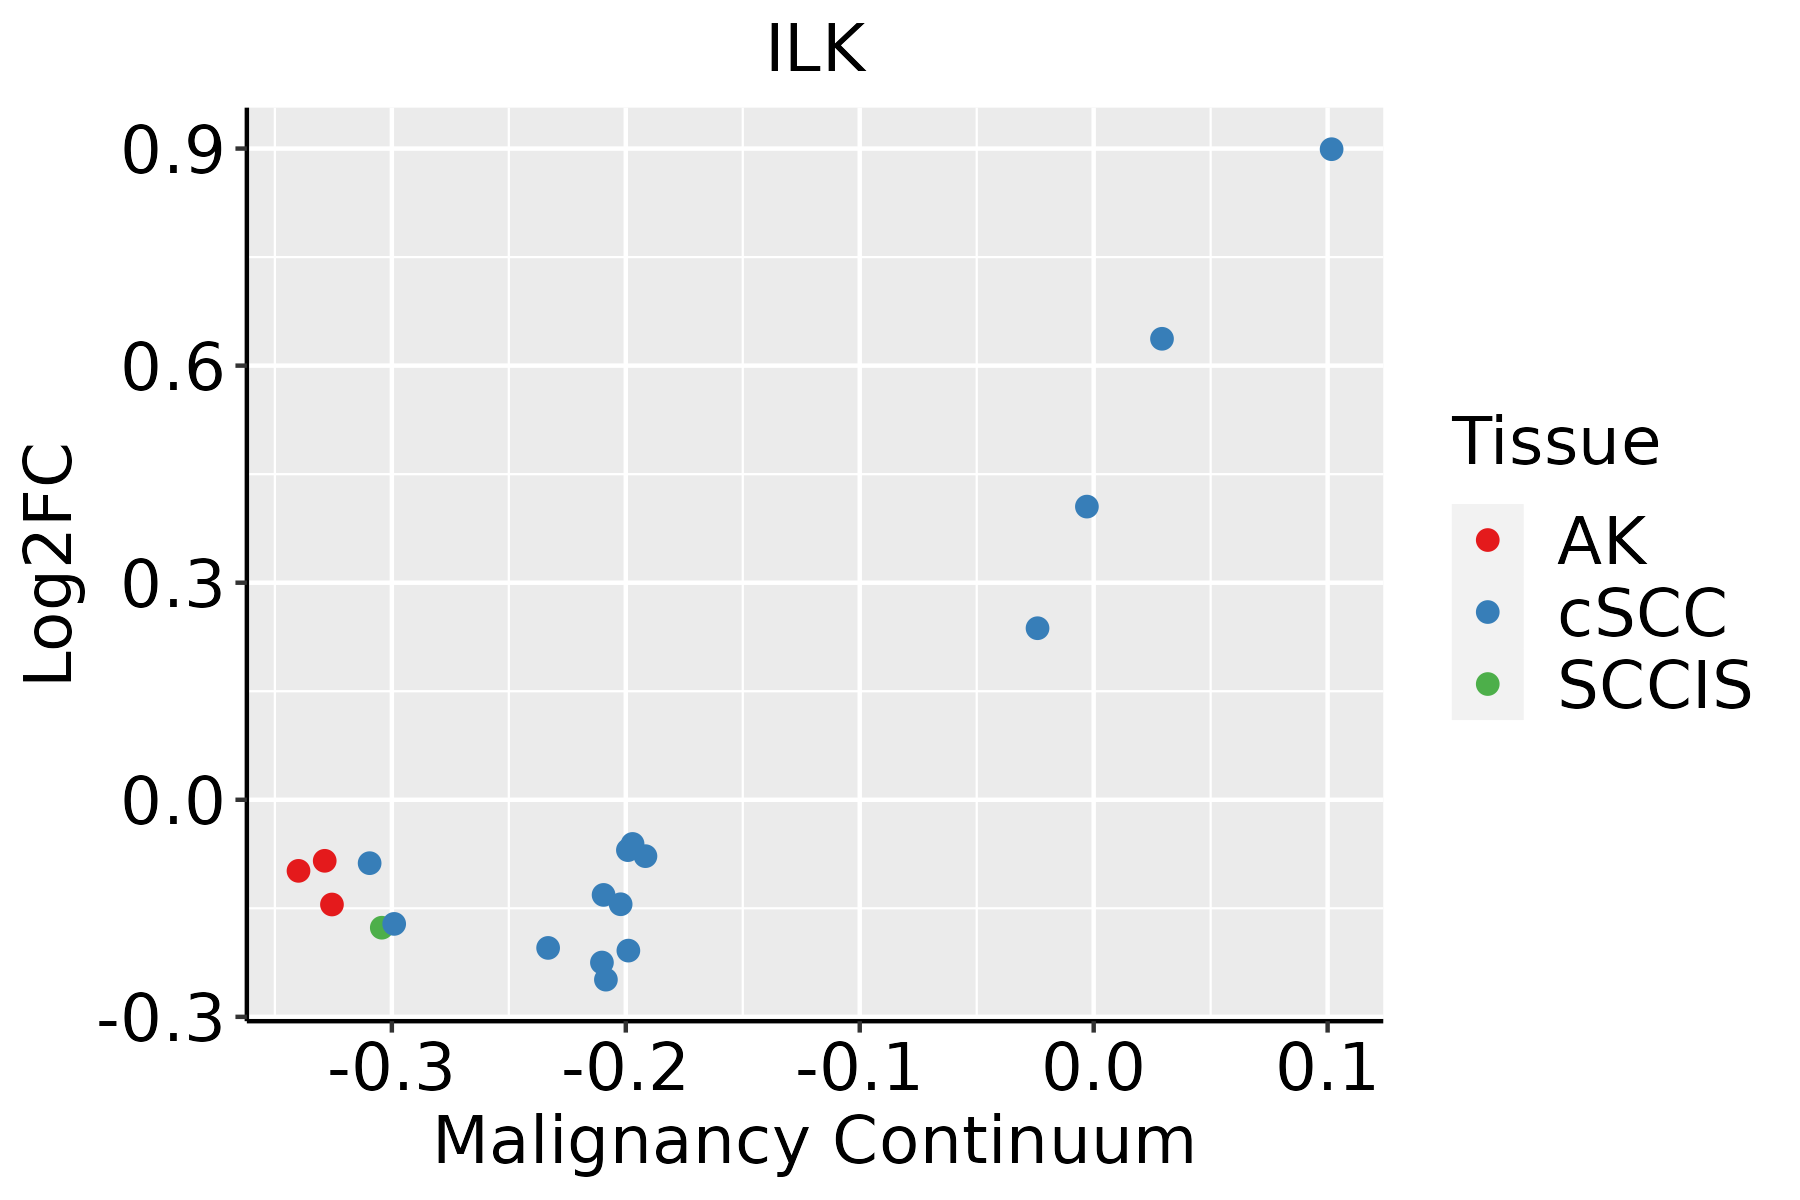 | AK: Actinic keratosis |
| cSCC: Cutaneous squamous cell carcinoma | ||
| SCCIS:squamous cell carcinoma in situ | ||
| Thyroid |  | ATC: Anaplastic thyroid cancer |
| HT: Hashimoto's thyroiditis | ||
| PTC: Papillary thyroid cancer |
| ∗log2FC in expression of this searched gene in stem-like cells from each diseased tissue sample relative to stem-like cells in normal samples in each tissue plotted against the malignancy continuum. Samples are colored based on if they are from different disease stage. |
Top |
Malignant transformation related pathway analysis |
| Find out the enriched GO biological processes and KEGG pathways involved in transition from healthy to precancer to cancer |
| Tissue | Disease Stage | Enriched GO biological Processes |
| Colorectum | AD |  |
| Colorectum | SER |  |
| Colorectum | MSS |  |
| Colorectum | MSI-H |  |
| Colorectum | FAP |  |
| ∗Top 15 enriched GO BP terms are showed in the bar plot of each disease state in each tissue. Each row represents a significant GO biological process which is colored according to the -log10(p.adjust). |
| Page: 1 2 3 4 5 6 7 8 9 |
| GO ID | Tissue | Disease Stage | Description | Gene Ratio | Bg Ratio | pvalue | p.adjust | Count |
| GO:00380615 | Esophagus | ESCC | NIK/NF-kappaB signaling | 81/8552 | 143/18723 | 5.33e-03 | 2.00e-02 | 81 |
| GO:00451978 | Esophagus | ESCC | establishment or maintenance of epithelial cell apical/basal polarity | 29/8552 | 44/18723 | 5.41e-03 | 2.02e-02 | 29 |
| GO:00016559 | Esophagus | ESCC | urogenital system development | 177/8552 | 338/18723 | 7.51e-03 | 2.69e-02 | 177 |
| GO:001635816 | Esophagus | ESCC | dendrite development | 130/8552 | 243/18723 | 8.33e-03 | 2.95e-02 | 130 |
| GO:004858810 | Esophagus | ESCC | developmental cell growth | 125/8552 | 234/18723 | 1.01e-02 | 3.46e-02 | 125 |
| GO:00017639 | Esophagus | ESCC | morphogenesis of a branching structure | 106/8552 | 196/18723 | 1.08e-02 | 3.66e-02 | 106 |
| GO:004592717 | Esophagus | ESCC | positive regulation of growth | 137/8552 | 259/18723 | 1.13e-02 | 3.80e-02 | 137 |
| GO:002260412 | Liver | Cirrhotic | regulation of cell morphogenesis | 127/4634 | 309/18723 | 1.45e-10 | 7.44e-09 | 127 |
| GO:007099712 | Liver | Cirrhotic | neuron death | 141/4634 | 361/18723 | 9.56e-10 | 4.38e-08 | 141 |
| GO:003297012 | Liver | Cirrhotic | regulation of actin filament-based process | 152/4634 | 397/18723 | 1.12e-09 | 5.00e-08 | 152 |
| GO:003295612 | Liver | Cirrhotic | regulation of actin cytoskeleton organization | 136/4634 | 358/18723 | 1.47e-08 | 5.49e-07 | 136 |
| GO:004206012 | Liver | Cirrhotic | wound healing | 155/4634 | 422/18723 | 2.12e-08 | 7.56e-07 | 155 |
| GO:19012147 | Liver | Cirrhotic | regulation of neuron death | 122/4634 | 319/18723 | 5.17e-08 | 1.62e-06 | 122 |
| GO:001081012 | Liver | Cirrhotic | regulation of cell-substrate adhesion | 88/4634 | 221/18723 | 4.89e-07 | 1.10e-05 | 88 |
| GO:004593612 | Liver | Cirrhotic | negative regulation of phosphate metabolic process | 154/4634 | 441/18723 | 8.78e-07 | 1.83e-05 | 154 |
| GO:001056312 | Liver | Cirrhotic | negative regulation of phosphorus metabolic process | 154/4634 | 442/18723 | 1.02e-06 | 2.11e-05 | 154 |
| GO:190002412 | Liver | Cirrhotic | regulation of substrate adhesion-dependent cell spreading | 31/4634 | 57/18723 | 1.55e-06 | 3.02e-05 | 31 |
| GO:003253512 | Liver | Cirrhotic | regulation of cellular component size | 135/4634 | 383/18723 | 2.32e-06 | 4.26e-05 | 135 |
| GO:004232612 | Liver | Cirrhotic | negative regulation of phosphorylation | 135/4634 | 385/18723 | 3.17e-06 | 5.58e-05 | 135 |
| GO:003158912 | Liver | Cirrhotic | cell-substrate adhesion | 128/4634 | 363/18723 | 4.10e-06 | 6.90e-05 | 128 |
| Page: 1 2 3 4 5 6 7 8 9 10 11 12 13 14 15 16 17 18 19 20 21 22 23 24 25 26 27 28 29 30 31 32 33 34 35 36 37 38 39 40 41 42 43 44 45 46 47 48 49 50 51 52 53 54 55 56 57 58 59 60 61 62 |
| Pathway ID | Tissue | Disease Stage | Description | Gene Ratio | Bg Ratio | pvalue | p.adjust | qvalue | Count |
| hsa0513126 | Endometrium | AEH | Shigellosis | 78/1197 | 247/8465 | 9.23e-13 | 2.00e-11 | 1.46e-11 | 78 |
| hsa0510026 | Endometrium | AEH | Bacterial invasion of epithelial cells | 32/1197 | 77/8465 | 3.28e-09 | 5.91e-08 | 4.33e-08 | 32 |
| hsa0451015 | Endometrium | AEH | Focal adhesion | 58/1197 | 203/8465 | 4.99e-08 | 7.37e-07 | 5.39e-07 | 58 |
| hsa0521314 | Endometrium | AEH | Endometrial cancer | 18/1197 | 58/8465 | 7.42e-04 | 5.03e-03 | 3.68e-03 | 18 |
| hsa0436010 | Endometrium | AEH | Axon guidance | 39/1197 | 182/8465 | 4.47e-03 | 2.46e-02 | 1.80e-02 | 39 |
| hsa05131111 | Endometrium | AEH | Shigellosis | 78/1197 | 247/8465 | 9.23e-13 | 2.00e-11 | 1.46e-11 | 78 |
| hsa05100111 | Endometrium | AEH | Bacterial invasion of epithelial cells | 32/1197 | 77/8465 | 3.28e-09 | 5.91e-08 | 4.33e-08 | 32 |
| hsa0451016 | Endometrium | AEH | Focal adhesion | 58/1197 | 203/8465 | 4.99e-08 | 7.37e-07 | 5.39e-07 | 58 |
| hsa0521315 | Endometrium | AEH | Endometrial cancer | 18/1197 | 58/8465 | 7.42e-04 | 5.03e-03 | 3.68e-03 | 18 |
| hsa0436013 | Endometrium | AEH | Axon guidance | 39/1197 | 182/8465 | 4.47e-03 | 2.46e-02 | 1.80e-02 | 39 |
| hsa0513127 | Endometrium | EEC | Shigellosis | 79/1237 | 247/8465 | 1.80e-12 | 3.95e-11 | 2.95e-11 | 79 |
| hsa0510027 | Endometrium | EEC | Bacterial invasion of epithelial cells | 30/1237 | 77/8465 | 1.26e-07 | 1.88e-06 | 1.40e-06 | 30 |
| hsa0451024 | Endometrium | EEC | Focal adhesion | 58/1237 | 203/8465 | 1.61e-07 | 2.30e-06 | 1.71e-06 | 58 |
| hsa0521323 | Endometrium | EEC | Endometrial cancer | 17/1237 | 58/8465 | 2.97e-03 | 1.71e-02 | 1.28e-02 | 17 |
| hsa0436022 | Endometrium | EEC | Axon guidance | 39/1237 | 182/8465 | 7.78e-03 | 3.66e-02 | 2.73e-02 | 39 |
| hsa0513136 | Endometrium | EEC | Shigellosis | 79/1237 | 247/8465 | 1.80e-12 | 3.95e-11 | 2.95e-11 | 79 |
| hsa0510036 | Endometrium | EEC | Bacterial invasion of epithelial cells | 30/1237 | 77/8465 | 1.26e-07 | 1.88e-06 | 1.40e-06 | 30 |
| hsa0451034 | Endometrium | EEC | Focal adhesion | 58/1237 | 203/8465 | 1.61e-07 | 2.30e-06 | 1.71e-06 | 58 |
| hsa0521333 | Endometrium | EEC | Endometrial cancer | 17/1237 | 58/8465 | 2.97e-03 | 1.71e-02 | 1.28e-02 | 17 |
| hsa0436032 | Endometrium | EEC | Axon guidance | 39/1237 | 182/8465 | 7.78e-03 | 3.66e-02 | 2.73e-02 | 39 |
| Page: 1 2 3 4 5 |
Top |
Cell-cell communication analysis |
| Identification of potential cell-cell interactions between two cell types and their ligand-receptor pairs for different disease states |
| Ligand | Receptor | LRpair | Pathway | Tissue | Disease Stage |
| Page: 1 |
Top |
Single-cell gene regulatory network inference analysis |
| Find out the significant the regulons (TFs) and the target genes of each regulon across cell types for different disease states |
| TF | Cell Type | Tissue | Disease Stage | Target Gene | RSS | Regulon Activity |
| ∗The dot plots of a searched regulon are shown for all cell subpopulations in each disease state of each tissue based on the regulon specific score inferred using pySCENIC and by calculating the average expression. |
| Page: 1 |
Top |
Somatic mutation of malignant transformation related genes |
| Annotation of somatic variants for genes involved in malignant transformation |
| Hugo Symbol | Variant Class | Variant Classification | dbSNP RS | HGVSc | HGVSp | HGVSp Short | SWISSPROT | BIOTYPE | SIFT | PolyPhen | Tumor Sample Barcode | Tissue | Histology | Sex | Age | Stage | Therapy Types | Drugs | Outcome |
| ILK | SNV | Missense_Mutation | c.903N>A | p.Met301Ile | p.M301I | Q13418 | protein_coding | tolerated(1) | benign(0) | TCGA-A2-A0YL-01 | Breast | breast invasive carcinoma | Female | <65 | III/IV | Chemotherapy | cytoxan | SD | |
| ILK | SNV | Missense_Mutation | c.1096G>A | p.Glu366Lys | p.E366K | Q13418 | protein_coding | tolerated(0.14) | benign(0.066) | TCGA-AC-A23H-01 | Breast | breast invasive carcinoma | Female | >=65 | I/II | Unknown | Unknown | PD | |
| ILK | SNV | Missense_Mutation | novel | c.205N>C | p.Thr69Pro | p.T69P | Q13418 | protein_coding | deleterious(0.04) | probably_damaging(0.996) | TCGA-AR-A1AP-01 | Breast | breast invasive carcinoma | Female | >=65 | I/II | Hormone Therapy | anastrozole | SD |
| ILK | SNV | Missense_Mutation | novel | c.205N>C | p.Thr69Pro | p.T69P | Q13418 | protein_coding | deleterious(0.04) | probably_damaging(0.996) | TCGA-AR-A1AY-01 | Breast | breast invasive carcinoma | Female | >=65 | I/II | Unspecific | Doxorubicin | SD |
| ILK | SNV | Missense_Mutation | novel | c.205N>C | p.Thr69Pro | p.T69P | Q13418 | protein_coding | deleterious(0.04) | probably_damaging(0.996) | TCGA-BH-A0BR-01 | Breast | breast invasive carcinoma | Female | <65 | I/II | Unknown | Unknown | SD |
| ILK | SNV | Missense_Mutation | rs752302392 | c.62N>G | p.Asp21Gly | p.D21G | Q13418 | protein_coding | deleterious(0.01) | probably_damaging(0.958) | TCGA-BH-A0HO-01 | Breast | breast invasive carcinoma | Female | <65 | I/II | Chemotherapy | cyclophosphamide | SD |
| ILK | SNV | Missense_Mutation | c.539N>C | p.Gly180Ala | p.G180A | Q13418 | protein_coding | tolerated(1) | benign(0.003) | TCGA-BH-A1FU-01 | Breast | breast invasive carcinoma | Female | <65 | I/II | Unknown | Unknown | PD | |
| ILK | SNV | Missense_Mutation | novel | c.205N>C | p.Thr69Pro | p.T69P | Q13418 | protein_coding | deleterious(0.04) | probably_damaging(0.996) | TCGA-EW-A1J2-01 | Breast | breast invasive carcinoma | Female | <65 | I/II | Chemotherapy | taxotere | SD |
| ILK | SNV | Missense_Mutation | novel | c.606T>G | p.Asn202Lys | p.N202K | Q13418 | protein_coding | tolerated(0.11) | benign(0.212) | TCGA-LD-A74U-01 | Breast | breast invasive carcinoma | Female | >=65 | III/IV | Chemotherapy | taxotere | SD |
| ILK | SNV | Missense_Mutation | rs752932911 | c.239N>A | p.Arg80His | p.R80H | Q13418 | protein_coding | tolerated(0.49) | benign(0.017) | TCGA-2W-A8YY-01 | Cervix | cervical & endocervical cancer | Female | <65 | I/II | Chemotherapy | cisplatin | CR |
| Page: 1 2 3 4 5 |
Top |
Related drugs of malignant transformation related genes |
| Identification of chemicals and drugs interact with genes involved in malignant transfromation |
| (DGIdb 4.0) |
| Entrez ID | Symbol | Category | Interaction Types | Drug Claim Name | Drug Name | PMIDs |
| 3611 | ILK | SERINE THREONINE KINASE, DRUGGABLE GENOME, KINASE, ENZYME | US8754233, (4-Benzothiazol-2-yl-1H-pyrazol-3-yl)-[2-(1H-imidazol-4-yl)-ethyl]-amine | |||
| 3611 | ILK | SERINE THREONINE KINASE, DRUGGABLE GENOME, KINASE, ENZYME | US8754233, 4-(5-Fluoro-6-methoxy-benzothiazol-2-yl)-5-(2-fluoro-phenyl)-2H-pyrazol-3-ylamine | |||
| 3611 | ILK | SERINE THREONINE KINASE, DRUGGABLE GENOME, KINASE, ENZYME | inhibitor | 249565796 | ||
| 3611 | ILK | SERINE THREONINE KINASE, DRUGGABLE GENOME, KINASE, ENZYME | US8754233, 2-(3-Amino-1H-pyrazol-4-yl)-5-fluoro-benzothiazole-6-sulfonic acid amide |
| Page: 1 |

Copyright 2023-Present -The University of Texas Health Science Center at Houston |