
|
|||||
|
 | |
| |
| |
| |
| |
| |
|
Gene: GABARAPL2 |
Gene summary for GABARAPL2 |
| Gene information | Species | Human | Gene symbol | GABARAPL2 | Gene ID | 11345 |
| Gene name | GABA type A receptor associated protein like 2 | |
| Gene Alias | ATG8 | |
| Cytomap | 16q23.1 | |
| Gene Type | protein-coding | GO ID | GO:0000045 | UniProtAcc | P60520 |
Top |
Malignant transformation analysis |
| Identification of the aberrant gene expression in precancerous and cancerous lesions by comparing the gene expression of stem-like cells in diseased tissues with normal stem cells |
| Entrez ID | Symbol | Replicates | Species | Organ | Tissue | Adj P-value | Log2FC | Malignancy |
| 11345 | GABARAPL2 | GSM4909280 | Human | Breast | Precancer | 9.92e-03 | -4.42e-01 | 0.0305 |
| 11345 | GABARAPL2 | GSM4909282 | Human | Breast | IDC | 2.32e-05 | 2.17e-01 | -0.0288 |
| 11345 | GABARAPL2 | GSM4909286 | Human | Breast | IDC | 2.90e-03 | -2.96e-01 | 0.1081 |
| 11345 | GABARAPL2 | GSM4909287 | Human | Breast | IDC | 1.27e-06 | -3.31e-01 | 0.2057 |
| 11345 | GABARAPL2 | GSM4909288 | Human | Breast | IDC | 8.64e-05 | -5.35e-01 | 0.0988 |
| 11345 | GABARAPL2 | GSM4909290 | Human | Breast | IDC | 7.37e-04 | -3.62e-01 | 0.2096 |
| 11345 | GABARAPL2 | GSM4909293 | Human | Breast | IDC | 1.72e-05 | -3.51e-01 | 0.1581 |
| 11345 | GABARAPL2 | GSM4909294 | Human | Breast | IDC | 3.64e-08 | -2.49e-01 | 0.2022 |
| 11345 | GABARAPL2 | GSM4909296 | Human | Breast | IDC | 7.59e-19 | -4.97e-01 | 0.1524 |
| 11345 | GABARAPL2 | GSM4909297 | Human | Breast | IDC | 2.26e-26 | -3.60e-01 | 0.1517 |
| 11345 | GABARAPL2 | GSM4909301 | Human | Breast | IDC | 2.76e-05 | 5.60e-02 | 0.1577 |
| 11345 | GABARAPL2 | GSM4909302 | Human | Breast | IDC | 4.98e-03 | -2.43e-01 | 0.1545 |
| 11345 | GABARAPL2 | GSM4909309 | Human | Breast | IDC | 1.91e-04 | -1.27e-01 | 0.0483 |
| 11345 | GABARAPL2 | GSM4909311 | Human | Breast | IDC | 3.10e-41 | -4.28e-01 | 0.1534 |
| 11345 | GABARAPL2 | GSM4909312 | Human | Breast | IDC | 1.31e-14 | -1.57e-01 | 0.1552 |
| 11345 | GABARAPL2 | GSM4909313 | Human | Breast | IDC | 2.48e-06 | -2.95e-01 | 0.0391 |
| 11345 | GABARAPL2 | GSM4909316 | Human | Breast | IDC | 5.14e-06 | 1.82e-01 | 0.21 |
| 11345 | GABARAPL2 | GSM4909318 | Human | Breast | IDC | 7.00e-04 | -3.51e-01 | 0.2031 |
| 11345 | GABARAPL2 | GSM4909319 | Human | Breast | IDC | 2.10e-63 | -3.56e-01 | 0.1563 |
| 11345 | GABARAPL2 | GSM4909320 | Human | Breast | IDC | 5.43e-11 | -2.42e-01 | 0.1575 |
| Page: 1 2 3 4 5 6 7 8 9 10 11 12 |
| Tissue | Expression Dynamics | Abbreviation |
| Breast | 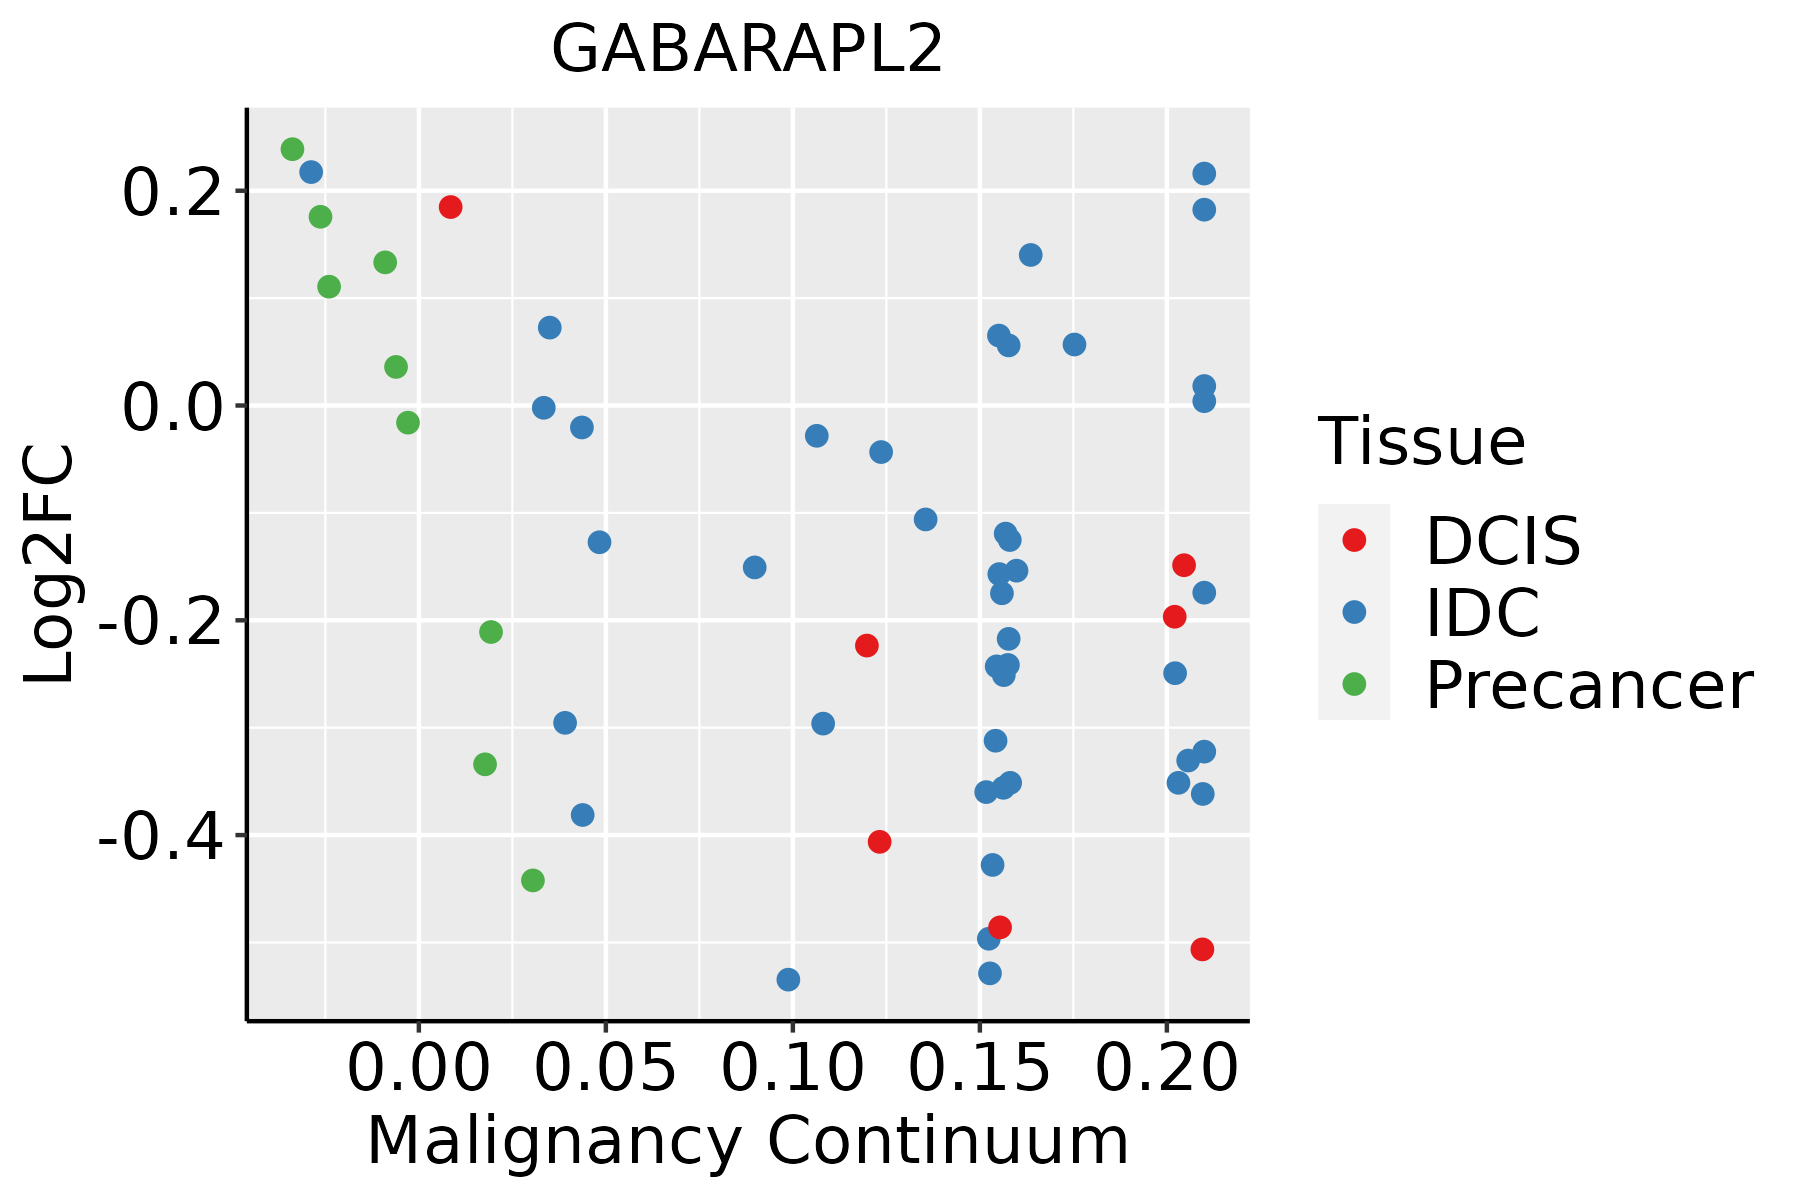 | IDC: Invasive ductal carcinoma |
| DCIS: Ductal carcinoma in situ | ||
| Precancer(BRCA1-mut): Precancerous lesion from BRCA1 mutation carriers | ||
| Cervix | 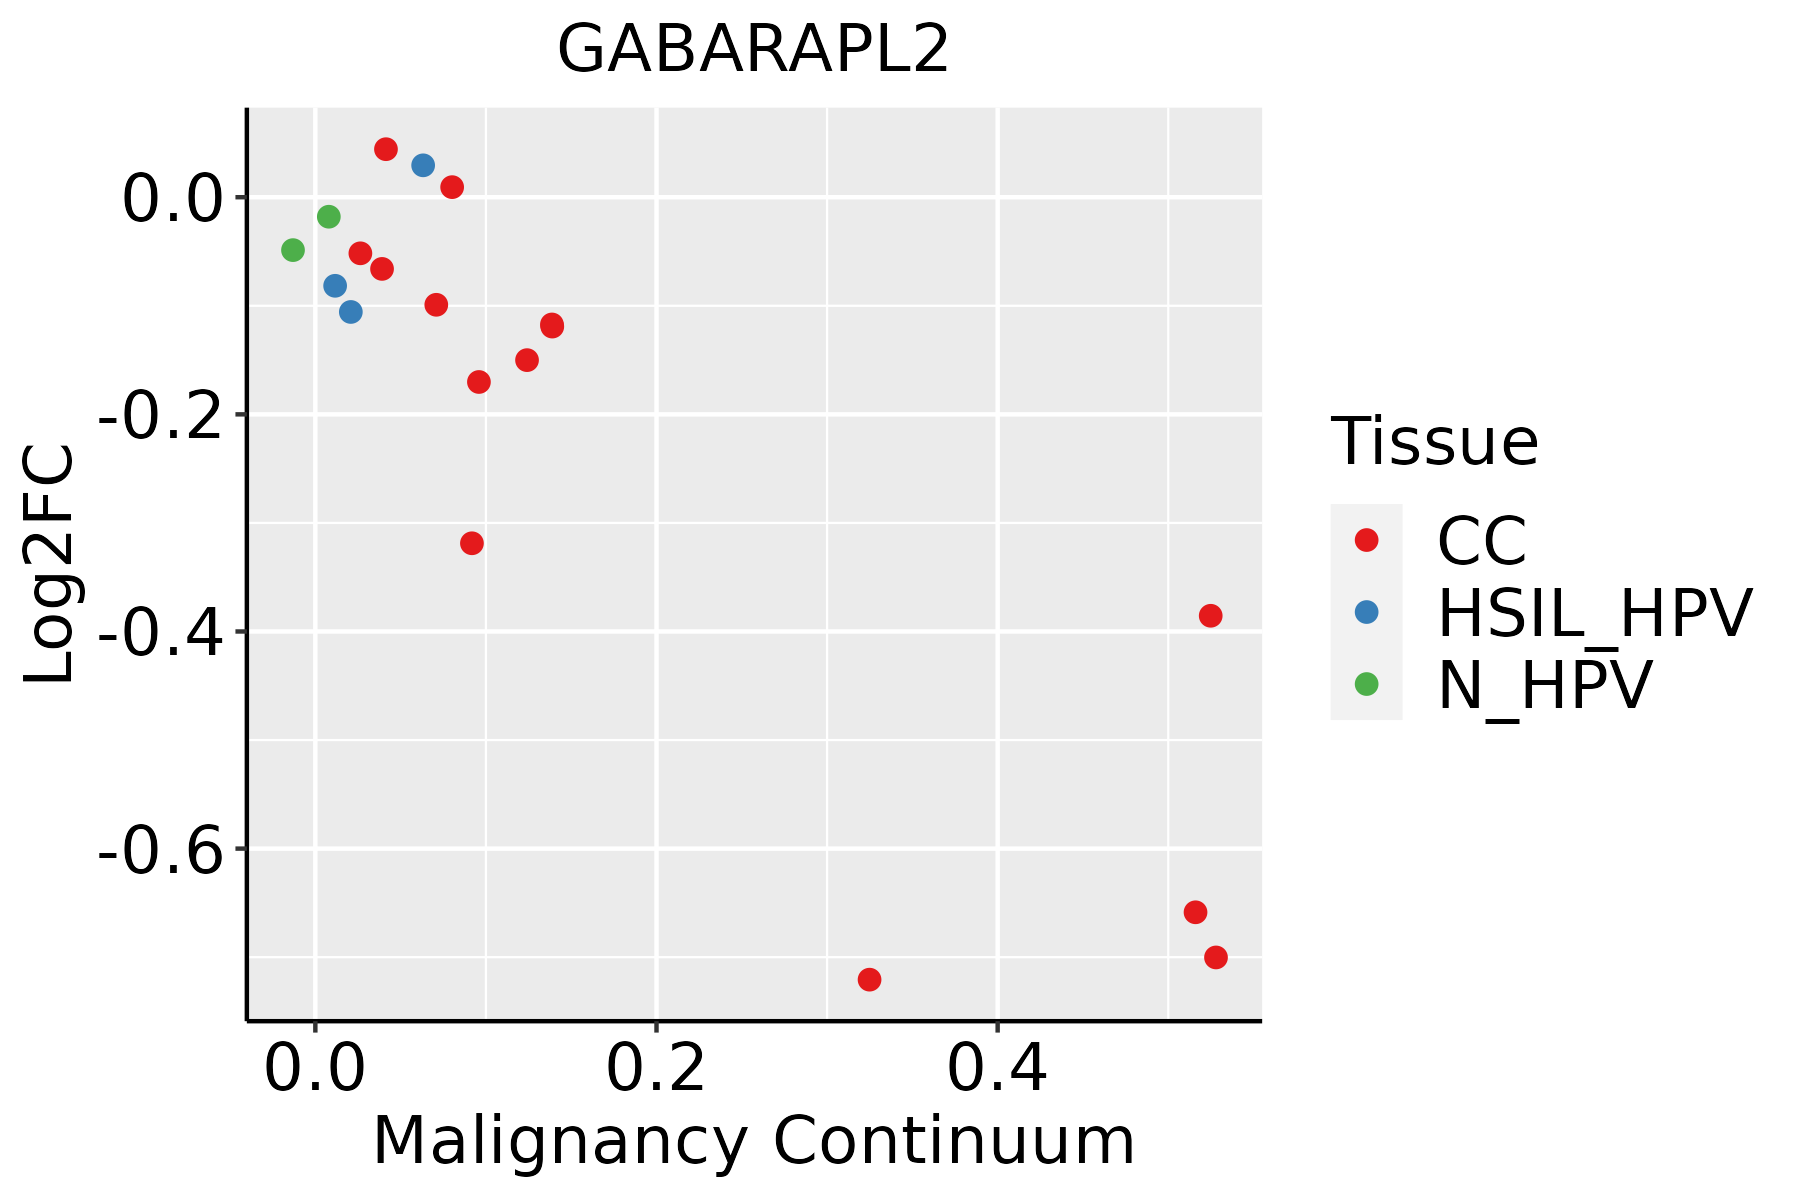 | CC: Cervix cancer |
| HSIL_HPV: HPV-infected high-grade squamous intraepithelial lesions | ||
| N_HPV: HPV-infected normal cervix | ||
| Colorectum (GSE201348) |  | FAP: Familial adenomatous polyposis |
| CRC: Colorectal cancer | ||
| Colorectum (HTA11) | 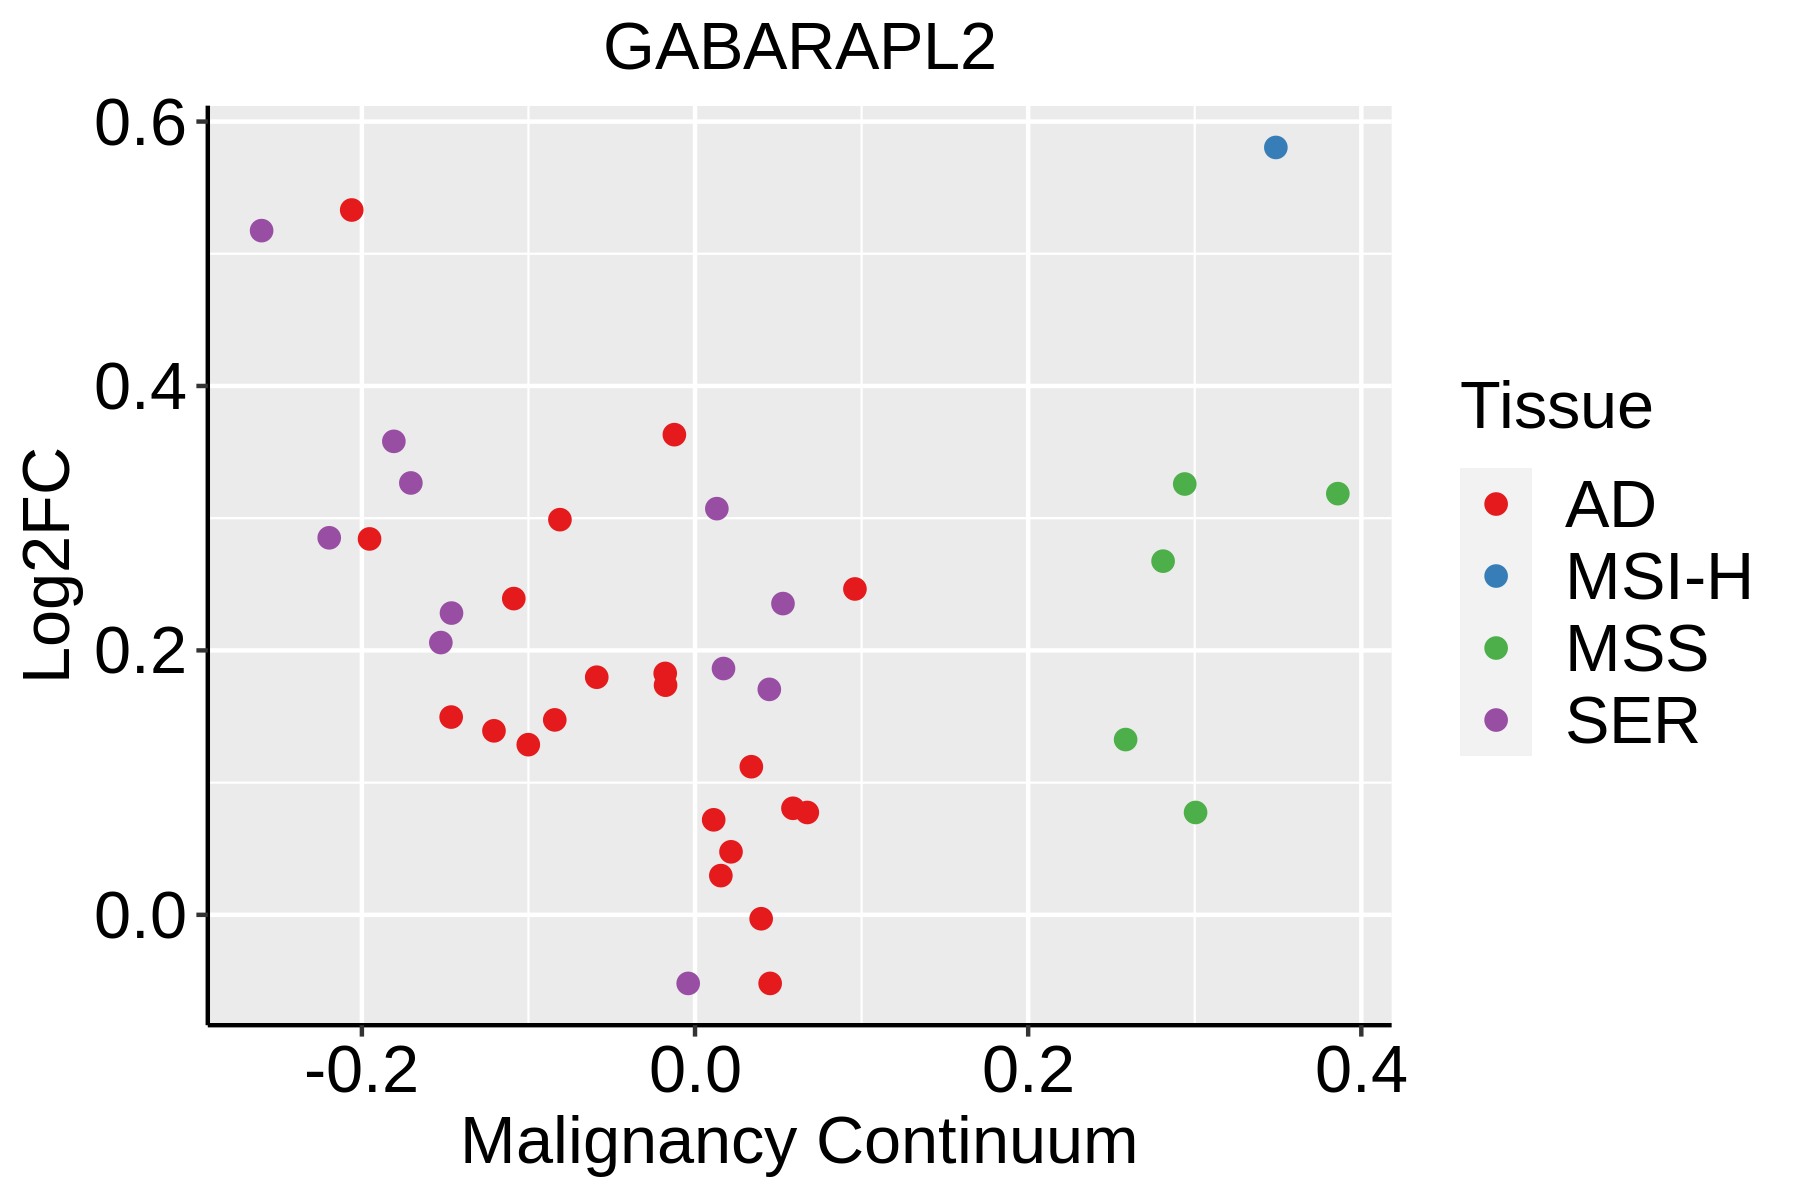 | AD: Adenomas |
| SER: Sessile serrated lesions | ||
| MSI-H: Microsatellite-high colorectal cancer | ||
| MSS: Microsatellite stable colorectal cancer | ||
| Endometrium | 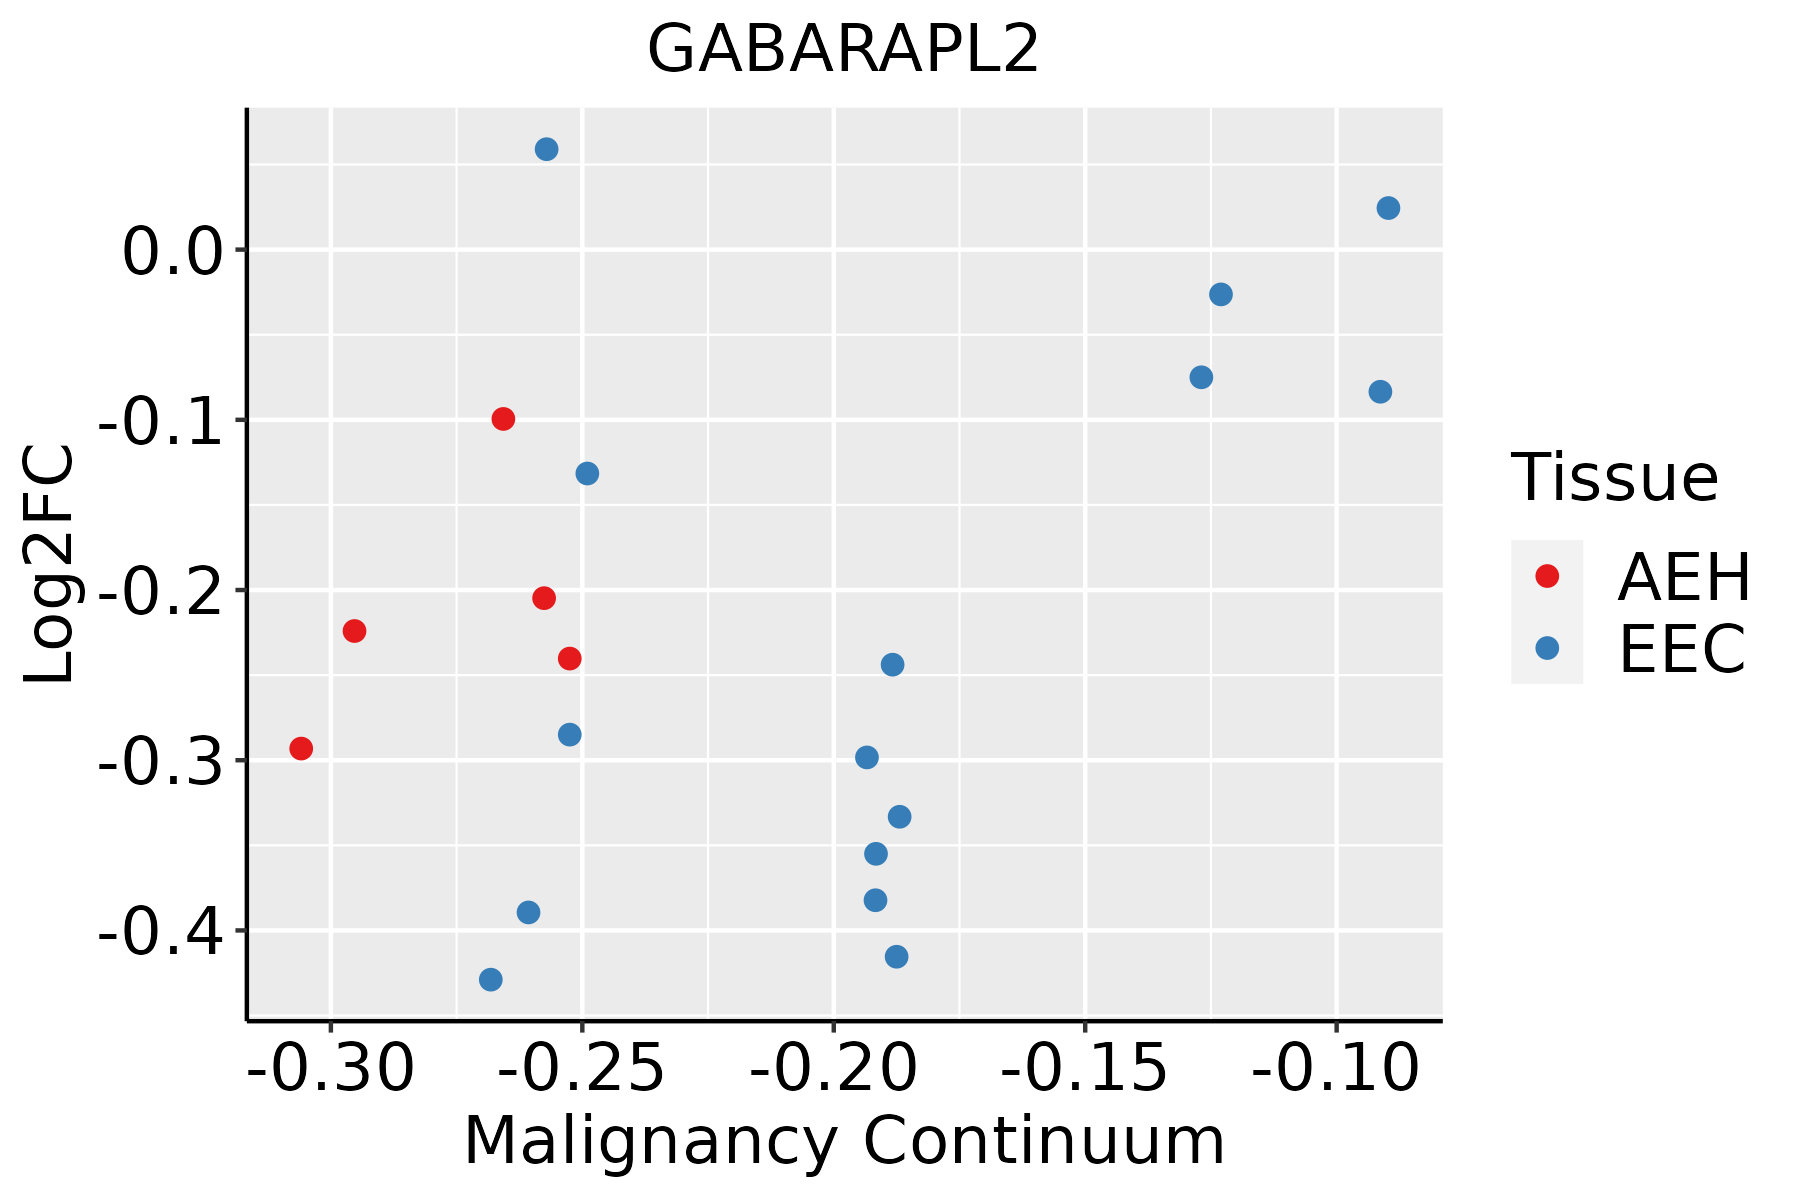 | AEH: Atypical endometrial hyperplasia |
| EEC: Endometrioid Cancer | ||
| Esophagus | 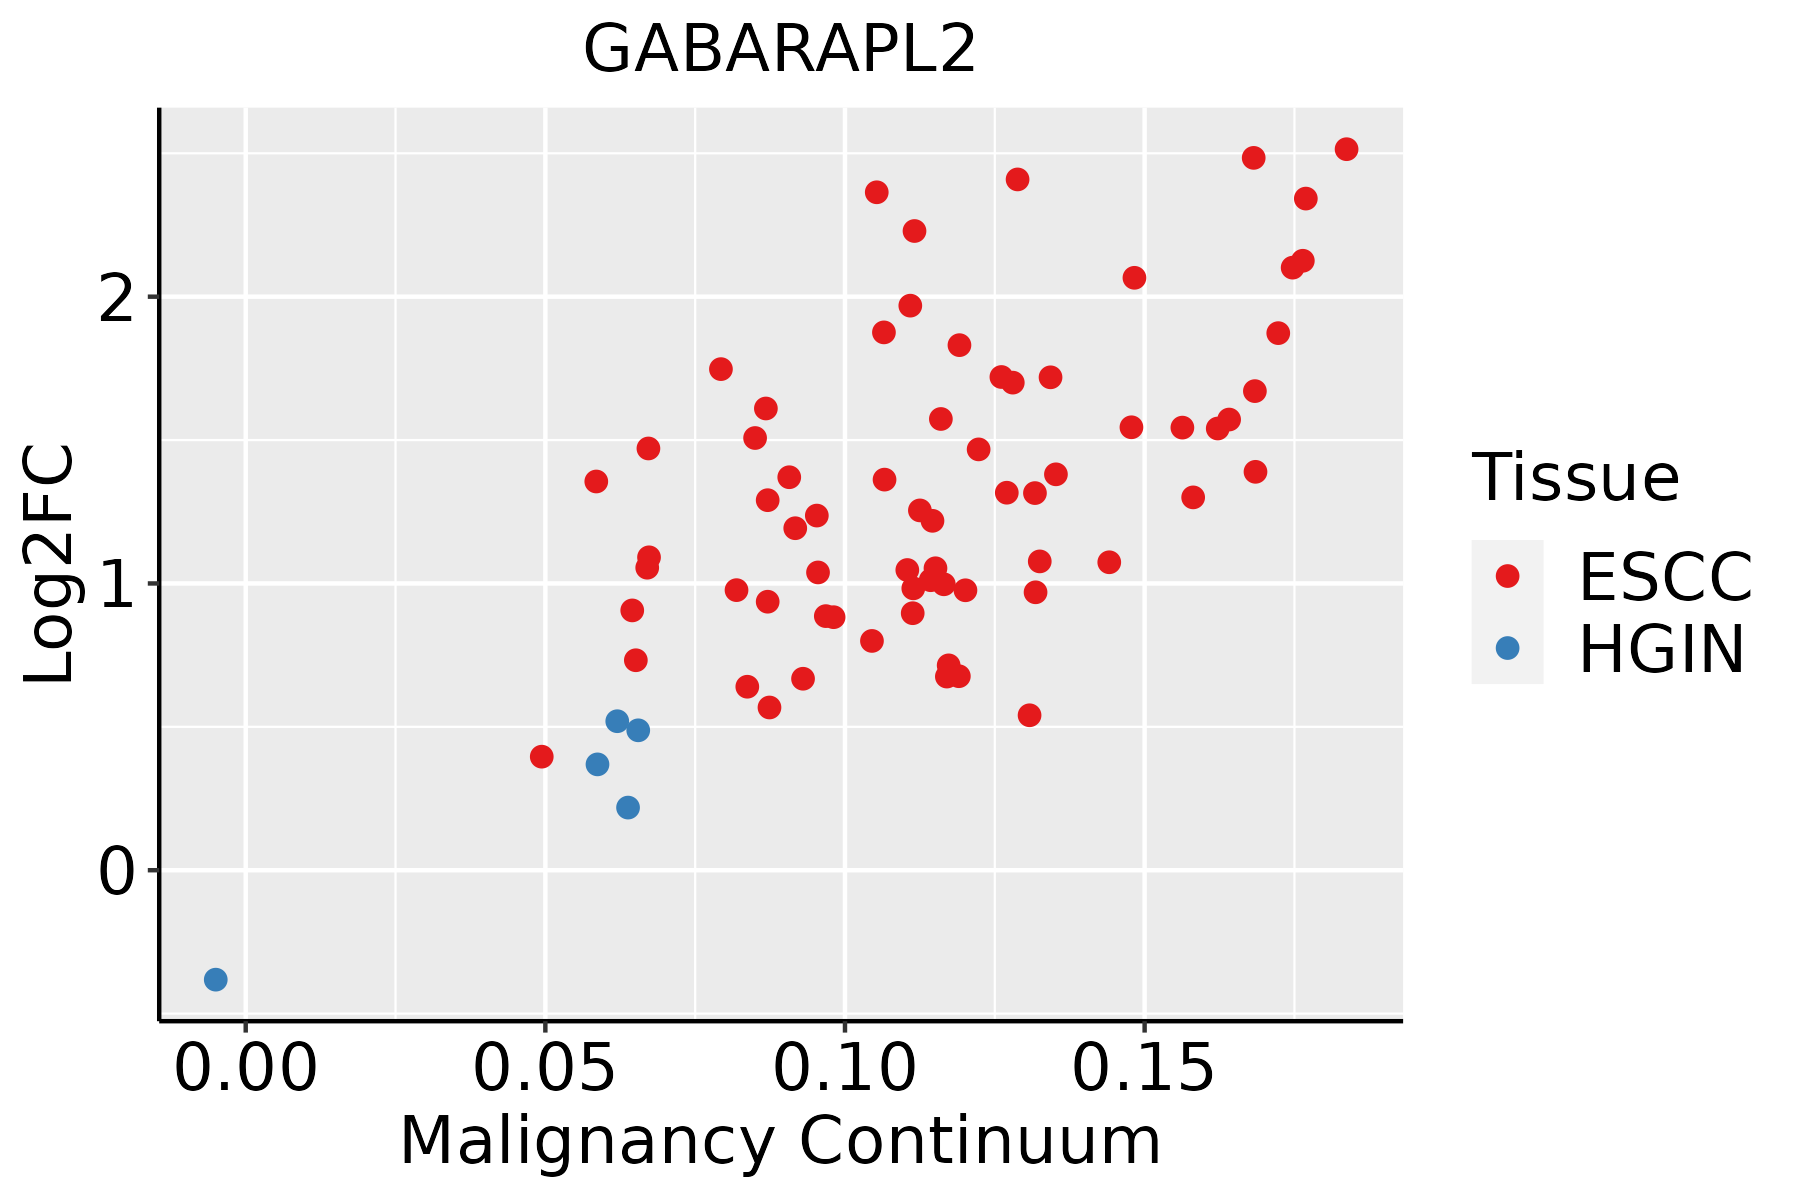 | ESCC: Esophageal squamous cell carcinoma |
| HGIN: High-grade intraepithelial neoplasias | ||
| LGIN: Low-grade intraepithelial neoplasias | ||
| Liver |  | HCC: Hepatocellular carcinoma |
| NAFLD: Non-alcoholic fatty liver disease | ||
| Oral Cavity | 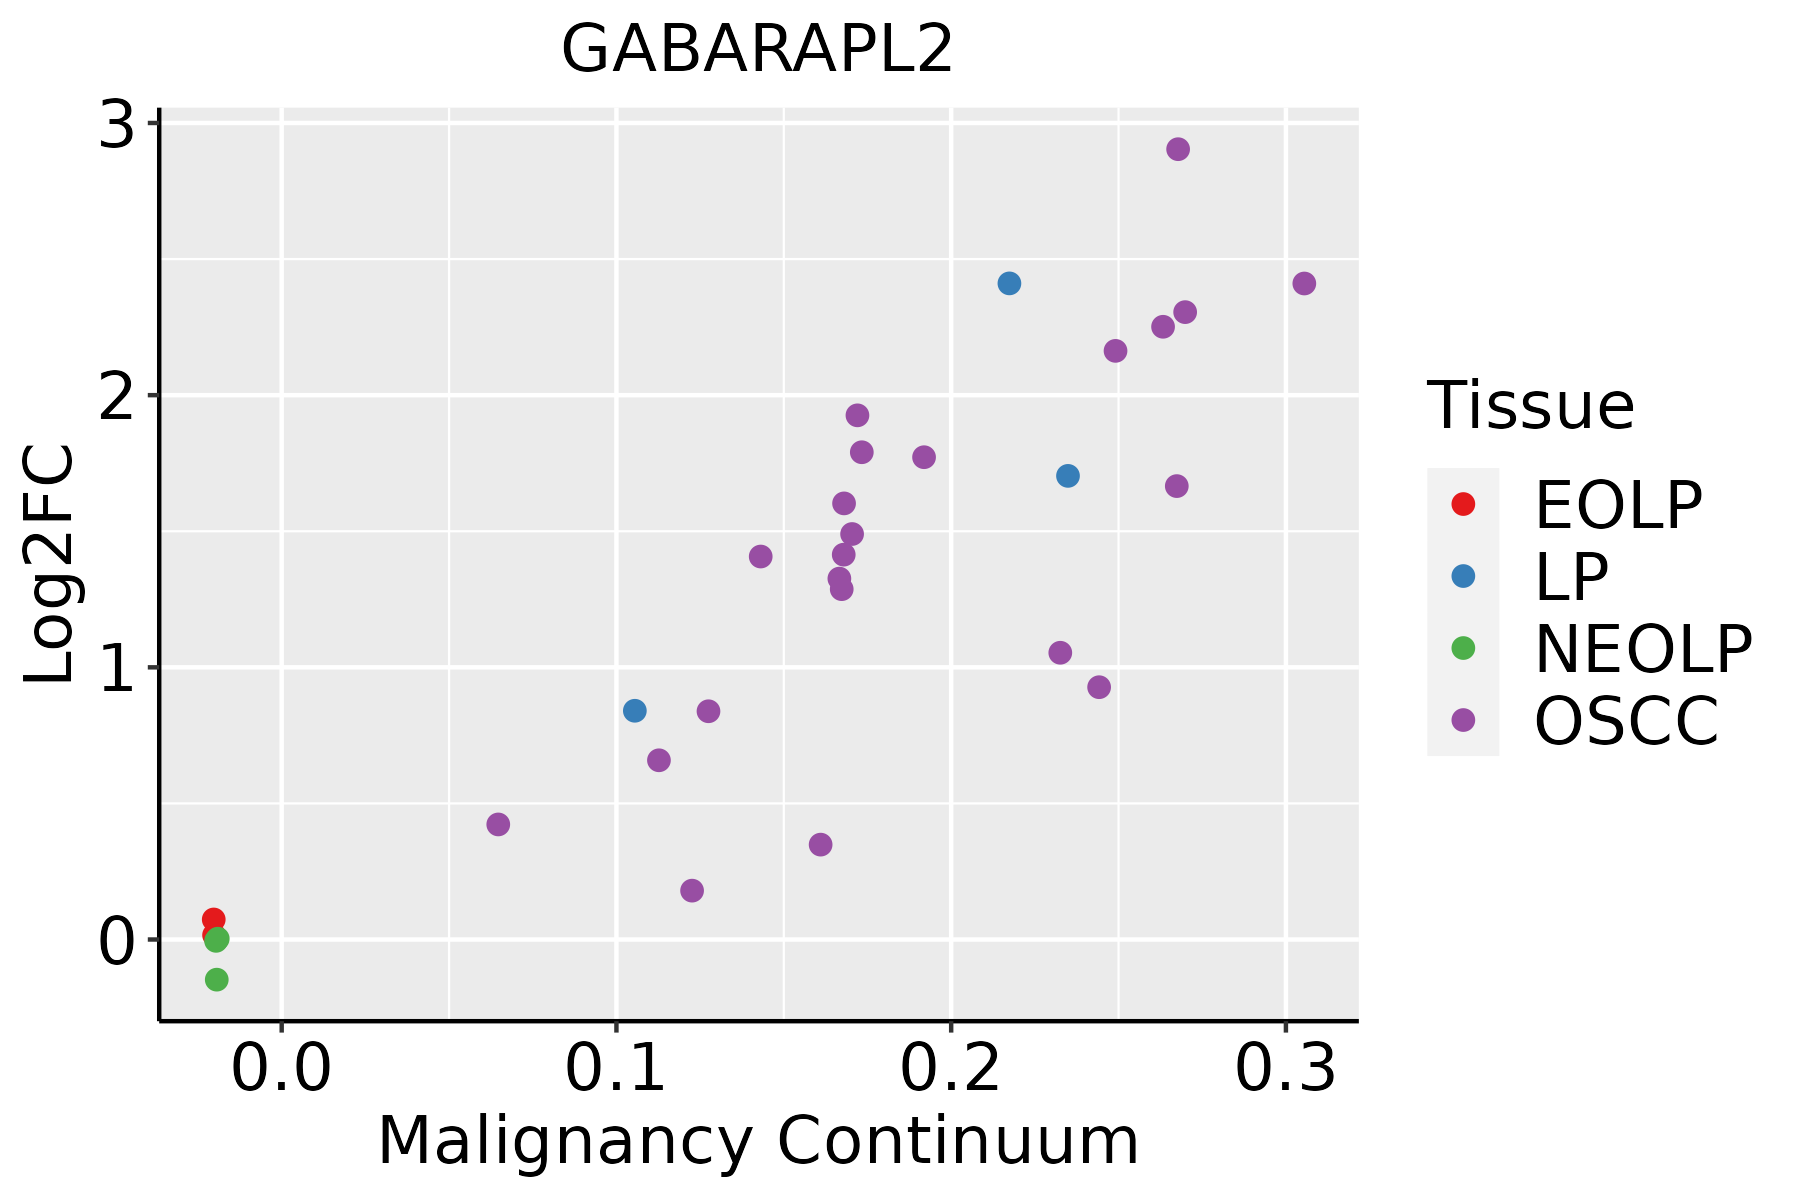 | EOLP: Erosive Oral lichen planus |
| LP: leukoplakia | ||
| NEOLP: Non-erosive oral lichen planus | ||
| OSCC: Oral squamous cell carcinoma | ||
| Prostate | 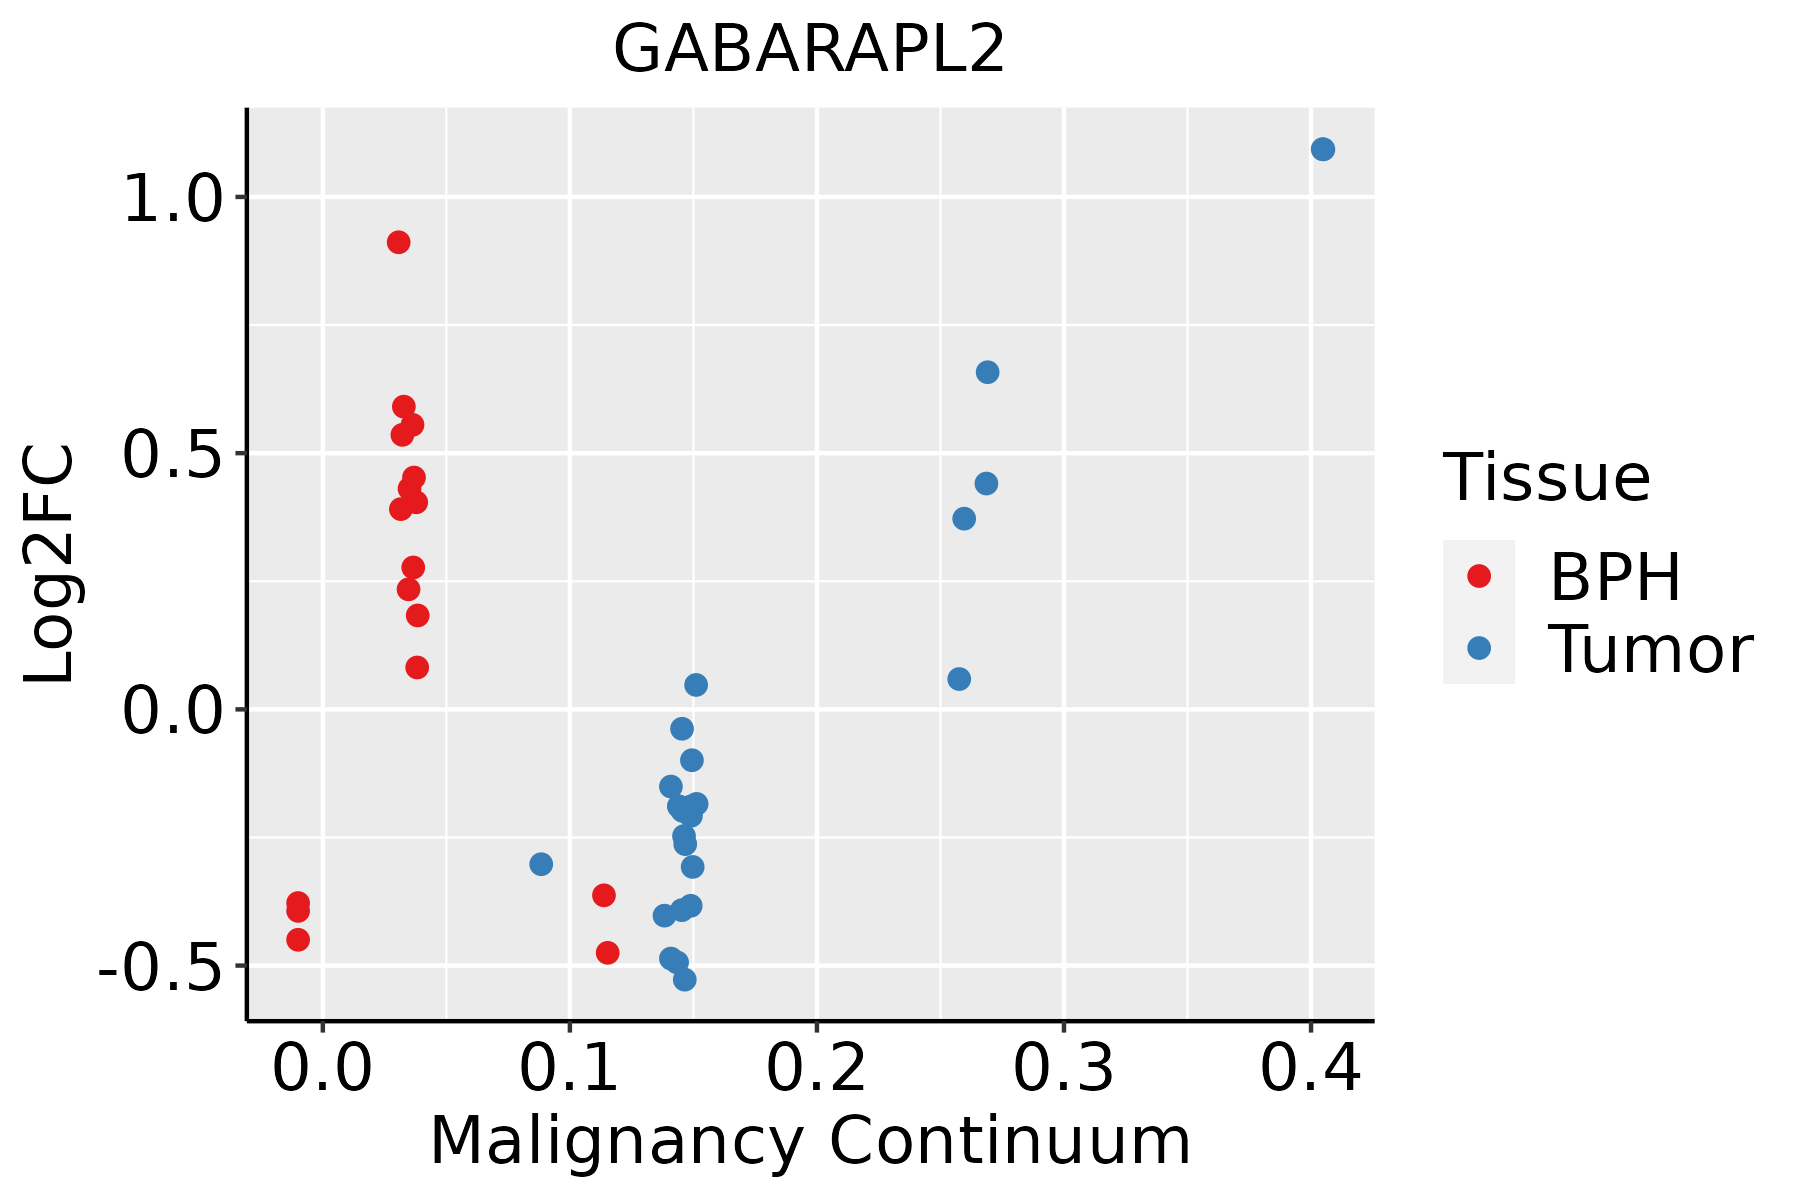 | BPH: Benign Prostatic Hyperplasia |
| Skin | 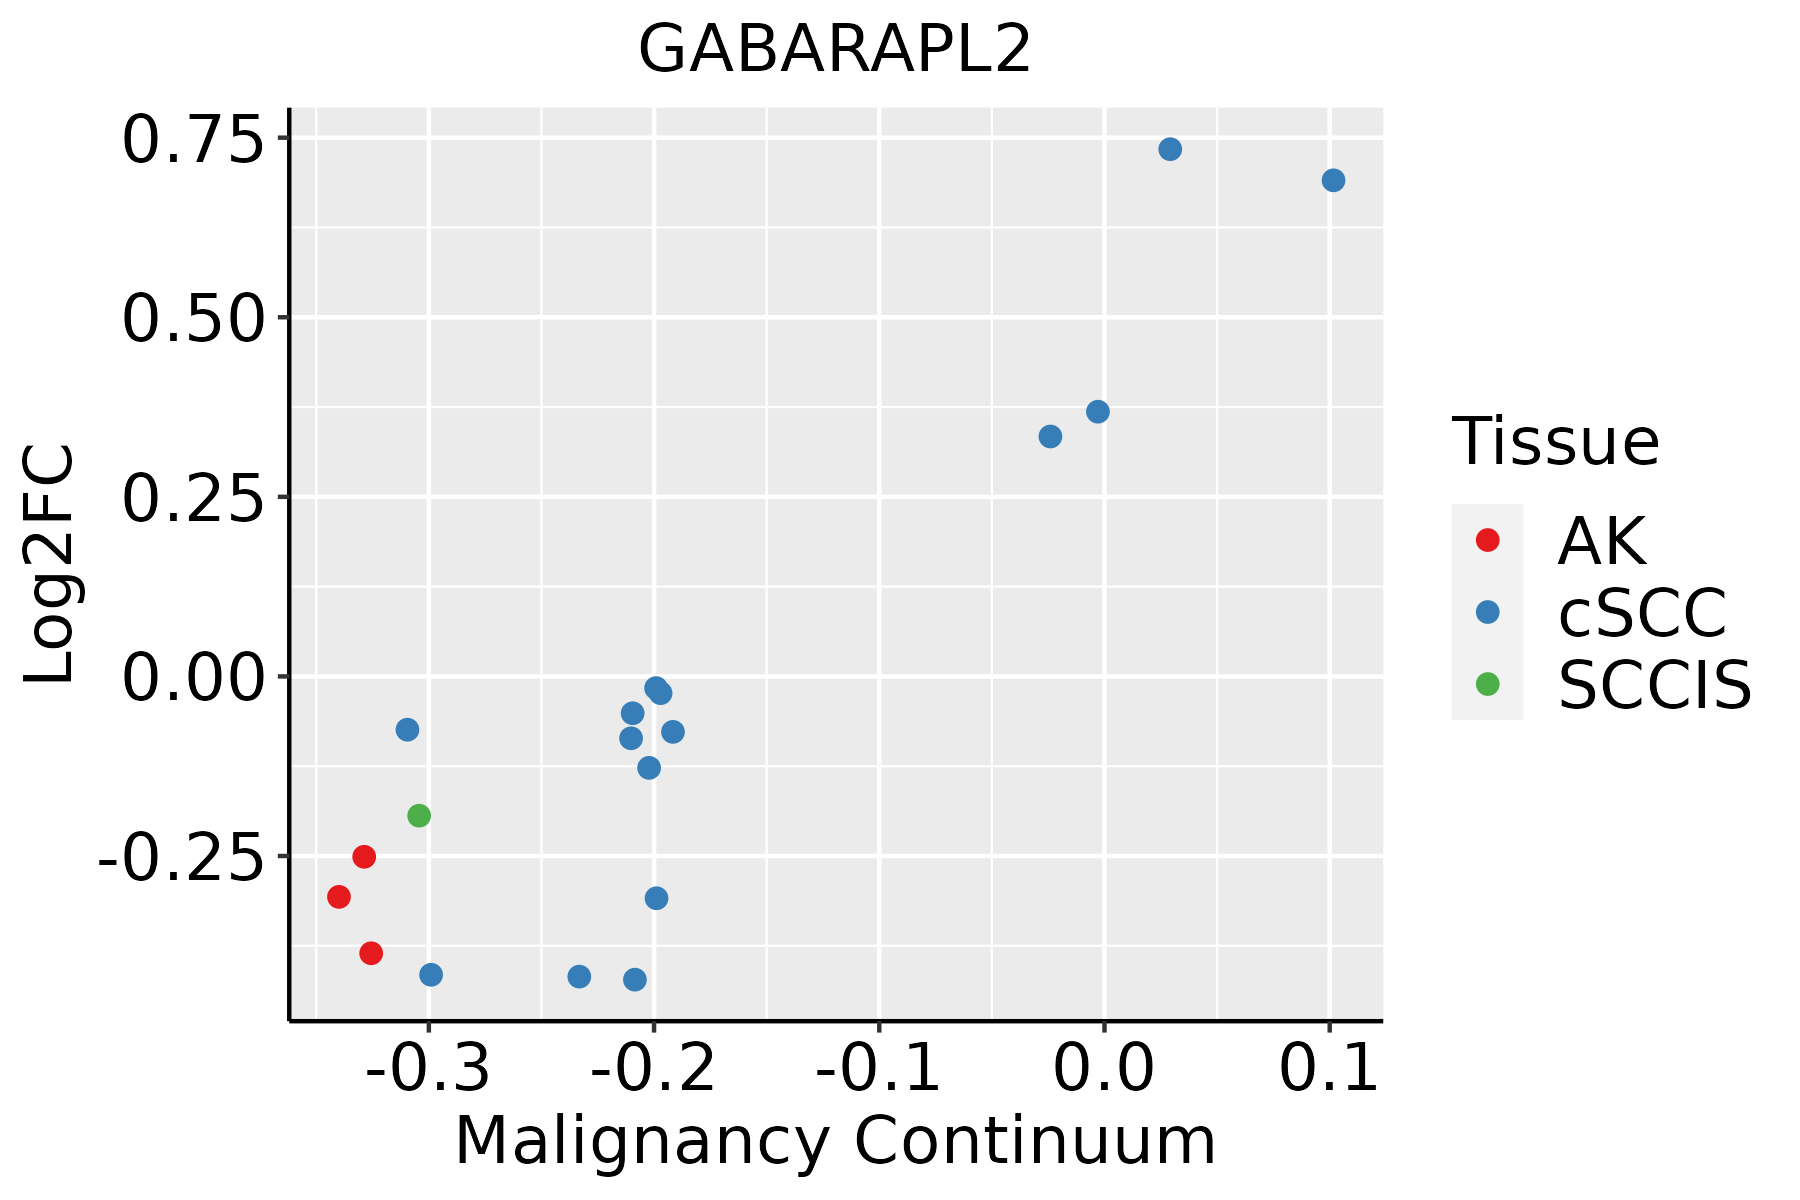 | AK: Actinic keratosis |
| cSCC: Cutaneous squamous cell carcinoma | ||
| SCCIS:squamous cell carcinoma in situ | ||
| Thyroid | 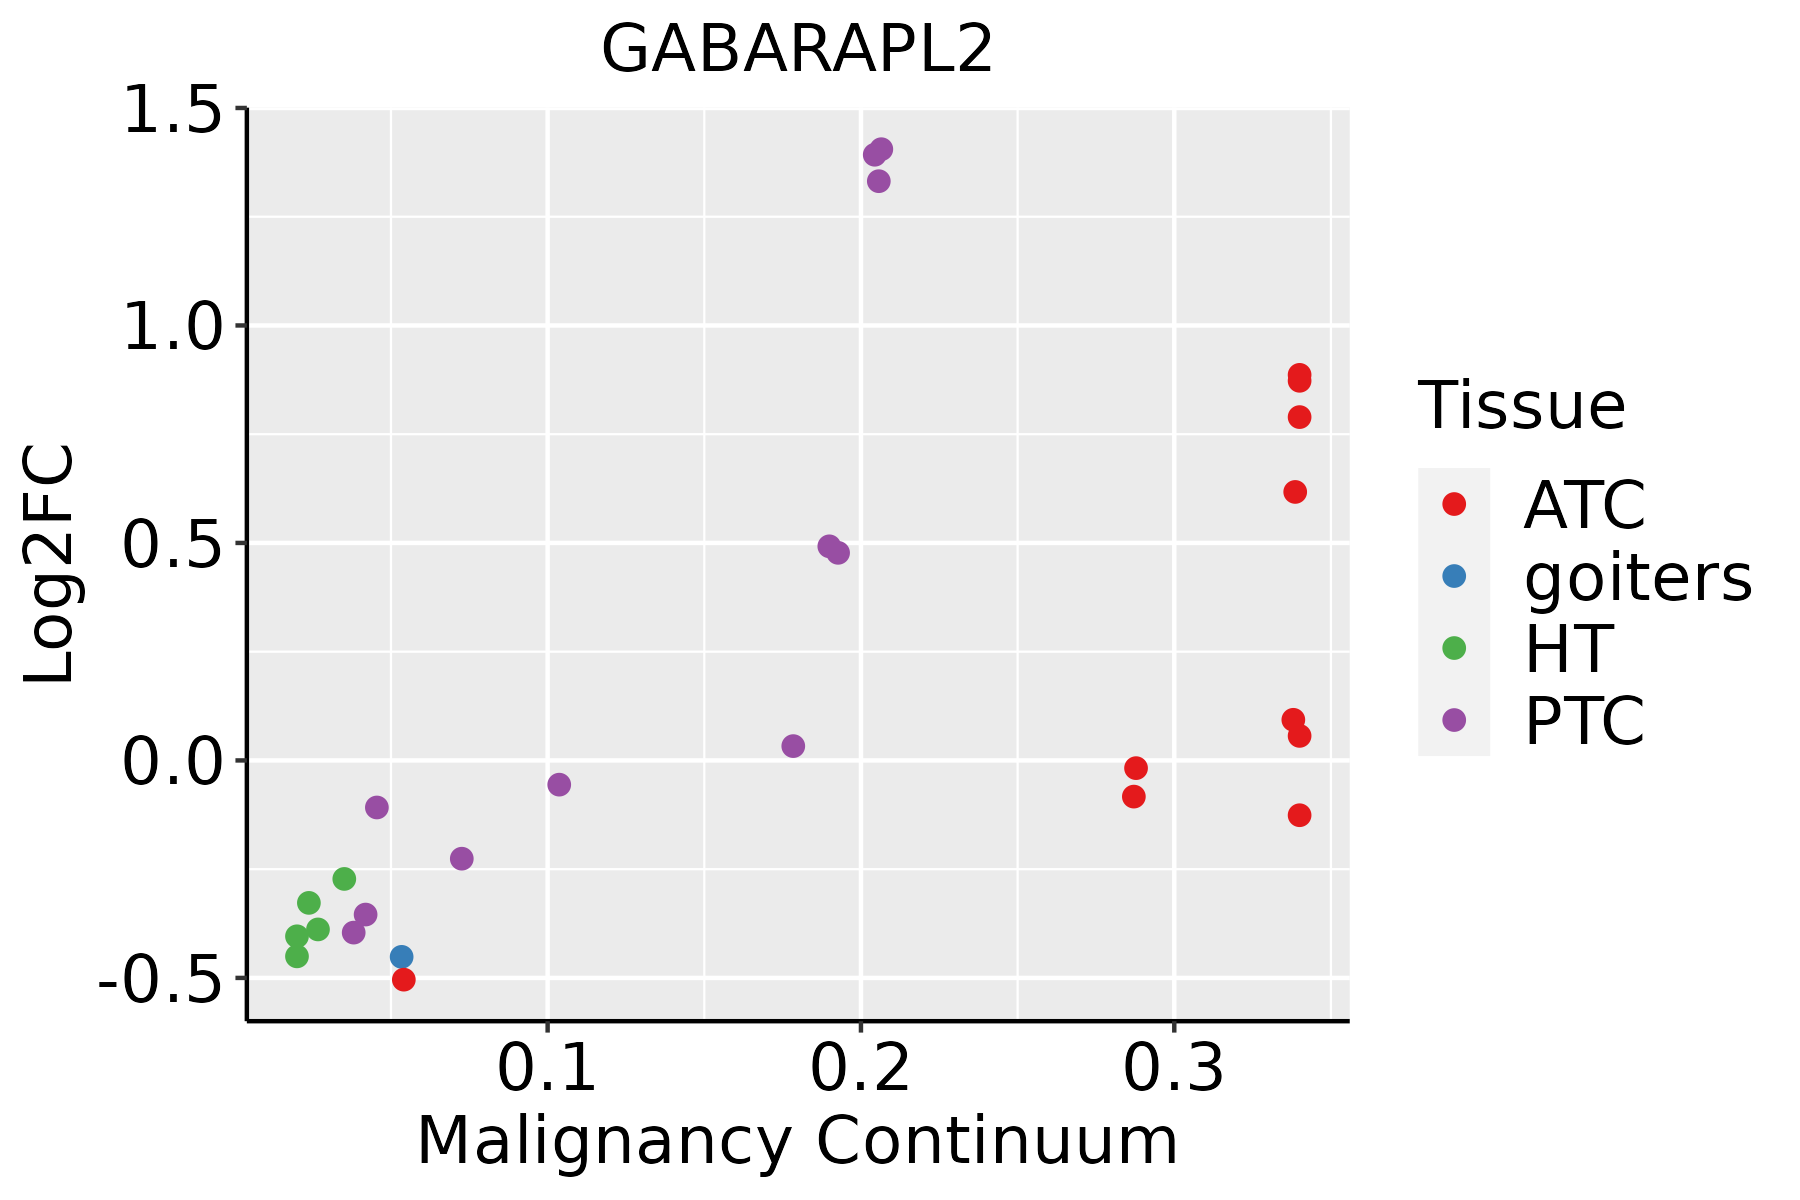 | ATC: Anaplastic thyroid cancer |
| HT: Hashimoto's thyroiditis | ||
| PTC: Papillary thyroid cancer |
| ∗log2FC in expression of this searched gene in stem-like cells from each diseased tissue sample relative to stem-like cells in normal samples in each tissue plotted against the malignancy continuum. Samples are colored based on if they are from different disease stage. |
Top |
Malignant transformation related pathway analysis |
| Find out the enriched GO biological processes and KEGG pathways involved in transition from healthy to precancer to cancer |
| Tissue | Disease Stage | Enriched GO biological Processes |
| Colorectum | AD |  |
| Colorectum | SER |  |
| Colorectum | MSS |  |
| Colorectum | MSI-H |  |
| Colorectum | FAP |  |
| ∗Top 15 enriched GO BP terms are showed in the bar plot of each disease state in each tissue. Each row represents a significant GO biological process which is colored according to the -log10(p.adjust). |
| Page: 1 2 3 4 5 6 7 8 9 |
| GO ID | Tissue | Disease Stage | Description | Gene Ratio | Bg Ratio | pvalue | p.adjust | Count |
| GO:003166912 | Liver | HCC | cellular response to nutrient levels | 130/7958 | 215/18723 | 7.52e-08 | 1.51e-06 | 130 |
| GO:007097212 | Liver | HCC | protein localization to endoplasmic reticulum | 54/7958 | 74/18723 | 1.01e-07 | 1.98e-06 | 54 |
| GO:19050371 | Liver | HCC | autophagosome organization | 70/7958 | 103/18723 | 1.52e-07 | 2.82e-06 | 70 |
| GO:00000451 | Liver | HCC | autophagosome assembly | 67/7958 | 99/18723 | 3.56e-07 | 6.07e-06 | 67 |
| GO:004217721 | Liver | HCC | negative regulation of protein catabolic process | 76/7958 | 121/18723 | 5.11e-06 | 6.41e-05 | 76 |
| GO:000926712 | Liver | HCC | cellular response to starvation | 94/7958 | 156/18723 | 5.61e-06 | 6.95e-05 | 94 |
| GO:004586122 | Liver | HCC | negative regulation of proteolysis | 186/7958 | 351/18723 | 4.19e-05 | 4.11e-04 | 186 |
| GO:190305121 | Liver | HCC | negative regulation of proteolysis involved in cellular protein catabolic process | 42/7958 | 64/18723 | 1.58e-04 | 1.26e-03 | 42 |
| GO:190336321 | Liver | HCC | negative regulation of cellular protein catabolic process | 47/7958 | 75/18723 | 3.36e-04 | 2.35e-03 | 47 |
| GO:19017994 | Liver | HCC | negative regulation of proteasomal protein catabolic process | 32/7958 | 49/18723 | 1.06e-03 | 6.11e-03 | 32 |
| GO:00327811 | Liver | HCC | positive regulation of ATPase activity | 19/7958 | 27/18723 | 3.18e-03 | 1.47e-02 | 19 |
| GO:004346211 | Liver | HCC | regulation of ATPase activity | 29/7958 | 46/18723 | 3.95e-03 | 1.74e-02 | 29 |
| GO:0006891 | Liver | HCC | intra-Golgi vesicle-mediated transport | 22/7958 | 33/18723 | 4.38e-03 | 1.90e-02 | 22 |
| GO:001049820 | Oral cavity | OSCC | proteasomal protein catabolic process | 336/7305 | 490/18723 | 5.45e-41 | 8.63e-38 | 336 |
| GO:004819315 | Oral cavity | OSCC | Golgi vesicle transport | 209/7305 | 296/18723 | 1.39e-28 | 6.30e-26 | 209 |
| GO:002241119 | Oral cavity | OSCC | cellular component disassembly | 283/7305 | 443/18723 | 9.57e-27 | 3.37e-24 | 283 |
| GO:004217620 | Oral cavity | OSCC | regulation of protein catabolic process | 254/7305 | 391/18723 | 1.07e-25 | 3.22e-23 | 254 |
| GO:190336220 | Oral cavity | OSCC | regulation of cellular protein catabolic process | 174/7305 | 255/18723 | 2.04e-21 | 3.70e-19 | 174 |
| GO:001623610 | Oral cavity | OSCC | macroautophagy | 192/7305 | 291/18723 | 7.01e-21 | 1.14e-18 | 192 |
| GO:190305020 | Oral cavity | OSCC | regulation of proteolysis involved in cellular protein catabolic process | 152/7305 | 221/18723 | 2.16e-19 | 3.15e-17 | 152 |
| Page: 1 2 3 4 5 6 7 8 9 10 11 12 13 14 15 16 17 18 19 20 21 22 23 24 25 26 27 28 29 30 31 32 33 |
| Pathway ID | Tissue | Disease Stage | Description | Gene Ratio | Bg Ratio | pvalue | p.adjust | qvalue | Count |
| hsa0413716 | Breast | Precancer | Mitophagy - animal | 15/684 | 72/8465 | 5.22e-04 | 3.93e-03 | 3.01e-03 | 15 |
| hsa0413717 | Breast | Precancer | Mitophagy - animal | 15/684 | 72/8465 | 5.22e-04 | 3.93e-03 | 3.01e-03 | 15 |
| hsa0413723 | Breast | IDC | Mitophagy - animal | 17/867 | 72/8465 | 7.61e-04 | 6.04e-03 | 4.52e-03 | 17 |
| hsa0413733 | Breast | IDC | Mitophagy - animal | 17/867 | 72/8465 | 7.61e-04 | 6.04e-03 | 4.52e-03 | 17 |
| hsa0413742 | Breast | DCIS | Mitophagy - animal | 17/846 | 72/8465 | 5.75e-04 | 4.42e-03 | 3.26e-03 | 17 |
| hsa0413752 | Breast | DCIS | Mitophagy - animal | 17/846 | 72/8465 | 5.75e-04 | 4.42e-03 | 3.26e-03 | 17 |
| hsa0413718 | Cervix | CC | Mitophagy - animal | 22/1267 | 72/8465 | 5.77e-04 | 2.75e-03 | 1.63e-03 | 22 |
| hsa046213 | Cervix | CC | NOD-like receptor signaling pathway | 41/1267 | 186/8465 | 5.90e-03 | 1.95e-02 | 1.15e-02 | 41 |
| hsa0413719 | Cervix | CC | Mitophagy - animal | 22/1267 | 72/8465 | 5.77e-04 | 2.75e-03 | 1.63e-03 | 22 |
| hsa0462112 | Cervix | CC | NOD-like receptor signaling pathway | 41/1267 | 186/8465 | 5.90e-03 | 1.95e-02 | 1.15e-02 | 41 |
| hsa04137 | Colorectum | AD | Mitophagy - animal | 29/2092 | 72/8465 | 2.49e-03 | 1.35e-02 | 8.59e-03 | 29 |
| hsa04140 | Colorectum | AD | Autophagy - animal | 49/2092 | 141/8465 | 4.58e-03 | 2.20e-02 | 1.40e-02 | 49 |
| hsa041371 | Colorectum | AD | Mitophagy - animal | 29/2092 | 72/8465 | 2.49e-03 | 1.35e-02 | 8.59e-03 | 29 |
| hsa041401 | Colorectum | AD | Autophagy - animal | 49/2092 | 141/8465 | 4.58e-03 | 2.20e-02 | 1.40e-02 | 49 |
| hsa041402 | Colorectum | SER | Autophagy - animal | 39/1580 | 141/8465 | 5.43e-03 | 3.28e-02 | 2.38e-02 | 39 |
| hsa041372 | Colorectum | SER | Mitophagy - animal | 22/1580 | 72/8465 | 9.93e-03 | 4.78e-02 | 3.47e-02 | 22 |
| hsa041403 | Colorectum | SER | Autophagy - animal | 39/1580 | 141/8465 | 5.43e-03 | 3.28e-02 | 2.38e-02 | 39 |
| hsa041373 | Colorectum | SER | Mitophagy - animal | 22/1580 | 72/8465 | 9.93e-03 | 4.78e-02 | 3.47e-02 | 22 |
| hsa041374 | Colorectum | MSS | Mitophagy - animal | 27/1875 | 72/8465 | 2.17e-03 | 1.10e-02 | 6.76e-03 | 27 |
| hsa041404 | Colorectum | MSS | Autophagy - animal | 45/1875 | 141/8465 | 4.42e-03 | 1.90e-02 | 1.16e-02 | 45 |
| Page: 1 2 3 4 5 |
Top |
Cell-cell communication analysis |
| Identification of potential cell-cell interactions between two cell types and their ligand-receptor pairs for different disease states |
| Ligand | Receptor | LRpair | Pathway | Tissue | Disease Stage |
| Page: 1 |
Top |
Single-cell gene regulatory network inference analysis |
| Find out the significant the regulons (TFs) and the target genes of each regulon across cell types for different disease states |
| TF | Cell Type | Tissue | Disease Stage | Target Gene | RSS | Regulon Activity |
| ∗The dot plots of a searched regulon are shown for all cell subpopulations in each disease state of each tissue based on the regulon specific score inferred using pySCENIC and by calculating the average expression. |
| Page: 1 |
Top |
Somatic mutation of malignant transformation related genes |
| Annotation of somatic variants for genes involved in malignant transformation |
| Hugo Symbol | Variant Class | Variant Classification | dbSNP RS | HGVSc | HGVSp | HGVSp Short | SWISSPROT | BIOTYPE | SIFT | PolyPhen | Tumor Sample Barcode | Tissue | Histology | Sex | Age | Stage | Therapy Types | Drugs | Outcome |
| GABARAPL2 | SNV | Missense_Mutation | rs747530890 | c.88N>T | p.Pro30Ser | p.P30S | P60520 | protein_coding | deleterious(0.01) | probably_damaging(0.996) | TCGA-A8-A0A7-01 | Breast | breast invasive carcinoma | Female | <65 | I/II | Unknown | Unknown | SD |
| GABARAPL2 | SNV | Missense_Mutation | c.27C>G | p.His9Gln | p.H9Q | P60520 | protein_coding | deleterious(0.02) | benign(0.086) | TCGA-BH-A18G-01 | Breast | breast invasive carcinoma | Female | >=65 | I/II | Unknown | Unknown | SD | |
| GABARAPL2 | SNV | Missense_Mutation | rs11556291 | c.152N>C | p.Val51Ala | p.V51A | P60520 | protein_coding | deleterious(0.03) | possibly_damaging(0.658) | TCGA-AZ-4315-01 | Colorectum | colon adenocarcinoma | Male | <65 | I/II | Unknown | Unknown | SD |
| GABARAPL2 | SNV | Missense_Mutation | novel | c.298G>T | p.Asp100Tyr | p.D100Y | P60520 | protein_coding | deleterious(0) | probably_damaging(0.999) | TCGA-CA-6717-01 | Colorectum | colon adenocarcinoma | Male | <65 | I/II | Chemotherapy | oxaliplatin | CR |
| GABARAPL2 | SNV | Missense_Mutation | novel | c.200N>T | p.Arg67Met | p.R67M | P60520 | protein_coding | deleterious(0) | probably_damaging(0.995) | TCGA-EI-6917-01 | Colorectum | rectum adenocarcinoma | Male | <65 | III/IV | Chemotherapy | 5fluorouracil+oxaciplatina+l-folinian | SD |
| GABARAPL2 | SNV | Missense_Mutation | rs759465042 | c.286N>A | p.Glu96Lys | p.E96K | P60520 | protein_coding | tolerated(0.07) | benign(0.053) | TCGA-A5-A1OF-01 | Endometrium | uterine corpus endometrioid carcinoma | Female | <65 | I/II | Unknown | Unknown | SD |
| GABARAPL2 | SNV | Missense_Mutation | c.250G>T | p.Val84Phe | p.V84F | P60520 | protein_coding | deleterious(0.01) | possibly_damaging(0.772) | TCGA-AP-A051-01 | Endometrium | uterine corpus endometrioid carcinoma | Female | >=65 | I/II | Unknown | Unknown | SD | |
| GABARAPL2 | SNV | Missense_Mutation | c.331N>A | p.Gly111Arg | p.G111R | P60520 | protein_coding | deleterious(0.03) | possibly_damaging(0.646) | TCGA-AP-A056-01 | Endometrium | uterine corpus endometrioid carcinoma | Female | <65 | I/II | Unknown | Unknown | SD | |
| GABARAPL2 | SNV | Missense_Mutation | novel | c.298G>T | p.Asp100Tyr | p.D100Y | P60520 | protein_coding | deleterious(0) | probably_damaging(0.999) | TCGA-EO-A22X-01 | Endometrium | uterine corpus endometrioid carcinoma | Female | <65 | III/IV | Unspecific | Carboplatin | Complete Response |
| GABARAPL2 | SNV | Missense_Mutation | novel | c.172G>A | p.Ala58Thr | p.A58T | P60520 | protein_coding | deleterious(0) | benign(0.221) | TCGA-FI-A2D5-01 | Endometrium | uterine corpus endometrioid carcinoma | Female | <65 | III/IV | Chemotherapy | carboplatinum | PD |
| Page: 1 2 |
Top |
Related drugs of malignant transformation related genes |
| Identification of chemicals and drugs interact with genes involved in malignant transfromation |
| (DGIdb 4.0) |
| Entrez ID | Symbol | Category | Interaction Types | Drug Claim Name | Drug Name | PMIDs |
| Page: 1 |

Copyright 2023-Present -The University of Texas Health Science Center at Houston |