
|
|||||
|
 | |
| |
| |
| |
| |
| |
|
Gene: EXOSC10 |
Gene summary for EXOSC10 |
| Gene information | Species | Human | Gene symbol | EXOSC10 | Gene ID | 5394 |
| Gene name | exosome component 10 | |
| Gene Alias | PM-Scl | |
| Cytomap | 1p36.22 | |
| Gene Type | protein-coding | GO ID | GO:0000184 | UniProtAcc | Q01780 |
Top |
Malignant transformation analysis |
| Identification of the aberrant gene expression in precancerous and cancerous lesions by comparing the gene expression of stem-like cells in diseased tissues with normal stem cells |
| Entrez ID | Symbol | Replicates | Species | Organ | Tissue | Adj P-value | Log2FC | Malignancy |
| 5394 | EXOSC10 | LZE4T | Human | Esophagus | ESCC | 2.69e-17 | 5.28e-01 | 0.0811 |
| 5394 | EXOSC10 | LZE7T | Human | Esophagus | ESCC | 1.04e-07 | 3.60e-01 | 0.0667 |
| 5394 | EXOSC10 | LZE8T | Human | Esophagus | ESCC | 6.92e-04 | 1.10e-01 | 0.067 |
| 5394 | EXOSC10 | LZE20T | Human | Esophagus | ESCC | 2.42e-04 | 2.00e-01 | 0.0662 |
| 5394 | EXOSC10 | LZE22T | Human | Esophagus | ESCC | 4.86e-05 | 4.13e-01 | 0.068 |
| 5394 | EXOSC10 | LZE24T | Human | Esophagus | ESCC | 1.95e-06 | 3.07e-01 | 0.0596 |
| 5394 | EXOSC10 | LZE21T | Human | Esophagus | ESCC | 4.20e-02 | 1.52e-01 | 0.0655 |
| 5394 | EXOSC10 | P1T-E | Human | Esophagus | ESCC | 1.67e-04 | 4.54e-01 | 0.0875 |
| 5394 | EXOSC10 | P2T-E | Human | Esophagus | ESCC | 1.08e-30 | 5.74e-01 | 0.1177 |
| 5394 | EXOSC10 | P4T-E | Human | Esophagus | ESCC | 4.33e-13 | 2.26e-01 | 0.1323 |
| 5394 | EXOSC10 | P5T-E | Human | Esophagus | ESCC | 3.11e-15 | 3.31e-01 | 0.1327 |
| 5394 | EXOSC10 | P8T-E | Human | Esophagus | ESCC | 1.39e-16 | 3.30e-01 | 0.0889 |
| 5394 | EXOSC10 | P9T-E | Human | Esophagus | ESCC | 1.55e-05 | 1.51e-01 | 0.1131 |
| 5394 | EXOSC10 | P10T-E | Human | Esophagus | ESCC | 1.81e-22 | 3.90e-01 | 0.116 |
| 5394 | EXOSC10 | P11T-E | Human | Esophagus | ESCC | 6.63e-15 | 5.39e-01 | 0.1426 |
| 5394 | EXOSC10 | P12T-E | Human | Esophagus | ESCC | 3.07e-13 | 3.25e-01 | 0.1122 |
| 5394 | EXOSC10 | P15T-E | Human | Esophagus | ESCC | 1.84e-16 | 4.60e-01 | 0.1149 |
| 5394 | EXOSC10 | P16T-E | Human | Esophagus | ESCC | 1.01e-17 | 3.45e-01 | 0.1153 |
| 5394 | EXOSC10 | P17T-E | Human | Esophagus | ESCC | 3.70e-18 | 5.90e-01 | 0.1278 |
| 5394 | EXOSC10 | P19T-E | Human | Esophagus | ESCC | 4.26e-03 | 6.66e-01 | 0.1662 |
| Page: 1 2 3 4 5 6 |
| Tissue | Expression Dynamics | Abbreviation |
| Esophagus |  | ESCC: Esophageal squamous cell carcinoma |
| HGIN: High-grade intraepithelial neoplasias | ||
| LGIN: Low-grade intraepithelial neoplasias | ||
| Liver | 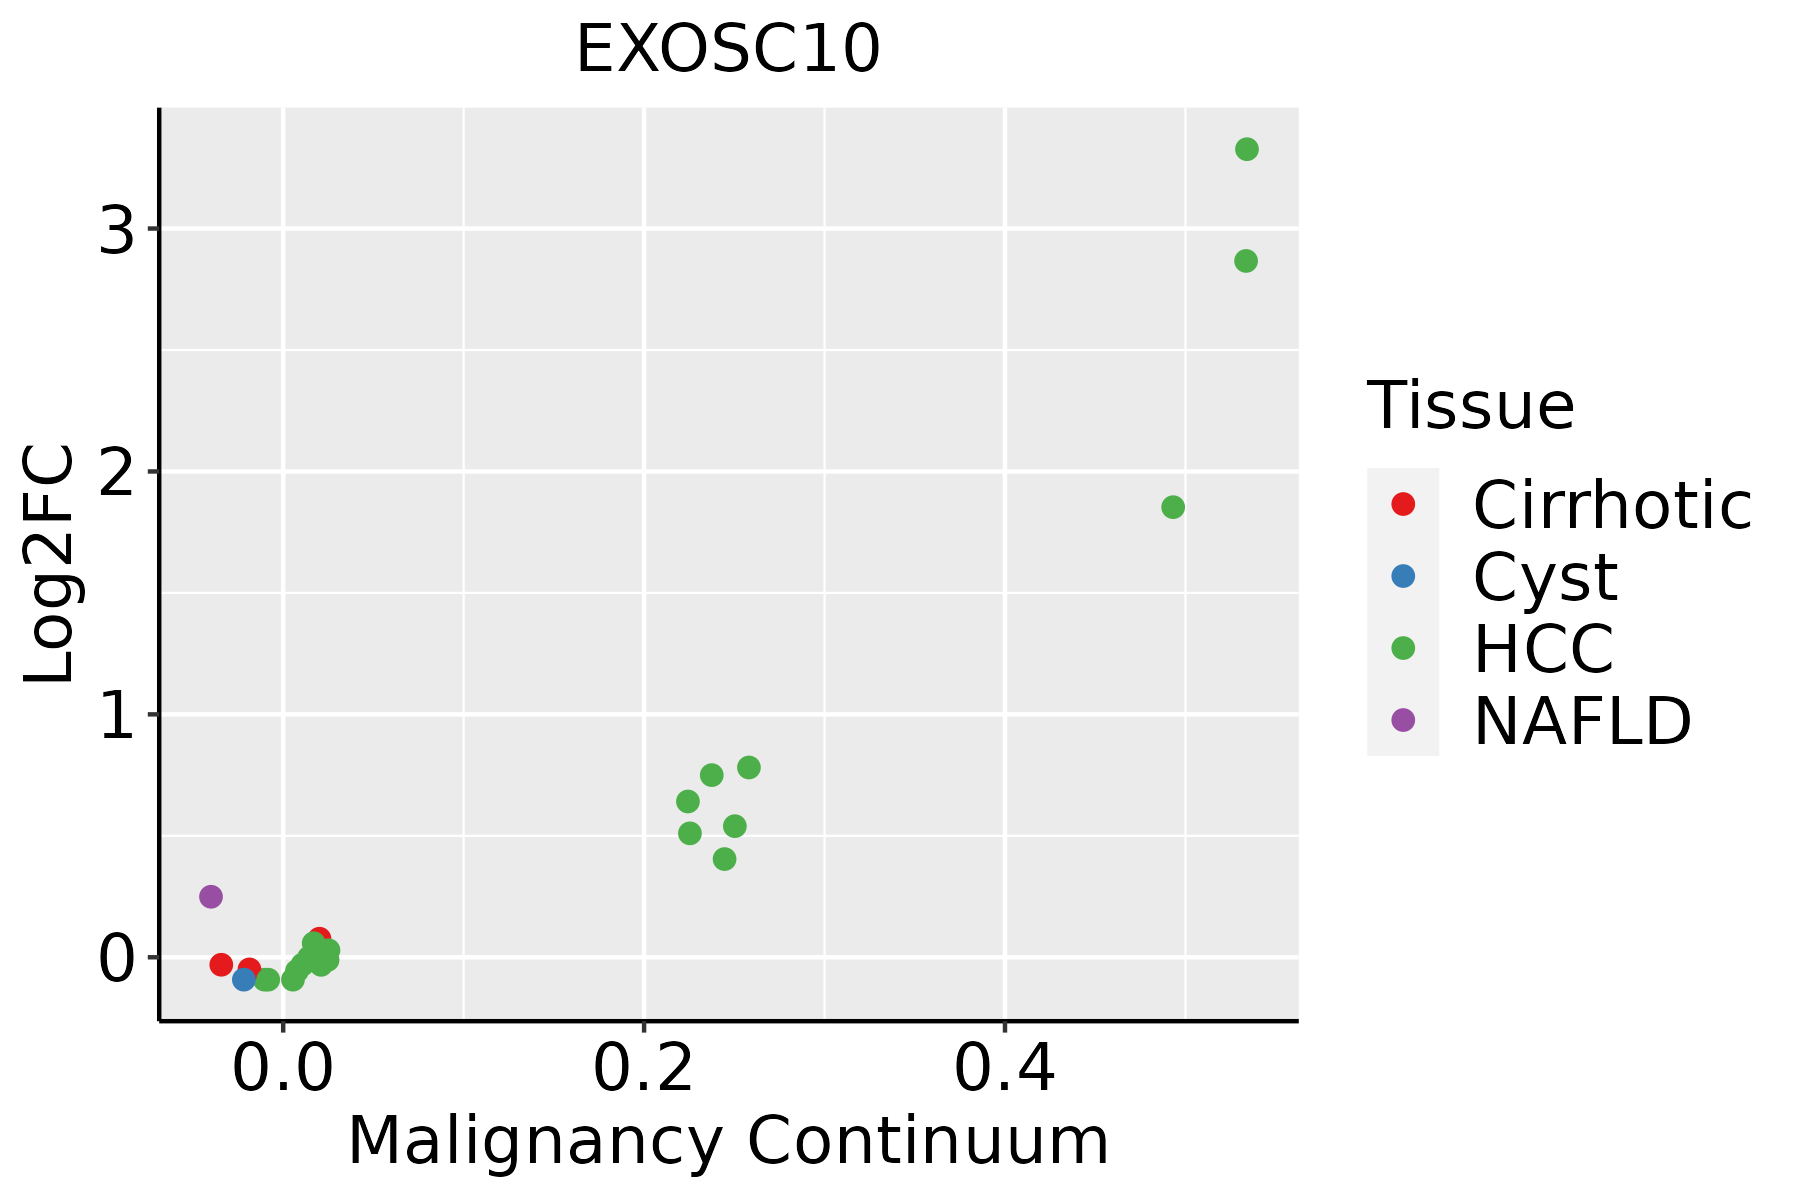 | HCC: Hepatocellular carcinoma |
| NAFLD: Non-alcoholic fatty liver disease | ||
| Oral Cavity |  | EOLP: Erosive Oral lichen planus |
| LP: leukoplakia | ||
| NEOLP: Non-erosive oral lichen planus | ||
| OSCC: Oral squamous cell carcinoma | ||
| Prostate | 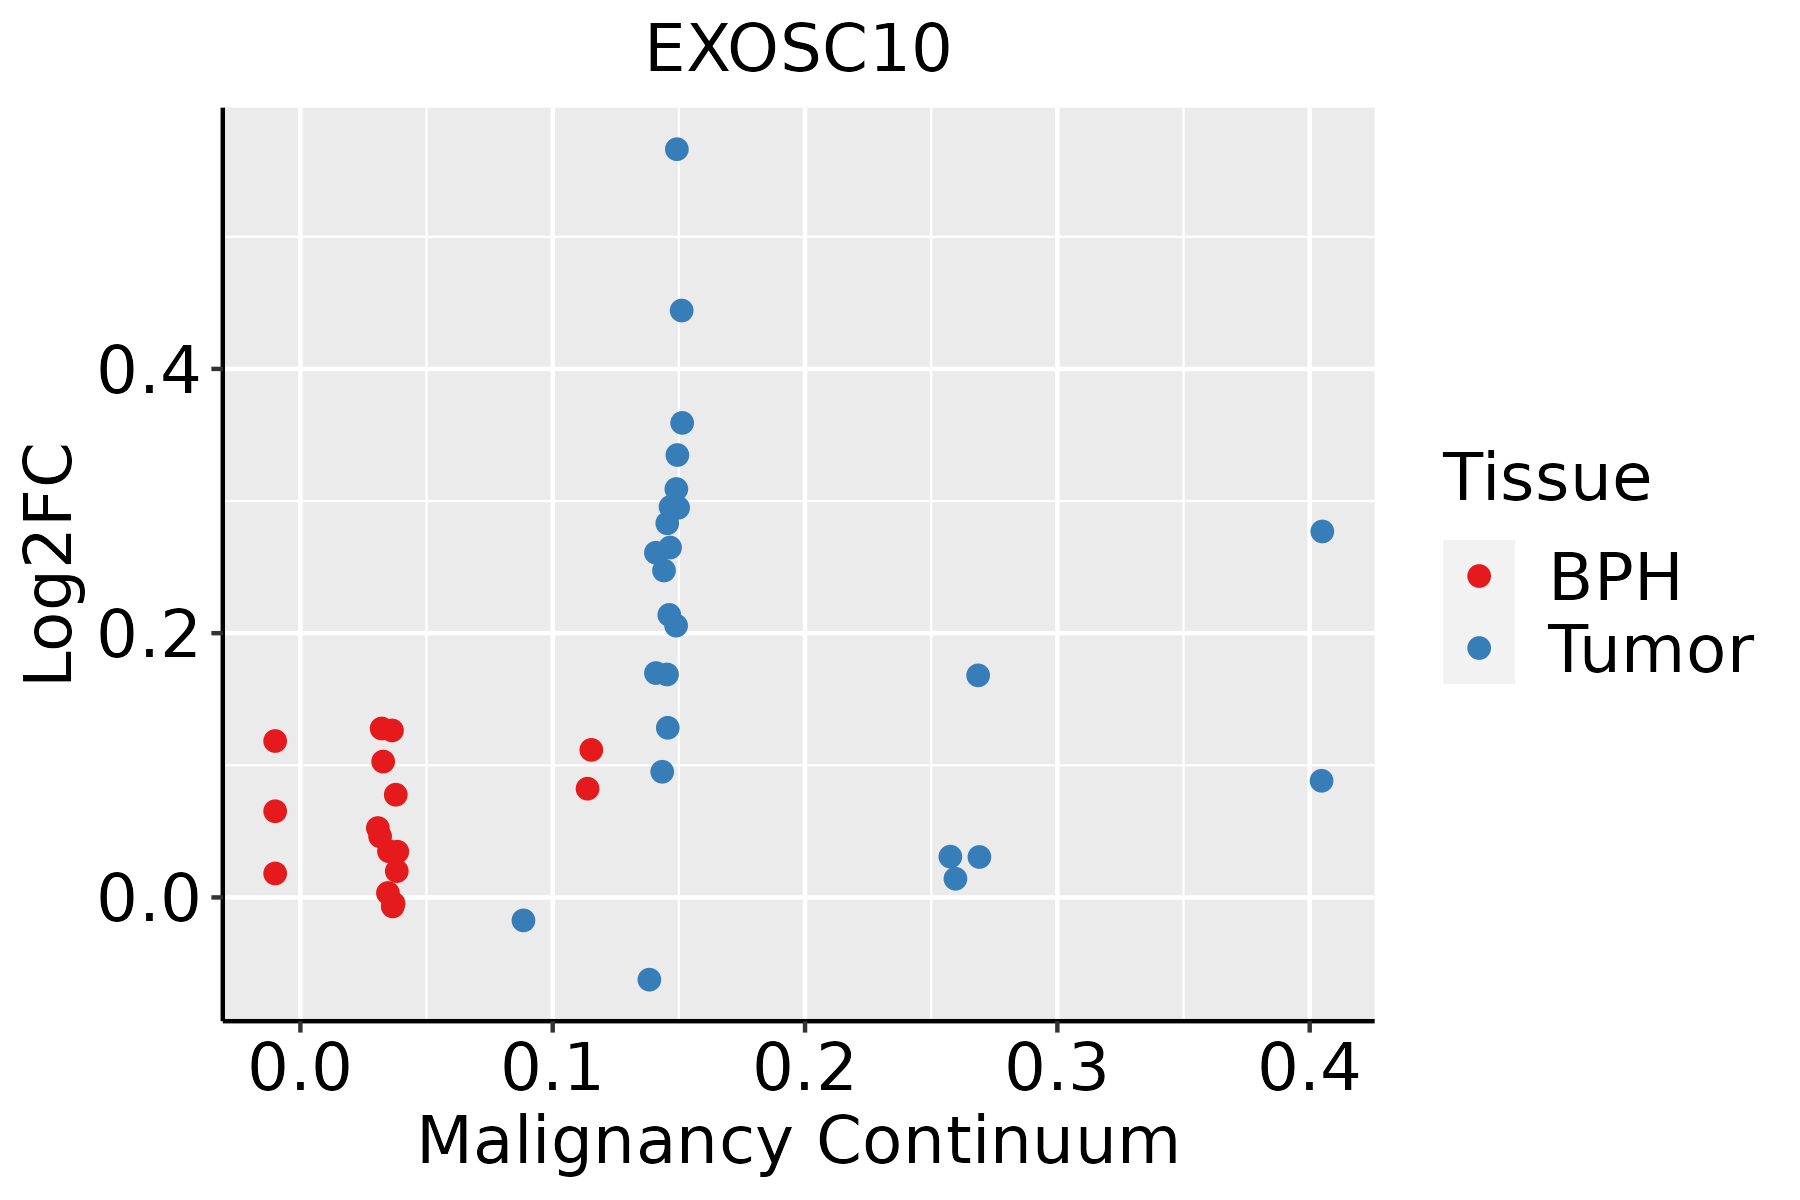 | BPH: Benign Prostatic Hyperplasia |
| Skin |  | AK: Actinic keratosis |
| cSCC: Cutaneous squamous cell carcinoma | ||
| SCCIS:squamous cell carcinoma in situ | ||
| Thyroid | 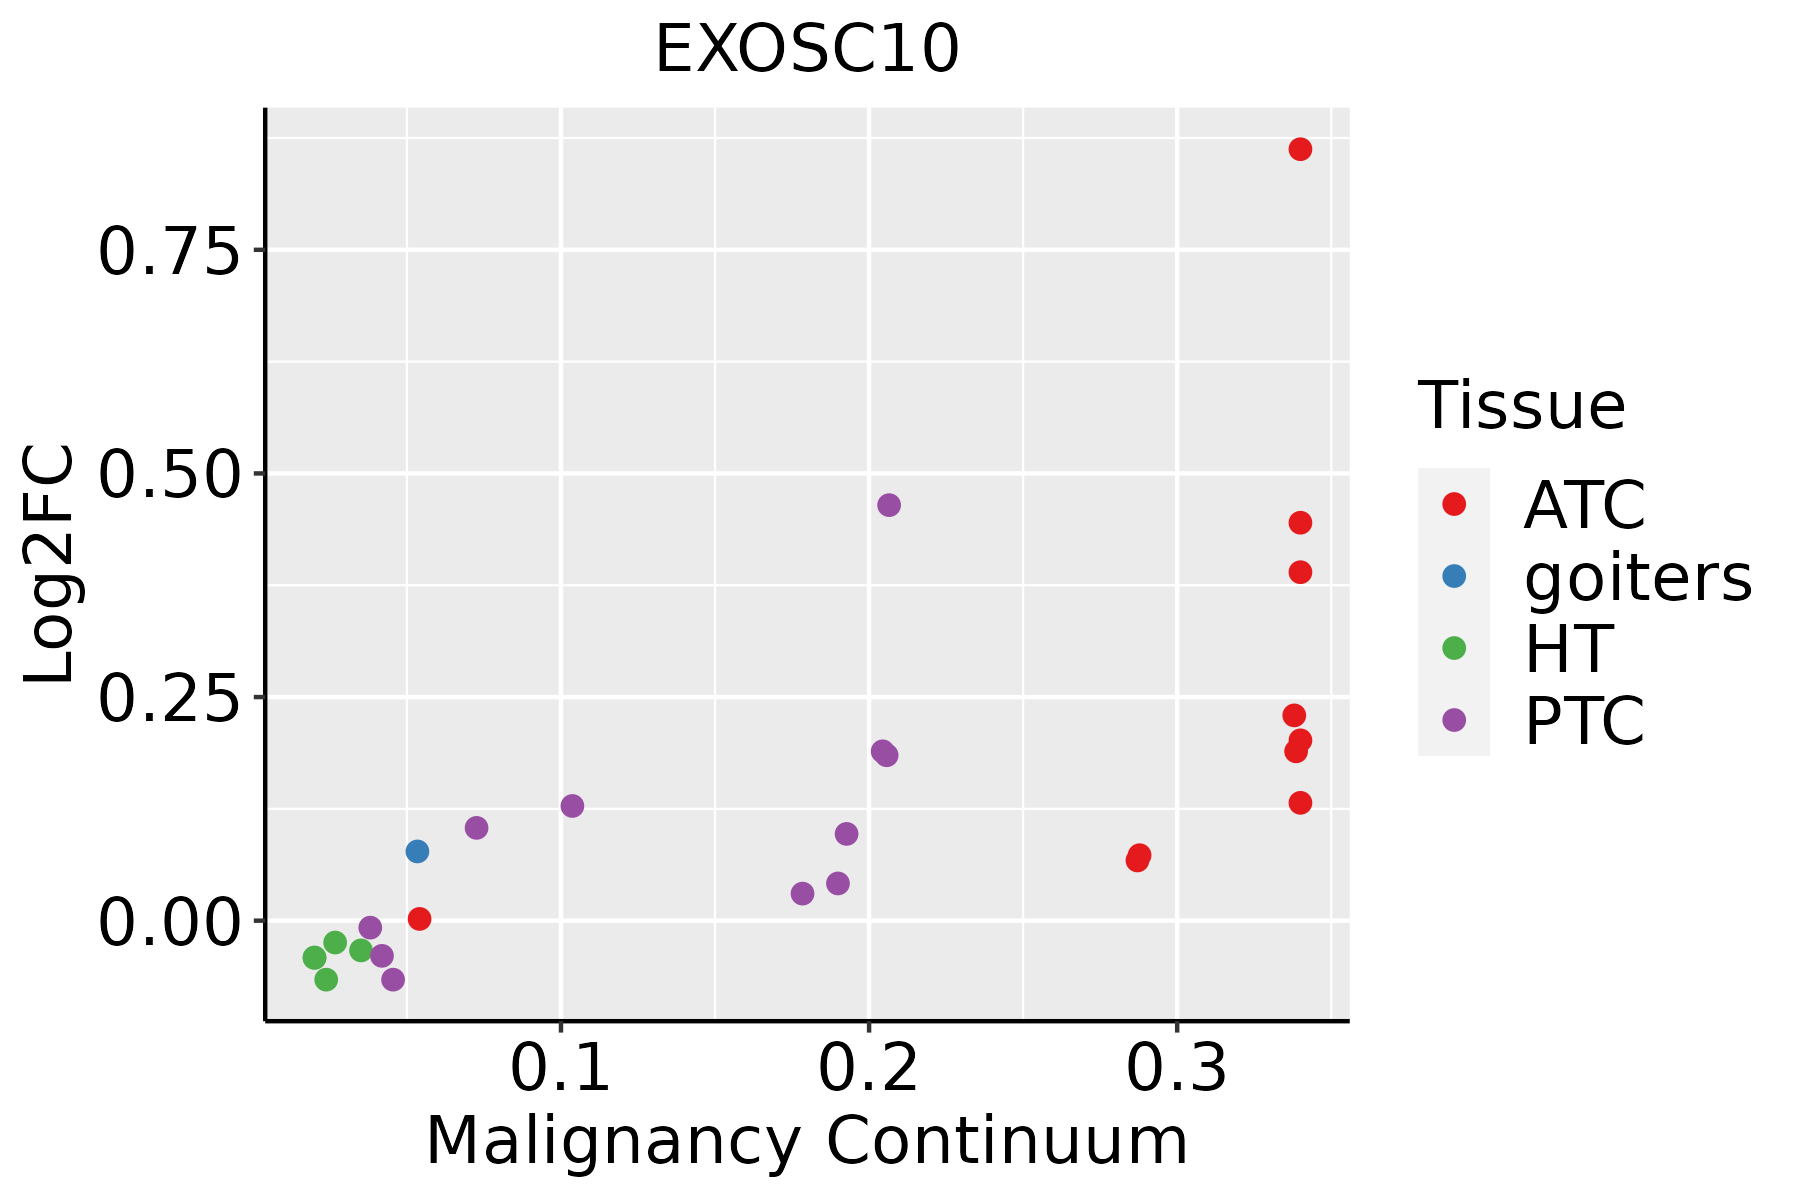 | ATC: Anaplastic thyroid cancer |
| HT: Hashimoto's thyroiditis | ||
| PTC: Papillary thyroid cancer |
| ∗log2FC in expression of this searched gene in stem-like cells from each diseased tissue sample relative to stem-like cells in normal samples in each tissue plotted against the malignancy continuum. Samples are colored based on if they are from different disease stage. |
Top |
Malignant transformation related pathway analysis |
| Find out the enriched GO biological processes and KEGG pathways involved in transition from healthy to precancer to cancer |
| Tissue | Disease Stage | Enriched GO biological Processes |
| Colorectum | AD |  |
| Colorectum | SER |  |
| Colorectum | MSS |  |
| Colorectum | MSI-H |  |
| Colorectum | FAP |  |
| ∗Top 15 enriched GO BP terms are showed in the bar plot of each disease state in each tissue. Each row represents a significant GO biological process which is colored according to the -log10(p.adjust). |
| Page: 1 2 3 4 5 6 7 8 9 |
| GO ID | Tissue | Disease Stage | Description | Gene Ratio | Bg Ratio | pvalue | p.adjust | Count |
| GO:00082984 | Skin | cSCC | intracellular mRNA localization | 9/4864 | 13/18723 | 1.33e-03 | 8.50e-03 | 9 |
| GO:00160783 | Skin | cSCC | tRNA catabolic process | 9/4864 | 13/18723 | 1.33e-03 | 8.50e-03 | 9 |
| GO:00160743 | Skin | cSCC | sno(s)RNA metabolic process | 10/4864 | 16/18723 | 2.25e-03 | 1.32e-02 | 10 |
| GO:00063993 | Skin | cSCC | tRNA metabolic process | 64/4864 | 179/18723 | 2.34e-03 | 1.36e-02 | 64 |
| GO:00160753 | Skin | cSCC | rRNA catabolic process | 12/4864 | 21/18723 | 2.40e-03 | 1.38e-02 | 12 |
| GO:00431443 | Skin | cSCC | sno(s)RNA processing | 9/4864 | 14/18723 | 2.87e-03 | 1.60e-02 | 9 |
| GO:00346614 | Skin | cSCC | ncRNA catabolic process | 20/4864 | 43/18723 | 2.91e-03 | 1.62e-02 | 20 |
| GO:0043628 | Skin | cSCC | ncRNA 3'-end processing | 22/4864 | 50/18723 | 4.31e-03 | 2.27e-02 | 22 |
| GO:004002912 | Skin | cSCC | regulation of gene expression, epigenetic | 39/4864 | 105/18723 | 7.56e-03 | 3.53e-02 | 39 |
| GO:2000279 | Skin | cSCC | negative regulation of DNA biosynthetic process | 17/4864 | 38/18723 | 9.41e-03 | 4.25e-02 | 17 |
| GO:0022613113 | Thyroid | PTC | ribonucleoprotein complex biogenesis | 292/5968 | 463/18723 | 3.24e-44 | 2.05e-40 | 292 |
| GO:0042254113 | Thyroid | PTC | ribosome biogenesis | 202/5968 | 299/18723 | 3.47e-37 | 5.47e-34 | 202 |
| GO:0006364112 | Thyroid | PTC | rRNA processing | 156/5968 | 225/18723 | 5.58e-31 | 5.03e-28 | 156 |
| GO:0016072112 | Thyroid | PTC | rRNA metabolic process | 160/5968 | 236/18723 | 5.68e-30 | 3.58e-27 | 160 |
| GO:0006403112 | Thyroid | PTC | RNA localization | 130/5968 | 201/18723 | 9.23e-22 | 1.94e-19 | 130 |
| GO:003447018 | Thyroid | PTC | ncRNA processing | 215/5968 | 395/18723 | 7.14e-21 | 1.22e-18 | 215 |
| GO:0006401112 | Thyroid | PTC | RNA catabolic process | 163/5968 | 278/18723 | 2.13e-20 | 3.27e-18 | 163 |
| GO:0006402112 | Thyroid | PTC | mRNA catabolic process | 139/5968 | 232/18723 | 9.59e-19 | 1.12e-16 | 139 |
| GO:0034655112 | Thyroid | PTC | nucleobase-containing compound catabolic process | 211/5968 | 407/18723 | 2.72e-17 | 2.52e-15 | 211 |
| GO:0000956111 | Thyroid | PTC | nuclear-transcribed mRNA catabolic process | 78/5968 | 112/18723 | 2.37e-16 | 1.94e-14 | 78 |
| Page: 1 2 3 4 5 6 7 8 9 10 11 12 13 14 15 16 17 18 19 20 21 22 23 24 |
| Pathway ID | Tissue | Disease Stage | Description | Gene Ratio | Bg Ratio | pvalue | p.adjust | qvalue | Count |
| hsa0301824 | Esophagus | ESCC | RNA degradation | 62/4205 | 79/8465 | 1.18e-07 | 9.39e-07 | 4.81e-07 | 62 |
| hsa0301834 | Esophagus | ESCC | RNA degradation | 62/4205 | 79/8465 | 1.18e-07 | 9.39e-07 | 4.81e-07 | 62 |
| hsa03018 | Liver | Cirrhotic | RNA degradation | 44/2530 | 79/8465 | 1.43e-06 | 1.65e-05 | 1.02e-05 | 44 |
| hsa030181 | Liver | Cirrhotic | RNA degradation | 44/2530 | 79/8465 | 1.43e-06 | 1.65e-05 | 1.02e-05 | 44 |
| hsa030182 | Liver | HCC | RNA degradation | 58/4020 | 79/8465 | 2.29e-06 | 2.19e-05 | 1.22e-05 | 58 |
| hsa030183 | Liver | HCC | RNA degradation | 58/4020 | 79/8465 | 2.29e-06 | 2.19e-05 | 1.22e-05 | 58 |
| hsa030189 | Oral cavity | OSCC | RNA degradation | 59/3704 | 79/8465 | 2.05e-08 | 1.91e-07 | 9.70e-08 | 59 |
| hsa0301814 | Oral cavity | OSCC | RNA degradation | 59/3704 | 79/8465 | 2.05e-08 | 1.91e-07 | 9.70e-08 | 59 |
| hsa0301823 | Oral cavity | LP | RNA degradation | 39/2418 | 79/8465 | 6.98e-05 | 4.38e-04 | 2.83e-04 | 39 |
| hsa0301833 | Oral cavity | LP | RNA degradation | 39/2418 | 79/8465 | 6.98e-05 | 4.38e-04 | 2.83e-04 | 39 |
| hsa0301822 | Prostate | Tumor | RNA degradation | 30/1791 | 79/8465 | 4.48e-04 | 2.35e-03 | 1.46e-03 | 30 |
| hsa0301832 | Prostate | Tumor | RNA degradation | 30/1791 | 79/8465 | 4.48e-04 | 2.35e-03 | 1.46e-03 | 30 |
| Page: 1 |
Top |
Cell-cell communication analysis |
| Identification of potential cell-cell interactions between two cell types and their ligand-receptor pairs for different disease states |
| Ligand | Receptor | LRpair | Pathway | Tissue | Disease Stage |
| Page: 1 |
Top |
Single-cell gene regulatory network inference analysis |
| Find out the significant the regulons (TFs) and the target genes of each regulon across cell types for different disease states |
| TF | Cell Type | Tissue | Disease Stage | Target Gene | RSS | Regulon Activity |
| ∗The dot plots of a searched regulon are shown for all cell subpopulations in each disease state of each tissue based on the regulon specific score inferred using pySCENIC and by calculating the average expression. |
| Page: 1 |
Top |
Somatic mutation of malignant transformation related genes |
| Annotation of somatic variants for genes involved in malignant transformation |
| Hugo Symbol | Variant Class | Variant Classification | dbSNP RS | HGVSc | HGVSp | HGVSp Short | SWISSPROT | BIOTYPE | SIFT | PolyPhen | Tumor Sample Barcode | Tissue | Histology | Sex | Age | Stage | Therapy Types | Drugs | Outcome |
| EXOSC10 | SNV | Missense_Mutation | c.1089N>C | p.Lys363Asn | p.K363N | Q01780 | protein_coding | deleterious(0) | probably_damaging(1) | TCGA-BH-A0B3-01 | Breast | breast invasive carcinoma | Female | <65 | I/II | Chemotherapy | cyclophosphamide | SD | |
| EXOSC10 | SNV | Missense_Mutation | c.1807G>C | p.Glu603Gln | p.E603Q | Q01780 | protein_coding | tolerated(0.14) | benign(0.058) | TCGA-E2-A10C-01 | Breast | breast invasive carcinoma | Female | <65 | I/II | Chemotherapy | cytoxan | SD | |
| EXOSC10 | insertion | Frame_Shift_Ins | novel | c.883_884insTTGAAATA | p.Asp295ValfsTer14 | p.D295Vfs*14 | Q01780 | protein_coding | TCGA-AR-A0TU-01 | Breast | breast invasive carcinoma | Female | <65 | I/II | Unspecific | Doxorubicin | SD | ||
| EXOSC10 | insertion | Nonsense_Mutation | novel | c.979_980insAGTGCTATAAATTTCCCTCTAC | p.Cys327Ter | p.C327* | Q01780 | protein_coding | TCGA-BH-A0EE-01 | Breast | breast invasive carcinoma | Female | >=65 | I/II | Chemotherapy | docetaxel | SD | ||
| EXOSC10 | SNV | Missense_Mutation | c.2654N>C | p.Arg885Thr | p.R885T | Q01780 | protein_coding | deleterious_low_confidence(0) | probably_damaging(0.997) | TCGA-EA-A43B-01 | Cervix | cervical & endocervical cancer | Female | <65 | I/II | Chemotherapy | cisplatin | CR | |
| EXOSC10 | SNV | Missense_Mutation | c.1465N>C | p.Glu489Gln | p.E489Q | Q01780 | protein_coding | tolerated(0.07) | benign(0.066) | TCGA-JW-A5VL-01 | Cervix | cervical & endocervical cancer | Female | <65 | I/II | Unknown | Unknown | SD | |
| EXOSC10 | SNV | Missense_Mutation | novel | c.1162N>C | p.Asp388His | p.D388H | Q01780 | protein_coding | deleterious(0) | probably_damaging(1) | TCGA-VS-A8EL-01 | Cervix | cervical & endocervical cancer | Female | <65 | I/II | Chemotherapy | cisplatin | CR |
| EXOSC10 | SNV | Missense_Mutation | rs757576637 | c.1373N>A | p.Arg458His | p.R458H | Q01780 | protein_coding | tolerated(0.1) | possibly_damaging(0.608) | TCGA-ZJ-AB0I-01 | Cervix | cervical & endocervical cancer | Female | <65 | I/II | Unknown | Unknown | SD |
| EXOSC10 | SNV | Missense_Mutation | c.892N>A | p.Val298Met | p.V298M | Q01780 | protein_coding | tolerated(0.11) | benign(0.34) | TCGA-A6-2677-01 | Colorectum | colon adenocarcinoma | Female | >=65 | III/IV | Ancillary | leucovorin | SD | |
| EXOSC10 | SNV | Missense_Mutation | c.1904C>A | p.Ala635Glu | p.A635E | Q01780 | protein_coding | tolerated(0.23) | benign(0.003) | TCGA-A6-5665-01 | Colorectum | colon adenocarcinoma | Female | >=65 | I/II | Unknown | Unknown | PD |
| Page: 1 2 3 4 5 6 7 8 |
Top |
Related drugs of malignant transformation related genes |
| Identification of chemicals and drugs interact with genes involved in malignant transfromation |
| (DGIdb 4.0) |
| Entrez ID | Symbol | Category | Interaction Types | Drug Claim Name | Drug Name | PMIDs |
| Page: 1 |

Copyright 2023-Present -The University of Texas Health Science Center at Houston |