
|
|||||
|
 | |
| |
| |
| |
| |
| |
|
Gene: DLC1 |
Gene summary for DLC1 |
| Gene information | Species | Human | Gene symbol | DLC1 | Gene ID | 10395 |
| Gene name | DLC1 Rho GTPase activating protein | |
| Gene Alias | ARHGAP7 | |
| Cytomap | 8p22 | |
| Gene Type | protein-coding | GO ID | GO:0000902 | UniProtAcc | A8K119 |
Top |
Malignant transformation analysis |
| Identification of the aberrant gene expression in precancerous and cancerous lesions by comparing the gene expression of stem-like cells in diseased tissues with normal stem cells |
| Entrez ID | Symbol | Replicates | Species | Organ | Tissue | Adj P-value | Log2FC | Malignancy |
| 10395 | DLC1 | P5T-E | Human | Esophagus | ESCC | 1.53e-03 | 1.66e-01 | 0.1327 |
| 10395 | DLC1 | P8T-E | Human | Esophagus | ESCC | 4.92e-02 | 7.89e-02 | 0.0889 |
| 10395 | DLC1 | P9T-E | Human | Esophagus | ESCC | 1.30e-05 | 2.74e-01 | 0.1131 |
| 10395 | DLC1 | P10T-E | Human | Esophagus | ESCC | 1.15e-10 | 2.17e-01 | 0.116 |
| 10395 | DLC1 | P11T-E | Human | Esophagus | ESCC | 2.98e-15 | 6.93e-01 | 0.1426 |
| 10395 | DLC1 | P16T-E | Human | Esophagus | ESCC | 2.26e-03 | 6.17e-02 | 0.1153 |
| 10395 | DLC1 | P19T-E | Human | Esophagus | ESCC | 2.29e-07 | 8.23e-01 | 0.1662 |
| 10395 | DLC1 | P22T-E | Human | Esophagus | ESCC | 7.33e-04 | 6.40e-02 | 0.1236 |
| 10395 | DLC1 | P24T-E | Human | Esophagus | ESCC | 7.37e-05 | 2.48e-01 | 0.1287 |
| 10395 | DLC1 | P28T-E | Human | Esophagus | ESCC | 1.44e-02 | 5.81e-02 | 0.1149 |
| 10395 | DLC1 | P42T-E | Human | Esophagus | ESCC | 3.16e-03 | 2.56e-01 | 0.1175 |
| 10395 | DLC1 | P44T-E | Human | Esophagus | ESCC | 2.68e-05 | 2.06e-01 | 0.1096 |
| 10395 | DLC1 | P47T-E | Human | Esophagus | ESCC | 2.47e-05 | 1.08e-01 | 0.1067 |
| 10395 | DLC1 | P52T-E | Human | Esophagus | ESCC | 3.67e-02 | 1.43e-01 | 0.1555 |
| 10395 | DLC1 | P57T-E | Human | Esophagus | ESCC | 4.18e-02 | 1.26e-01 | 0.0926 |
| 10395 | DLC1 | P75T-E | Human | Esophagus | ESCC | 2.08e-08 | 1.28e-01 | 0.1125 |
| 10395 | DLC1 | P76T-E | Human | Esophagus | ESCC | 7.10e-06 | 7.86e-02 | 0.1207 |
| 10395 | DLC1 | P79T-E | Human | Esophagus | ESCC | 1.85e-02 | 6.70e-02 | 0.1154 |
| 10395 | DLC1 | P89T-E | Human | Esophagus | ESCC | 6.03e-05 | 7.21e-01 | 0.1752 |
| 10395 | DLC1 | P130T-E | Human | Esophagus | ESCC | 5.53e-03 | 4.14e-02 | 0.1676 |
| Page: 1 2 3 4 5 |
| Tissue | Expression Dynamics | Abbreviation |
| Esophagus | 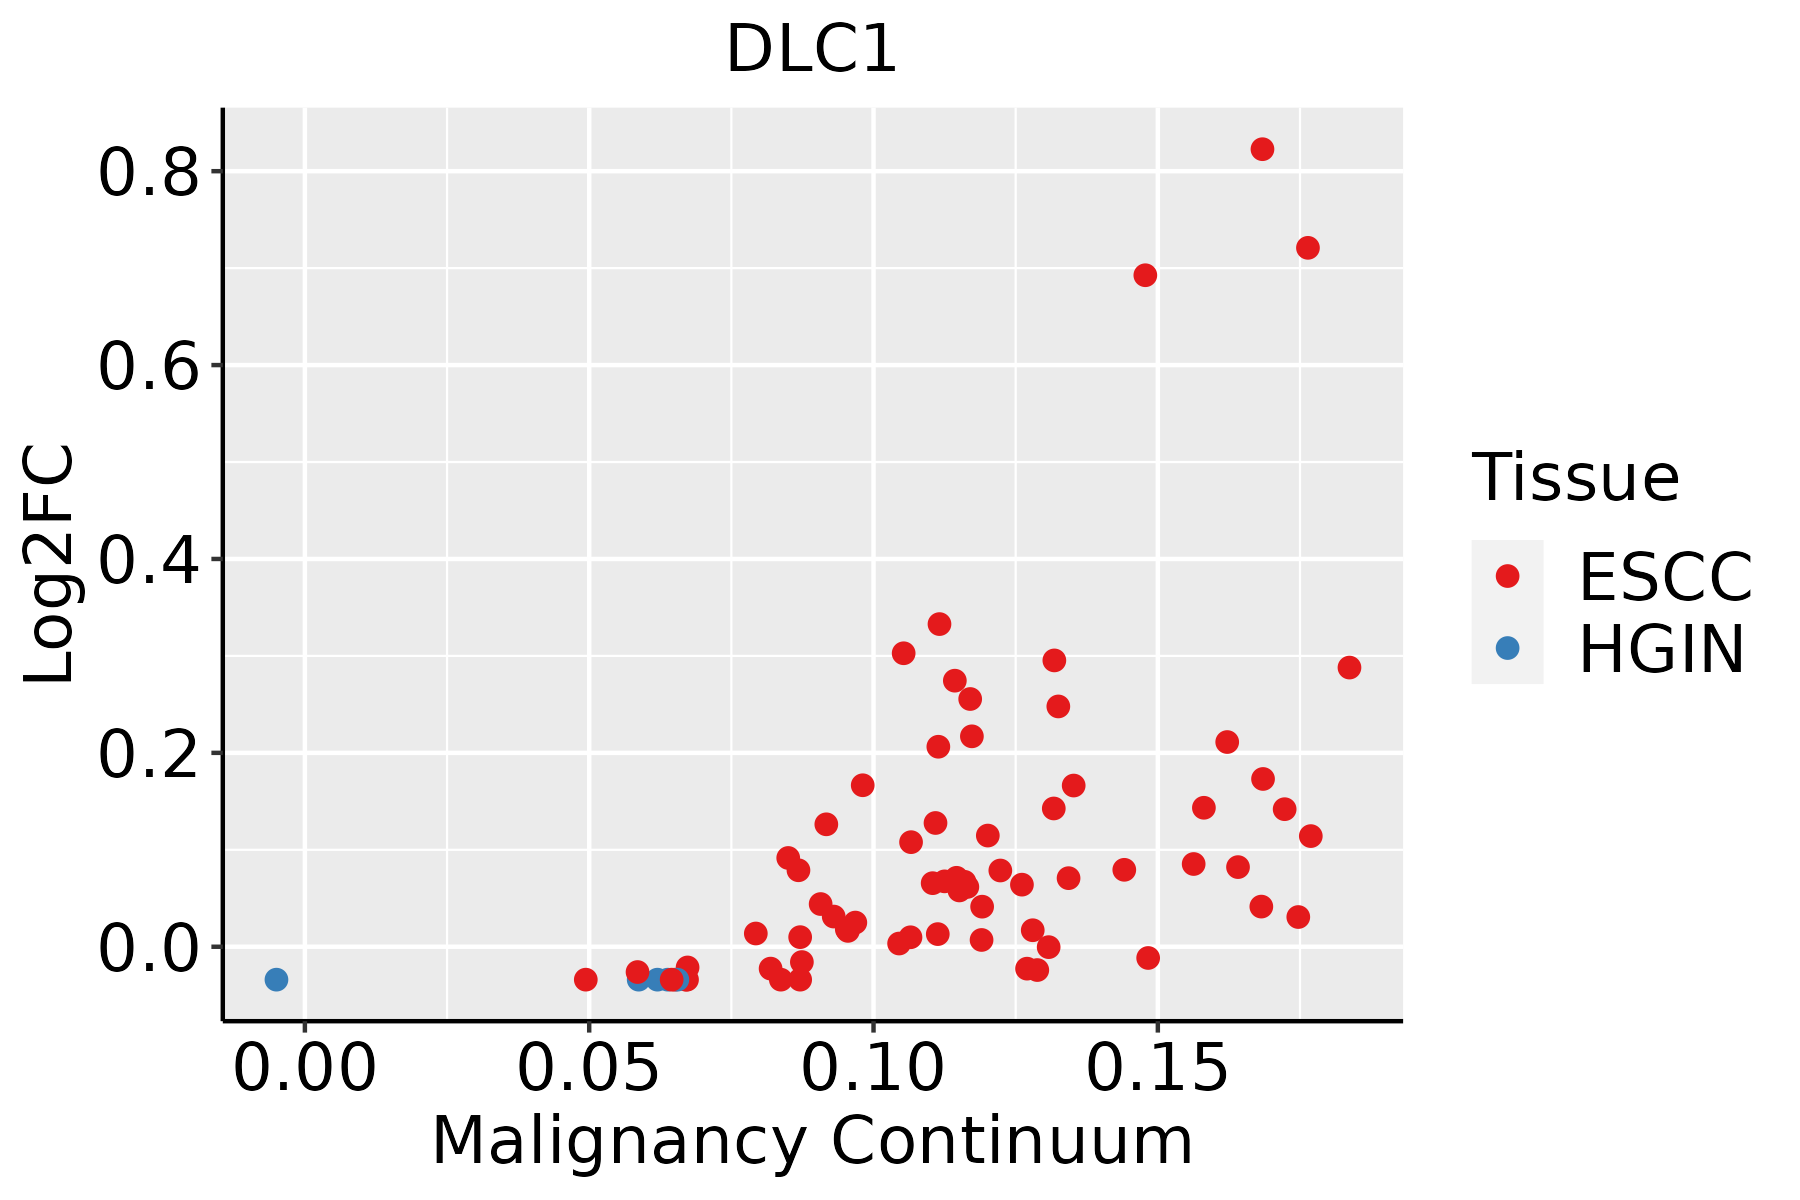 | ESCC: Esophageal squamous cell carcinoma |
| HGIN: High-grade intraepithelial neoplasias | ||
| LGIN: Low-grade intraepithelial neoplasias | ||
| Liver | 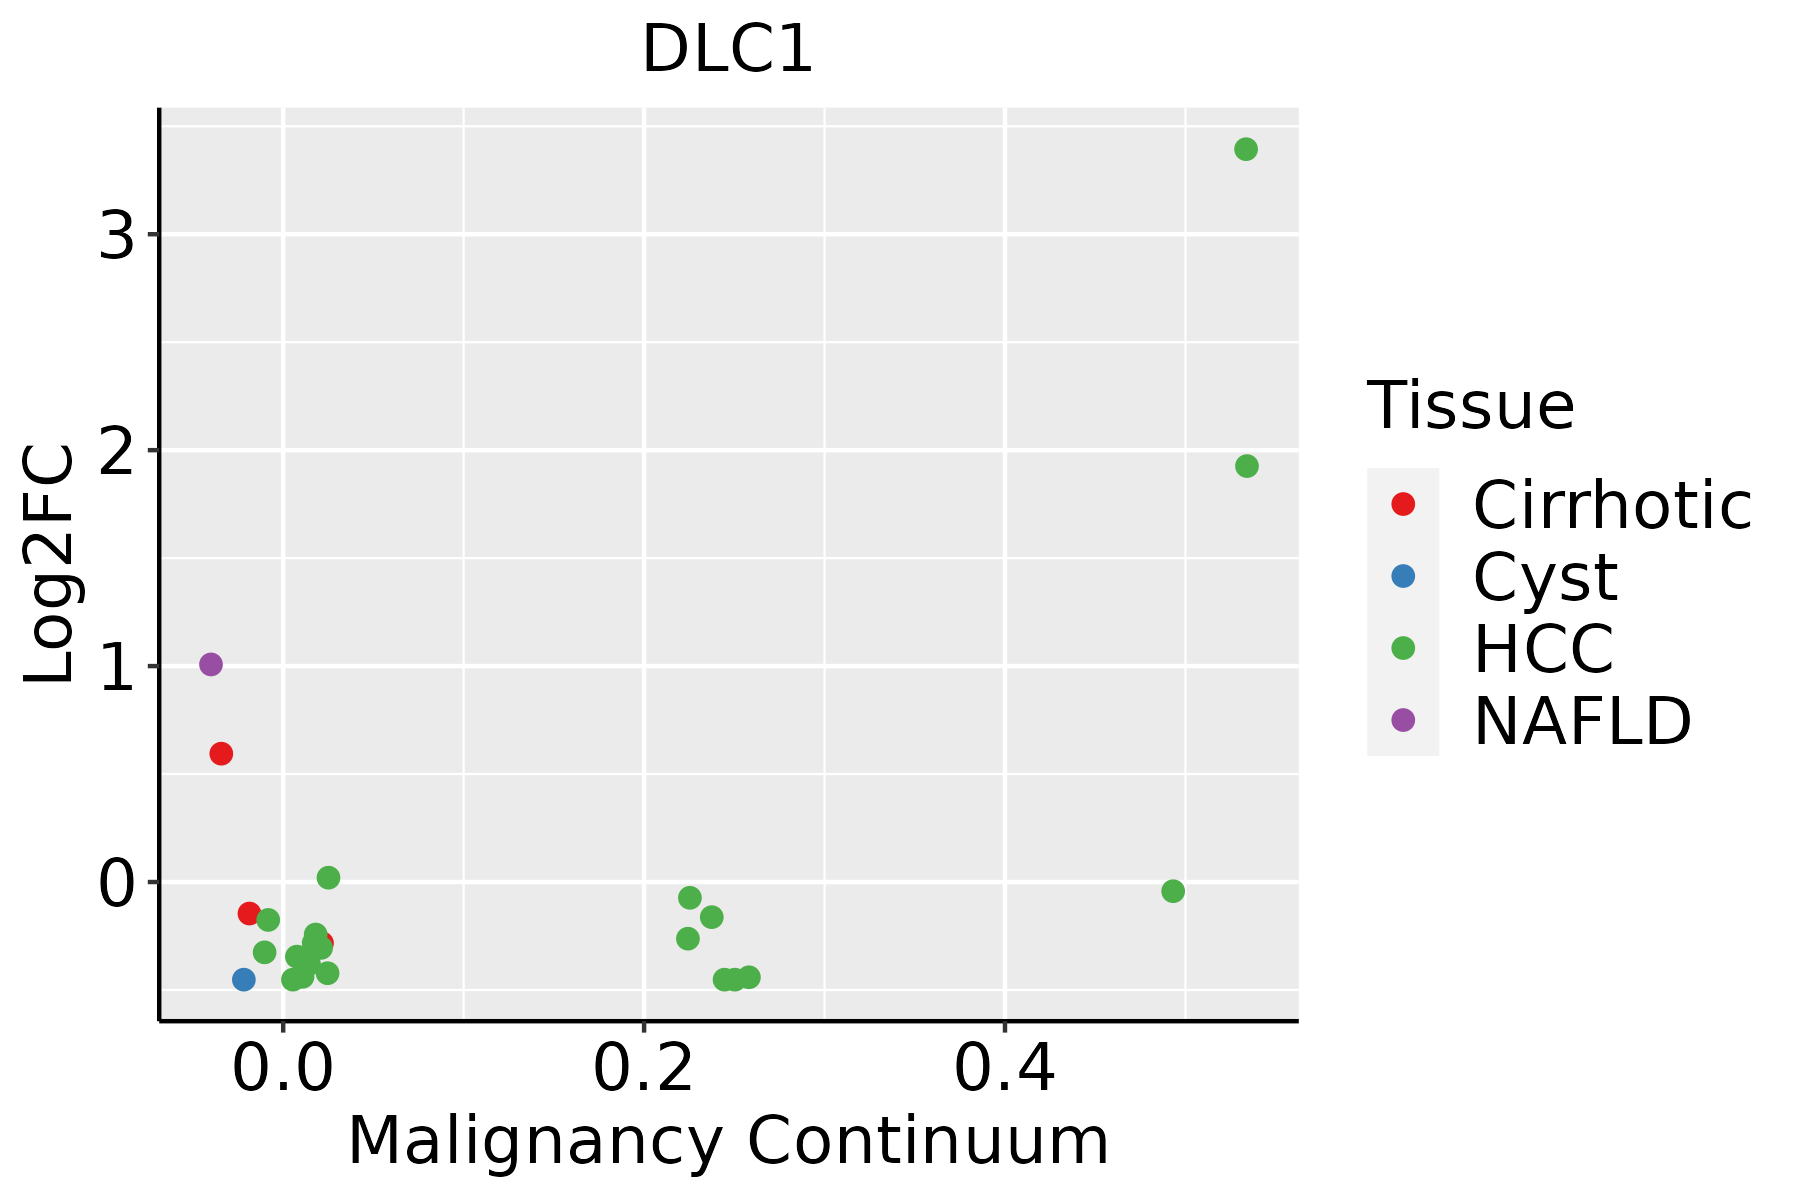 | HCC: Hepatocellular carcinoma |
| NAFLD: Non-alcoholic fatty liver disease | ||
| Lung | 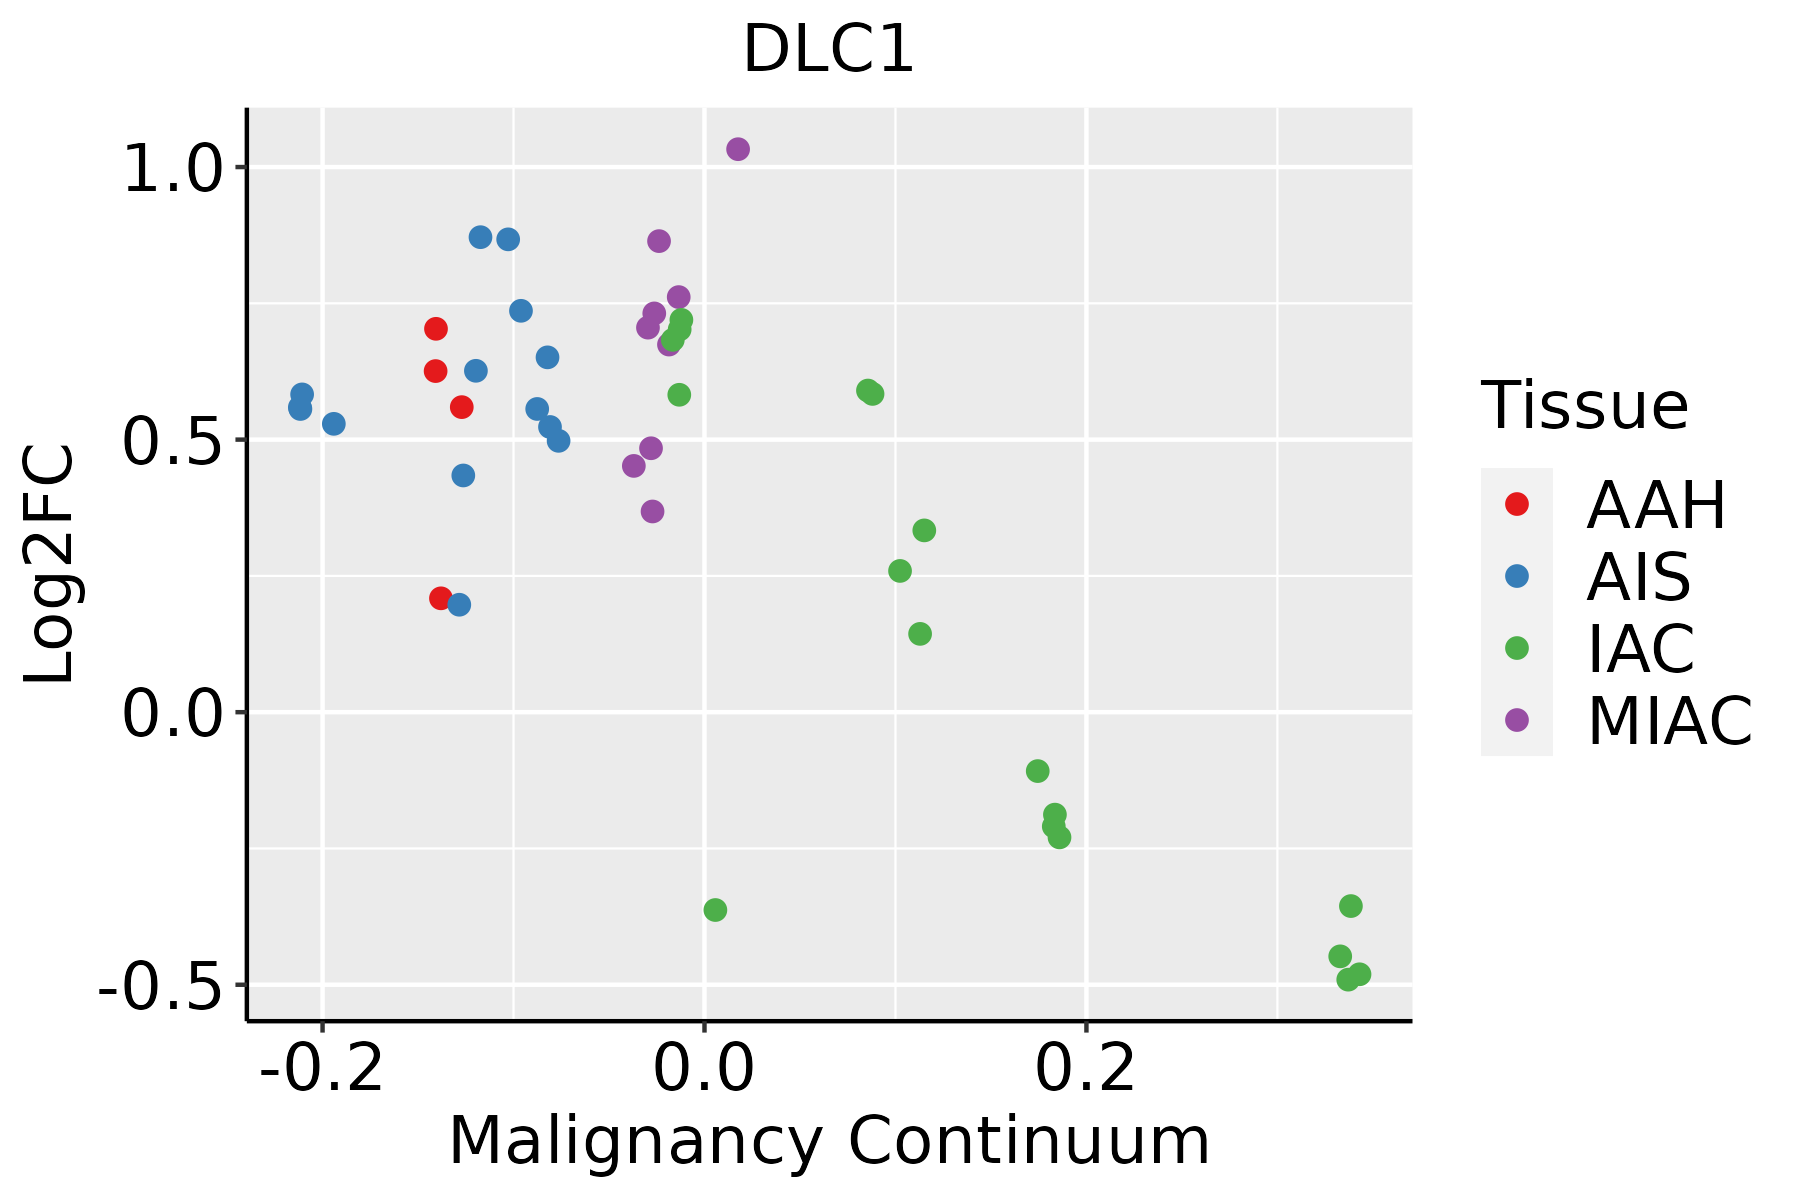 | AAH: Atypical adenomatous hyperplasia |
| AIS: Adenocarcinoma in situ | ||
| IAC: Invasive lung adenocarcinoma | ||
| MIA: Minimally invasive adenocarcinoma | ||
| Oral Cavity |  | EOLP: Erosive Oral lichen planus |
| LP: leukoplakia | ||
| NEOLP: Non-erosive oral lichen planus | ||
| OSCC: Oral squamous cell carcinoma | ||
| Thyroid | 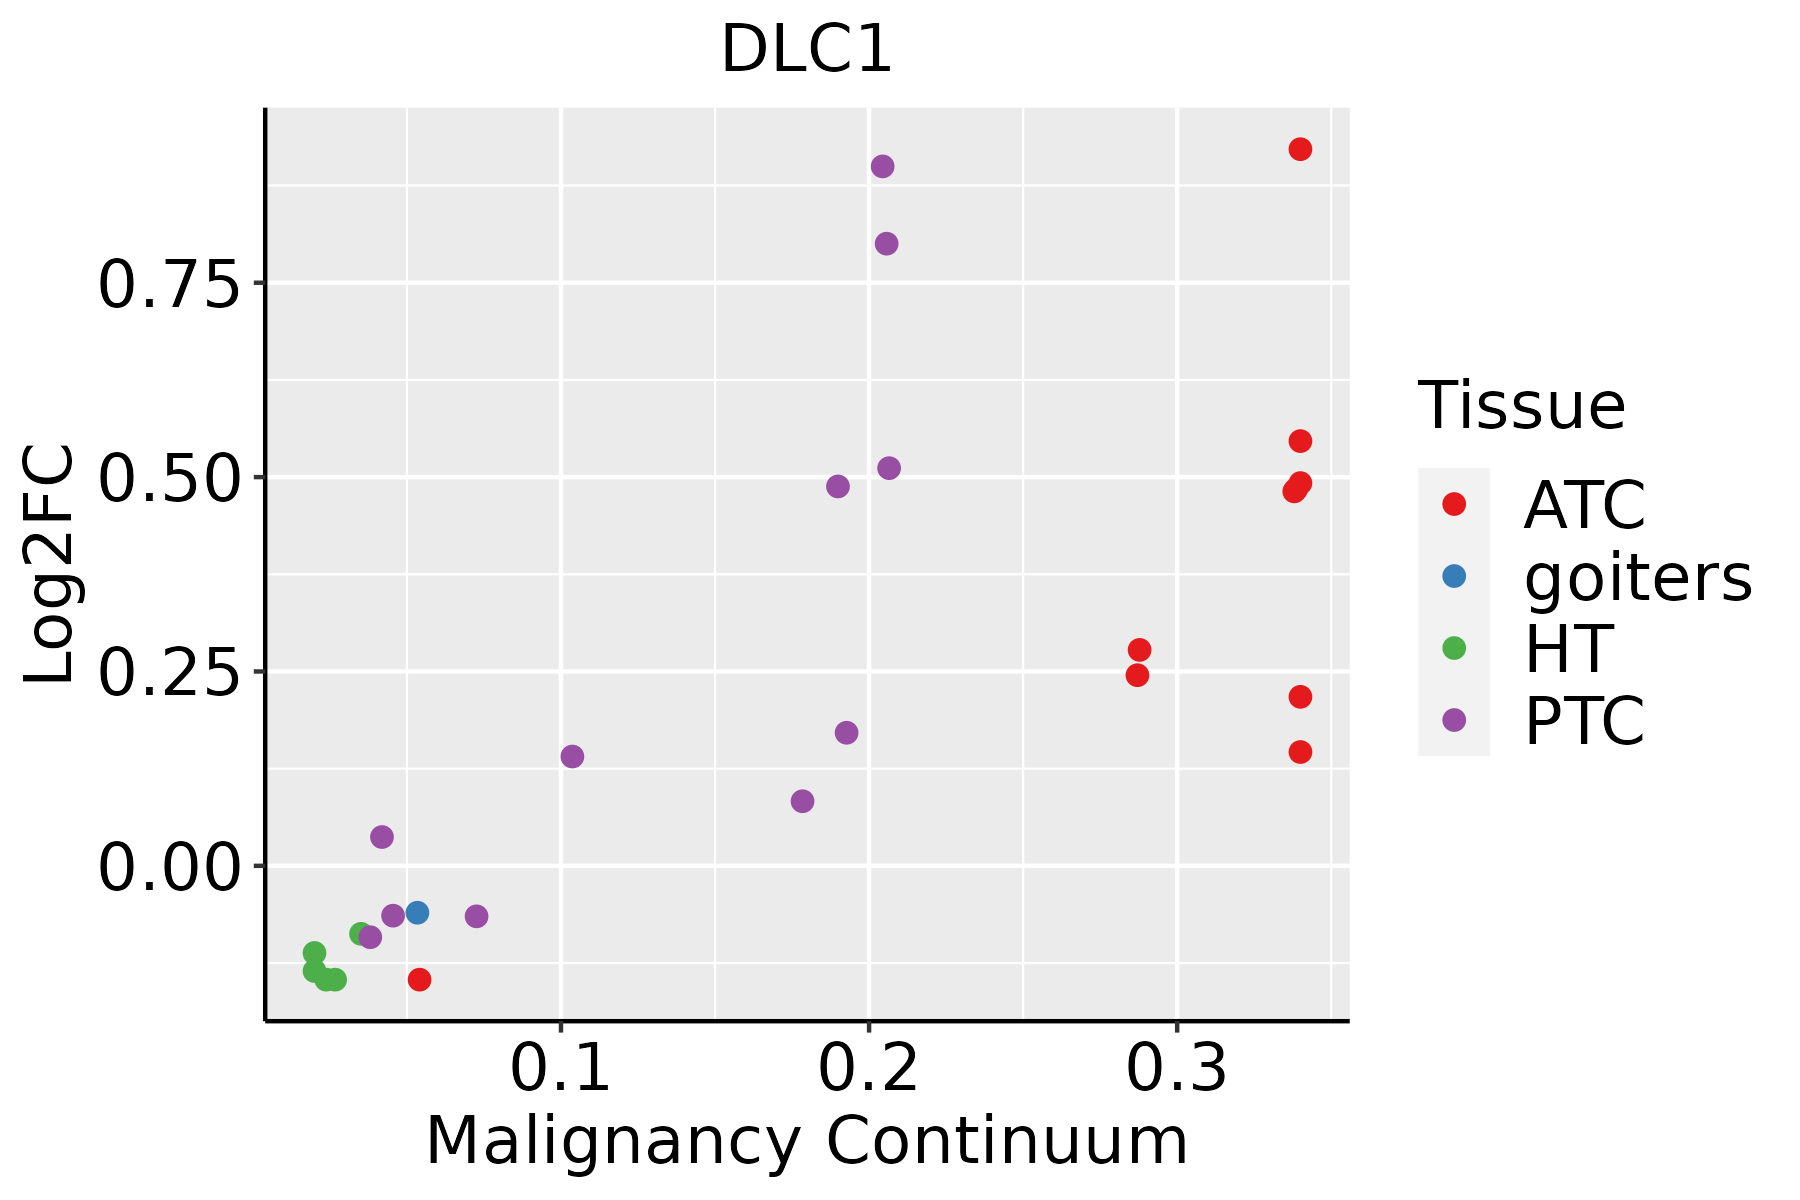 | ATC: Anaplastic thyroid cancer |
| HT: Hashimoto's thyroiditis | ||
| PTC: Papillary thyroid cancer |
| ∗log2FC in expression of this searched gene in stem-like cells from each diseased tissue sample relative to stem-like cells in normal samples in each tissue plotted against the malignancy continuum. Samples are colored based on if they are from different disease stage. |
Top |
Malignant transformation related pathway analysis |
| Find out the enriched GO biological processes and KEGG pathways involved in transition from healthy to precancer to cancer |
| Tissue | Disease Stage | Enriched GO biological Processes |
| Colorectum | AD |  |
| Colorectum | SER |  |
| Colorectum | MSS |  |
| Colorectum | MSI-H |  |
| Colorectum | FAP |  |
| ∗Top 15 enriched GO BP terms are showed in the bar plot of each disease state in each tissue. Each row represents a significant GO biological process which is colored according to the -log10(p.adjust). |
| Page: 1 2 3 4 5 6 7 8 9 |
| GO ID | Tissue | Disease Stage | Description | Gene Ratio | Bg Ratio | pvalue | p.adjust | Count |
| GO:005189322 | Lung | AAH | regulation of focal adhesion assembly | 10/613 | 66/18723 | 5.32e-05 | 5.35e-03 | 10 |
| GO:009010922 | Lung | AAH | regulation of cell-substrate junction assembly | 10/613 | 66/18723 | 5.32e-05 | 5.35e-03 | 10 |
| GO:003432922 | Lung | AAH | cell junction assembly | 30/613 | 420/18723 | 5.80e-05 | 5.52e-03 | 30 |
| GO:005101723 | Lung | AAH | actin filament bundle assembly | 16/613 | 157/18723 | 5.91e-05 | 5.52e-03 | 16 |
| GO:000704423 | Lung | AAH | cell-substrate junction assembly | 12/613 | 95/18723 | 6.24e-05 | 5.72e-03 | 12 |
| GO:190290323 | Lung | AAH | regulation of supramolecular fiber organization | 28/613 | 383/18723 | 6.82e-05 | 6.09e-03 | 28 |
| GO:006157223 | Lung | AAH | actin filament bundle organization | 16/613 | 161/18723 | 7.99e-05 | 6.21e-03 | 16 |
| GO:000716022 | Lung | AAH | cell-matrix adhesion | 20/613 | 233/18723 | 8.74e-05 | 6.57e-03 | 20 |
| GO:015011623 | Lung | AAH | regulation of cell-substrate junction organization | 10/613 | 71/18723 | 1.00e-04 | 7.08e-03 | 10 |
| GO:015011523 | Lung | AAH | cell-substrate junction organization | 12/613 | 101/18723 | 1.14e-04 | 7.56e-03 | 12 |
| GO:190188821 | Lung | AAH | regulation of cell junction assembly | 18/613 | 204/18723 | 1.37e-04 | 8.75e-03 | 18 |
| GO:003158923 | Lung | AAH | cell-substrate adhesion | 26/613 | 363/18723 | 1.70e-04 | 1.03e-02 | 26 |
| GO:003003823 | Lung | AAH | contractile actin filament bundle assembly | 12/613 | 106/18723 | 1.81e-04 | 1.05e-02 | 12 |
| GO:004314923 | Lung | AAH | stress fiber assembly | 12/613 | 106/18723 | 1.81e-04 | 1.05e-02 | 12 |
| GO:000195222 | Lung | AAH | regulation of cell-matrix adhesion | 13/613 | 128/18723 | 2.95e-04 | 1.45e-02 | 13 |
| GO:003297023 | Lung | AAH | regulation of actin filament-based process | 27/613 | 397/18723 | 2.96e-04 | 1.45e-02 | 27 |
| GO:003295623 | Lung | AAH | regulation of actin cytoskeleton organization | 25/613 | 358/18723 | 3.31e-04 | 1.55e-02 | 25 |
| GO:001081023 | Lung | AAH | regulation of cell-substrate adhesion | 18/613 | 221/18723 | 3.70e-04 | 1.69e-02 | 18 |
| GO:190290422 | Lung | AAH | negative regulation of supramolecular fiber organization | 15/613 | 167/18723 | 4.01e-04 | 1.78e-02 | 15 |
| GO:000647022 | Lung | AAH | protein dephosphorylation | 21/613 | 281/18723 | 4.01e-04 | 1.78e-02 | 21 |
| Page: 1 2 3 4 5 6 7 8 9 10 11 12 13 14 15 16 17 18 19 20 21 22 23 24 25 26 27 28 29 30 31 32 33 34 35 36 |
| Pathway ID | Tissue | Disease Stage | Description | Gene Ratio | Bg Ratio | pvalue | p.adjust | qvalue | Count |
| Page: 1 |
Top |
Cell-cell communication analysis |
| Identification of potential cell-cell interactions between two cell types and their ligand-receptor pairs for different disease states |
| Ligand | Receptor | LRpair | Pathway | Tissue | Disease Stage |
| Page: 1 |
Top |
Single-cell gene regulatory network inference analysis |
| Find out the significant the regulons (TFs) and the target genes of each regulon across cell types for different disease states |
| TF | Cell Type | Tissue | Disease Stage | Target Gene | RSS | Regulon Activity |
| ∗The dot plots of a searched regulon are shown for all cell subpopulations in each disease state of each tissue based on the regulon specific score inferred using pySCENIC and by calculating the average expression. |
| Page: 1 |
Top |
Somatic mutation of malignant transformation related genes |
| Annotation of somatic variants for genes involved in malignant transformation |
| Hugo Symbol | Variant Class | Variant Classification | dbSNP RS | HGVSc | HGVSp | HGVSp Short | SWISSPROT | BIOTYPE | SIFT | PolyPhen | Tumor Sample Barcode | Tissue | Histology | Sex | Age | Stage | Therapy Types | Drugs | Outcome |
| DLC1 | SNV | Missense_Mutation | c.2960N>C | p.Gly987Ala | p.G987A | Q96QB1 | protein_coding | deleterious(0) | possibly_damaging(0.449) | TCGA-A2-A0D0-01 | Breast | breast invasive carcinoma | Female | <65 | I/II | Chemotherapy | cytoxan | SD | |
| DLC1 | SNV | Missense_Mutation | rs773001160 | c.1724G>A | p.Gly575Asp | p.G575D | Q96QB1 | protein_coding | deleterious(0.04) | benign(0.018) | TCGA-A8-A092-01 | Breast | breast invasive carcinoma | Female | <65 | III/IV | Chemotherapy | paclitaxel | CR |
| DLC1 | SNV | Missense_Mutation | rs762750959 | c.1723G>A | p.Gly575Ser | p.G575S | Q96QB1 | protein_coding | tolerated(0.28) | benign(0) | TCGA-A8-A092-01 | Breast | breast invasive carcinoma | Female | <65 | III/IV | Chemotherapy | paclitaxel | CR |
| DLC1 | SNV | Missense_Mutation | c.2533N>A | p.Gly845Ser | p.G845S | Q96QB1 | protein_coding | tolerated(0.11) | probably_damaging(1) | TCGA-A8-A09Z-01 | Breast | breast invasive carcinoma | Female | >=65 | I/II | Unknown | Unknown | SD | |
| DLC1 | SNV | Missense_Mutation | novel | c.4058N>G | p.Glu1353Gly | p.E1353G | Q96QB1 | protein_coding | deleterious(0) | benign(0.41) | TCGA-AN-A046-01 | Breast | breast invasive carcinoma | Female | >=65 | I/II | Unknown | Unknown | SD |
| DLC1 | SNV | Missense_Mutation | c.3983N>T | p.Cys1328Phe | p.C1328F | Q96QB1 | protein_coding | tolerated(0.15) | possibly_damaging(0.803) | TCGA-AO-A03V-01 | Breast | breast invasive carcinoma | Female | <65 | I/II | Chemotherapy | fluorouracil | SD | |
| DLC1 | SNV | Missense_Mutation | c.305C>A | p.Ala102Asp | p.A102D | Q96QB1 | protein_coding | deleterious_low_confidence(0) | possibly_damaging(0.905) | TCGA-AO-A124-01 | Breast | breast invasive carcinoma | Female | <65 | I/II | Chemotherapy | doxorubicin | SD | |
| DLC1 | SNV | Missense_Mutation | c.3205N>C | p.Asp1069His | p.D1069H | Q96QB1 | protein_coding | deleterious(0) | benign(0.354) | TCGA-C8-A26Y-01 | Breast | breast invasive carcinoma | Female | >=65 | I/II | Unknown | Unknown | SD | |
| DLC1 | SNV | Missense_Mutation | c.2882N>A | p.Pro961His | p.P961H | Q96QB1 | protein_coding | deleterious(0.02) | possibly_damaging(0.525) | TCGA-D8-A1JF-01 | Breast | breast invasive carcinoma | Female | >=65 | III/IV | Unknown | Unknown | SD | |
| DLC1 | SNV | Missense_Mutation | rs745492706 | c.878N>A | p.Gly293Asp | p.G293D | Q96QB1 | protein_coding | tolerated_low_confidence(0.35) | benign(0.001) | TCGA-D8-A1XF-01 | Breast | breast invasive carcinoma | Female | <65 | I/II | Chemotherapy | adriamycin+cyclophosphamide | SD |
| Page: 1 2 3 4 5 6 7 8 9 10 11 12 13 14 15 16 17 18 19 20 21 22 23 24 25 26 |
Top |
Related drugs of malignant transformation related genes |
| Identification of chemicals and drugs interact with genes involved in malignant transfromation |
| (DGIdb 4.0) |
| Entrez ID | Symbol | Category | Interaction Types | Drug Claim Name | Drug Name | PMIDs |
| Page: 1 |

Copyright 2023-Present -The University of Texas Health Science Center at Houston |