
|
|||||
|
 | |
| |
| |
| |
| |
| |
|
Gene: DIS3L |
Gene summary for DIS3L |
| Gene information | Species | Human | Gene symbol | DIS3L | Gene ID | 115752 |
| Gene name | DIS3 like exosome 3'-5' exoribonuclease | |
| Gene Alias | DIS3L1 | |
| Cytomap | 15q22.31 | |
| Gene Type | protein-coding | GO ID | GO:0006139 | UniProtAcc | Q8TF46 |
Top |
Malignant transformation analysis |
| Identification of the aberrant gene expression in precancerous and cancerous lesions by comparing the gene expression of stem-like cells in diseased tissues with normal stem cells |
| Entrez ID | Symbol | Replicates | Species | Organ | Tissue | Adj P-value | Log2FC | Malignancy |
| 115752 | DIS3L | LZE4T | Human | Esophagus | ESCC | 3.39e-06 | 2.90e-01 | 0.0811 |
| 115752 | DIS3L | LZE7T | Human | Esophagus | ESCC | 2.42e-03 | 3.33e-01 | 0.0667 |
| 115752 | DIS3L | LZE8T | Human | Esophagus | ESCC | 2.12e-02 | 1.49e-01 | 0.067 |
| 115752 | DIS3L | P1T-E | Human | Esophagus | ESCC | 4.74e-05 | 3.12e-01 | 0.0875 |
| 115752 | DIS3L | P2T-E | Human | Esophagus | ESCC | 1.23e-19 | 3.13e-01 | 0.1177 |
| 115752 | DIS3L | P4T-E | Human | Esophagus | ESCC | 2.63e-06 | 2.30e-01 | 0.1323 |
| 115752 | DIS3L | P5T-E | Human | Esophagus | ESCC | 2.12e-04 | 9.85e-02 | 0.1327 |
| 115752 | DIS3L | P8T-E | Human | Esophagus | ESCC | 3.20e-15 | 2.93e-01 | 0.0889 |
| 115752 | DIS3L | P9T-E | Human | Esophagus | ESCC | 2.63e-07 | 1.64e-01 | 0.1131 |
| 115752 | DIS3L | P10T-E | Human | Esophagus | ESCC | 8.08e-18 | 3.03e-01 | 0.116 |
| 115752 | DIS3L | P11T-E | Human | Esophagus | ESCC | 5.51e-06 | 3.31e-01 | 0.1426 |
| 115752 | DIS3L | P12T-E | Human | Esophagus | ESCC | 2.89e-14 | 3.15e-01 | 0.1122 |
| 115752 | DIS3L | P15T-E | Human | Esophagus | ESCC | 3.30e-13 | 3.72e-01 | 0.1149 |
| 115752 | DIS3L | P16T-E | Human | Esophagus | ESCC | 1.04e-23 | 4.10e-01 | 0.1153 |
| 115752 | DIS3L | P20T-E | Human | Esophagus | ESCC | 1.26e-08 | 2.84e-01 | 0.1124 |
| 115752 | DIS3L | P21T-E | Human | Esophagus | ESCC | 2.59e-07 | 1.48e-01 | 0.1617 |
| 115752 | DIS3L | P22T-E | Human | Esophagus | ESCC | 8.36e-11 | 2.42e-01 | 0.1236 |
| 115752 | DIS3L | P23T-E | Human | Esophagus | ESCC | 6.71e-10 | 2.92e-01 | 0.108 |
| 115752 | DIS3L | P24T-E | Human | Esophagus | ESCC | 4.67e-06 | 1.44e-01 | 0.1287 |
| 115752 | DIS3L | P26T-E | Human | Esophagus | ESCC | 3.44e-10 | 2.29e-01 | 0.1276 |
| Page: 1 2 3 4 |
| Tissue | Expression Dynamics | Abbreviation |
| Esophagus | 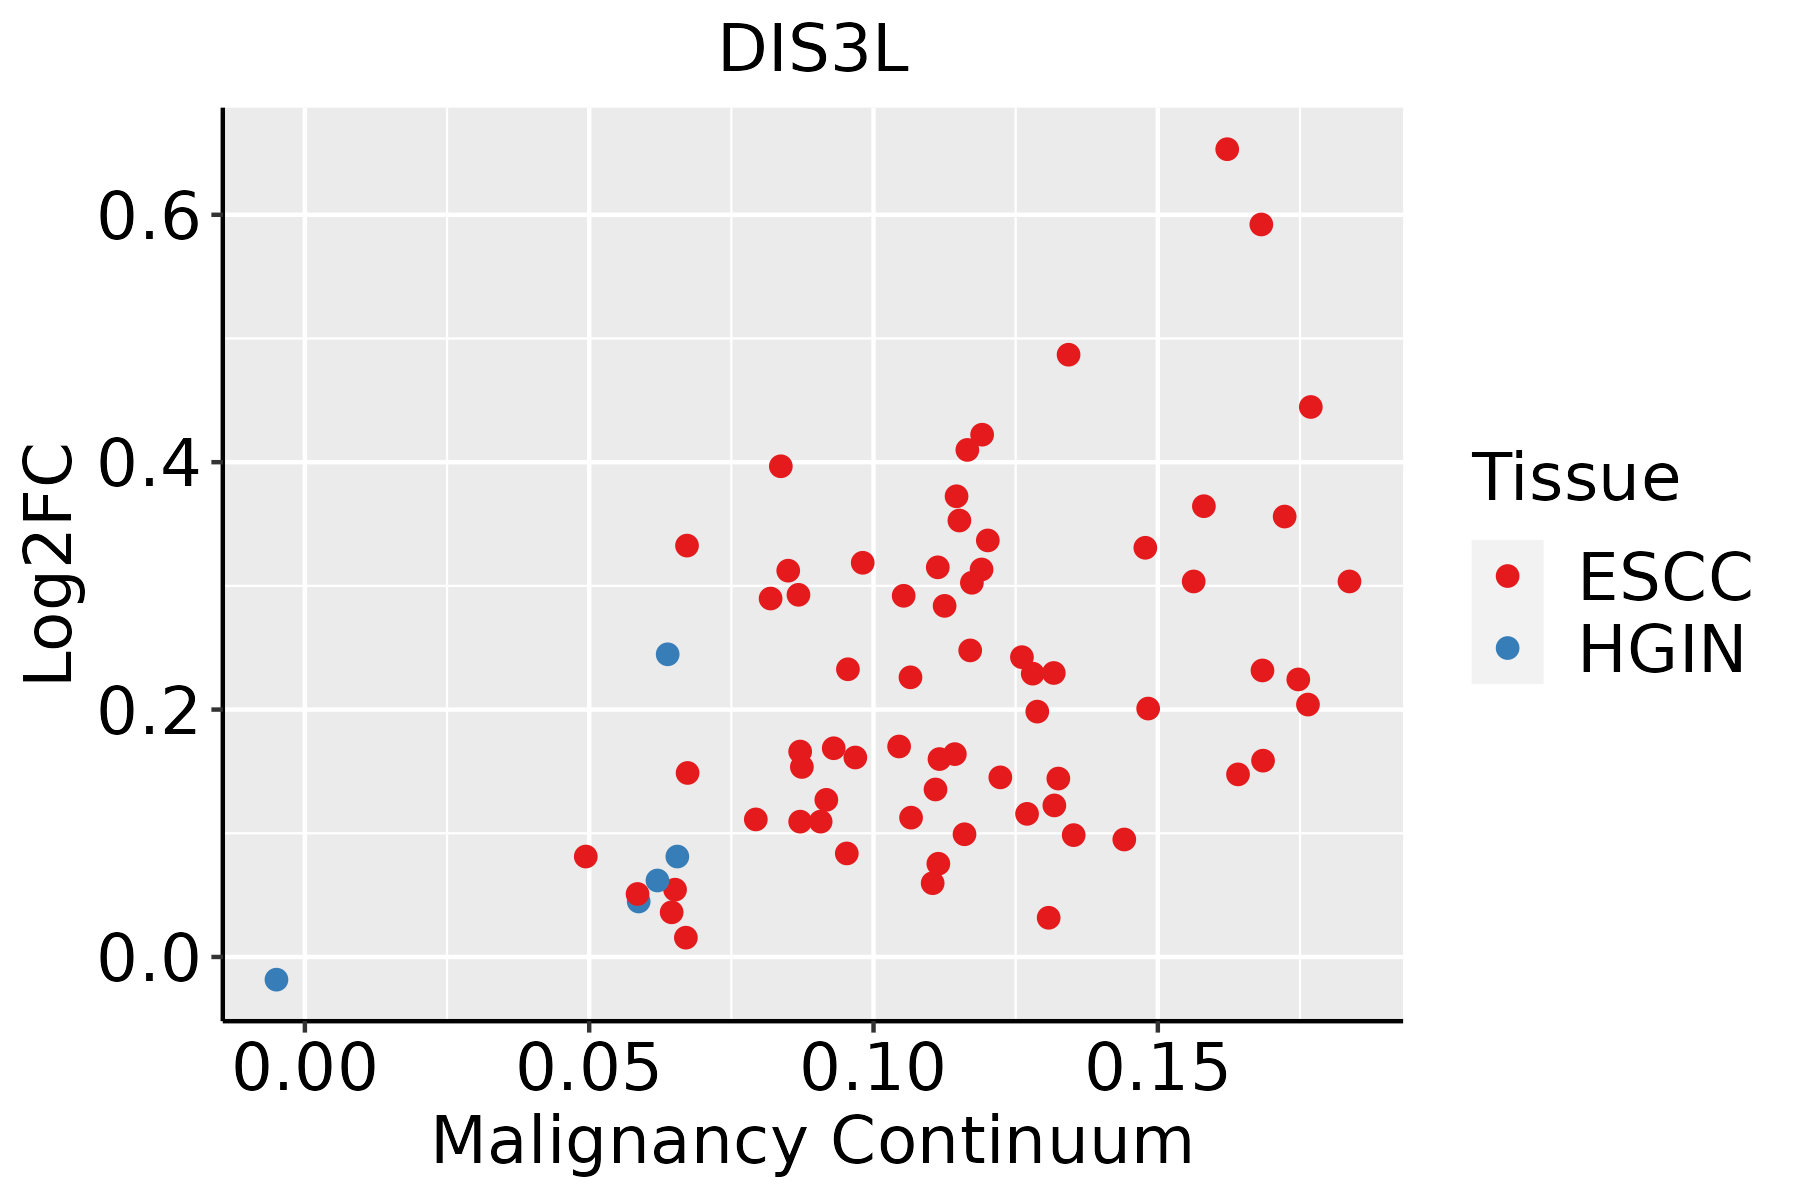 | ESCC: Esophageal squamous cell carcinoma |
| HGIN: High-grade intraepithelial neoplasias | ||
| LGIN: Low-grade intraepithelial neoplasias | ||
| Liver |  | HCC: Hepatocellular carcinoma |
| NAFLD: Non-alcoholic fatty liver disease | ||
| Thyroid | 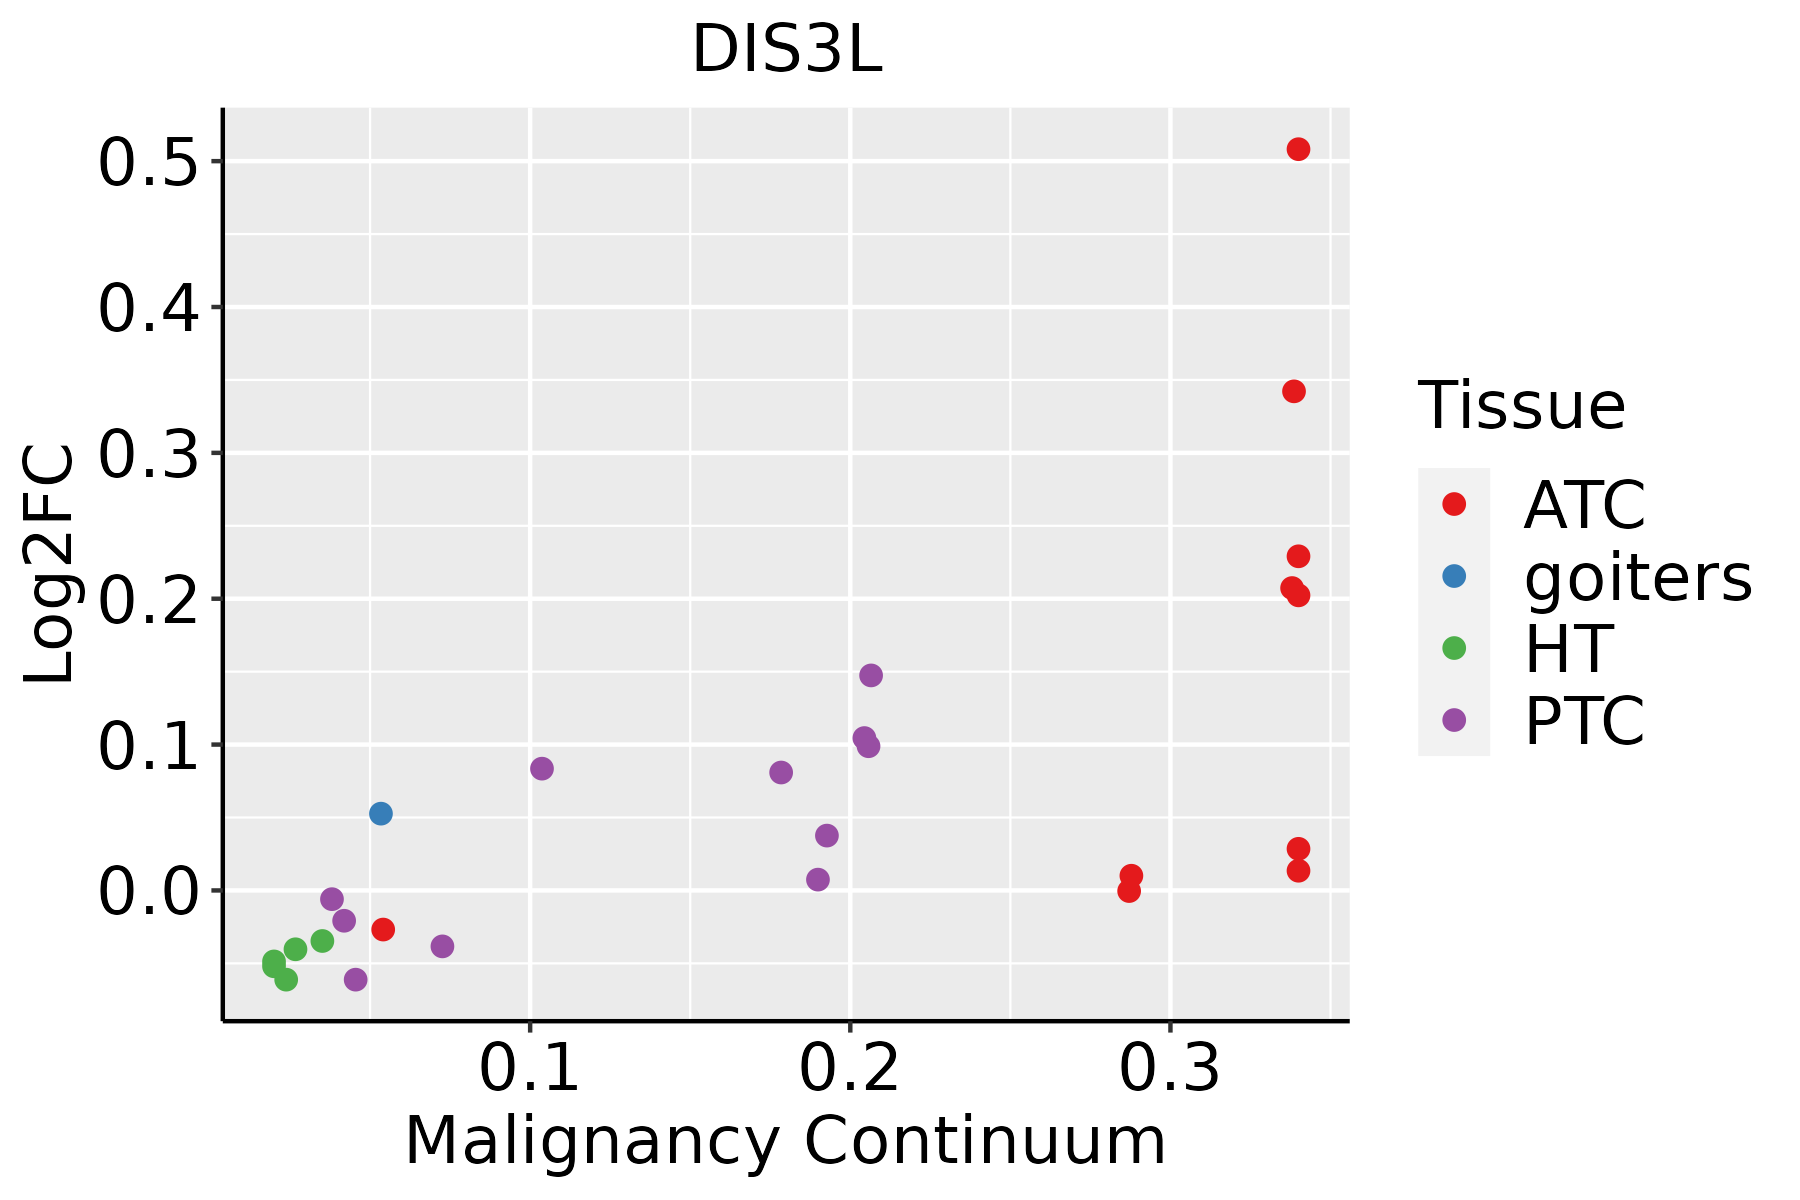 | ATC: Anaplastic thyroid cancer |
| HT: Hashimoto's thyroiditis | ||
| PTC: Papillary thyroid cancer |
| ∗log2FC in expression of this searched gene in stem-like cells from each diseased tissue sample relative to stem-like cells in normal samples in each tissue plotted against the malignancy continuum. Samples are colored based on if they are from different disease stage. |
Top |
Malignant transformation related pathway analysis |
| Find out the enriched GO biological processes and KEGG pathways involved in transition from healthy to precancer to cancer |
| Tissue | Disease Stage | Enriched GO biological Processes |
| Colorectum | AD |  |
| Colorectum | SER |  |
| Colorectum | MSS |  |
| Colorectum | MSI-H |  |
| Colorectum | FAP |  |
| ∗Top 15 enriched GO BP terms are showed in the bar plot of each disease state in each tissue. Each row represents a significant GO biological process which is colored according to the -log10(p.adjust). |
| Page: 1 2 3 4 5 6 7 8 9 |
| GO ID | Tissue | Disease Stage | Description | Gene Ratio | Bg Ratio | pvalue | p.adjust | Count |
| GO:000028011 | Thyroid | ATC | nuclear division | 207/6293 | 439/18723 | 1.98e-09 | 4.80e-08 | 207 |
| GO:0061157110 | Thyroid | ATC | mRNA destabilization | 52/6293 | 84/18723 | 1.01e-07 | 1.70e-06 | 52 |
| GO:0061014110 | Thyroid | ATC | positive regulation of mRNA catabolic process | 53/6293 | 87/18723 | 1.63e-07 | 2.61e-06 | 53 |
| GO:0050779110 | Thyroid | ATC | RNA destabilization | 53/6293 | 88/18723 | 2.75e-07 | 4.20e-06 | 53 |
| GO:000029112 | Thyroid | ATC | nuclear-transcribed mRNA catabolic process, exonucleolytic | 17/6293 | 19/18723 | 7.02e-07 | 9.42e-06 | 17 |
| GO:00513044 | Thyroid | ATC | chromosome separation | 55/6293 | 96/18723 | 1.58e-06 | 1.93e-05 | 55 |
| GO:009872722 | Thyroid | ATC | maintenance of cell number | 70/6293 | 134/18723 | 6.45e-06 | 6.69e-05 | 70 |
| GO:009050112 | Thyroid | ATC | RNA phosphodiester bond hydrolysis | 76/6293 | 152/18723 | 2.07e-05 | 1.86e-04 | 76 |
| GO:001982722 | Thyroid | ATC | stem cell population maintenance | 67/6293 | 131/18723 | 2.48e-05 | 2.16e-04 | 67 |
| GO:009050312 | Thyroid | ATC | RNA phosphodiester bond hydrolysis, exonucleolytic | 27/6293 | 42/18723 | 4.62e-05 | 3.70e-04 | 27 |
| GO:003466111 | Thyroid | ATC | ncRNA catabolic process | 27/6293 | 43/18723 | 8.44e-05 | 6.30e-04 | 27 |
| GO:001058615 | Thyroid | ATC | miRNA metabolic process | 19/6293 | 27/18723 | 1.04e-04 | 7.48e-04 | 19 |
| GO:003424923 | Thyroid | ATC | negative regulation of cellular amide metabolic process | 121/6293 | 273/18723 | 1.36e-04 | 9.57e-04 | 121 |
| GO:001714823 | Thyroid | ATC | negative regulation of translation | 107/6293 | 245/18723 | 6.17e-04 | 3.51e-03 | 107 |
| GO:003442711 | Thyroid | ATC | nuclear-transcribed mRNA catabolic process, exonucleolytic, 3'-5' | 9/6293 | 11/18723 | 1.46e-03 | 7.47e-03 | 9 |
| GO:001607511 | Thyroid | ATC | rRNA catabolic process | 14/6293 | 21/18723 | 1.99e-03 | 9.54e-03 | 14 |
| GO:001058713 | Thyroid | ATC | miRNA catabolic process | 9/6293 | 12/18723 | 4.10e-03 | 1.75e-02 | 9 |
| GO:009030511 | Thyroid | ATC | nucleic acid phosphodiester bond hydrolysis | 107/6293 | 261/18723 | 7.21e-03 | 2.84e-02 | 107 |
| Page: 1 2 3 4 5 6 7 8 9 10 11 12 13 14 15 16 17 18 |
| Pathway ID | Tissue | Disease Stage | Description | Gene Ratio | Bg Ratio | pvalue | p.adjust | qvalue | Count |
| hsa0301824 | Esophagus | ESCC | RNA degradation | 62/4205 | 79/8465 | 1.18e-07 | 9.39e-07 | 4.81e-07 | 62 |
| hsa0301834 | Esophagus | ESCC | RNA degradation | 62/4205 | 79/8465 | 1.18e-07 | 9.39e-07 | 4.81e-07 | 62 |
| hsa030182 | Liver | HCC | RNA degradation | 58/4020 | 79/8465 | 2.29e-06 | 2.19e-05 | 1.22e-05 | 58 |
| hsa030183 | Liver | HCC | RNA degradation | 58/4020 | 79/8465 | 2.29e-06 | 2.19e-05 | 1.22e-05 | 58 |
| Page: 1 |
Top |
Cell-cell communication analysis |
| Identification of potential cell-cell interactions between two cell types and their ligand-receptor pairs for different disease states |
| Ligand | Receptor | LRpair | Pathway | Tissue | Disease Stage |
| Page: 1 |
Top |
Single-cell gene regulatory network inference analysis |
| Find out the significant the regulons (TFs) and the target genes of each regulon across cell types for different disease states |
| TF | Cell Type | Tissue | Disease Stage | Target Gene | RSS | Regulon Activity |
| ∗The dot plots of a searched regulon are shown for all cell subpopulations in each disease state of each tissue based on the regulon specific score inferred using pySCENIC and by calculating the average expression. |
| Page: 1 |
Top |
Somatic mutation of malignant transformation related genes |
| Annotation of somatic variants for genes involved in malignant transformation |
| Hugo Symbol | Variant Class | Variant Classification | dbSNP RS | HGVSc | HGVSp | HGVSp Short | SWISSPROT | BIOTYPE | SIFT | PolyPhen | Tumor Sample Barcode | Tissue | Histology | Sex | Age | Stage | Therapy Types | Drugs | Outcome |
| DIS3L | SNV | Missense_Mutation | c.1301C>T | p.Ser434Leu | p.S434L | Q8TF46 | protein_coding | tolerated(0.58) | benign(0.006) | TCGA-AC-A23H-01 | Breast | breast invasive carcinoma | Female | >=65 | I/II | Unknown | Unknown | PD | |
| DIS3L | SNV | Missense_Mutation | c.181C>G | p.Pro61Ala | p.P61A | Q8TF46 | protein_coding | deleterious(0.01) | probably_damaging(0.941) | TCGA-B6-A0I8-01 | Breast | breast invasive carcinoma | Female | <65 | I/II | Unknown | Unknown | PD | |
| DIS3L | SNV | Missense_Mutation | novel | c.2341N>A | p.Glu781Lys | p.E781K | Q8TF46 | protein_coding | deleterious(0.03) | benign(0.238) | TCGA-D8-A27V-01 | Breast | breast invasive carcinoma | Female | <65 | I/II | Hormone Therapy | tamoxiphen | SD |
| DIS3L | SNV | Missense_Mutation | novel | c.1830C>G | p.Phe610Leu | p.F610L | Q8TF46 | protein_coding | tolerated(1) | benign(0) | TCGA-PL-A8LV-01 | Breast | breast invasive carcinoma | Female | <65 | III/IV | Unknown | Unknown | SD |
| DIS3L | insertion | Frame_Shift_Ins | novel | c.1795_1796insC | p.Gly599AlafsTer7 | p.G599Afs*7 | Q8TF46 | protein_coding | TCGA-A2-A04Y-01 | Breast | breast invasive carcinoma | Female | <65 | I/II | Chemotherapy | cytoxan | SD | ||
| DIS3L | insertion | Frame_Shift_Ins | novel | c.1796_1797insAAATGGGTTAAATTTTCATGTAGTAATATACTATTTTTTA | p.Leu601GlyfsTer18 | p.L601Gfs*18 | Q8TF46 | protein_coding | TCGA-A2-A04Y-01 | Breast | breast invasive carcinoma | Female | <65 | I/II | Chemotherapy | cytoxan | SD | ||
| DIS3L | insertion | Frame_Shift_Ins | novel | c.2103_2104insG | p.His702AlafsTer24 | p.H702Afs*24 | Q8TF46 | protein_coding | TCGA-AN-A046-01 | Breast | breast invasive carcinoma | Female | >=65 | I/II | Unknown | Unknown | SD | ||
| DIS3L | insertion | Nonsense_Mutation | novel | c.2104_2105insGTCTCCCTCTGTTGCTGGCTTTTTAAAGTCAGCTAAA | p.His702ArgfsTer9 | p.H702Rfs*9 | Q8TF46 | protein_coding | TCGA-AN-A046-01 | Breast | breast invasive carcinoma | Female | >=65 | I/II | Unknown | Unknown | SD | ||
| DIS3L | deletion | Frame_Shift_Del | novel | c.2340delN | p.Glu781SerfsTer9 | p.E781Sfs*9 | Q8TF46 | protein_coding | TCGA-D8-A27V-01 | Breast | breast invasive carcinoma | Female | <65 | I/II | Hormone Therapy | tamoxiphen | SD | ||
| DIS3L | SNV | Missense_Mutation | c.1690G>A | p.Glu564Lys | p.E564K | Q8TF46 | protein_coding | deleterious(0.04) | benign(0.307) | TCGA-DR-A0ZM-01 | Cervix | cervical & endocervical cancer | Female | <65 | III/IV | Unspecific | Cisplatin | SD |
| Page: 1 2 3 4 5 6 7 8 9 10 11 |
Top |
Related drugs of malignant transformation related genes |
| Identification of chemicals and drugs interact with genes involved in malignant transfromation |
| (DGIdb 4.0) |
| Entrez ID | Symbol | Category | Interaction Types | Drug Claim Name | Drug Name | PMIDs |
| Page: 1 |

Copyright 2023-Present -The University of Texas Health Science Center at Houston |