
|
|||||
|
 | |
| |
| |
| |
| |
| |
|
Gene: DHX36 |
Gene summary for DHX36 |
| Gene information | Species | Human | Gene symbol | DHX36 | Gene ID | 170506 |
| Gene name | DEAH-box helicase 36 | |
| Gene Alias | DDX36 | |
| Cytomap | 3q25.2 | |
| Gene Type | protein-coding | GO ID | GO:0000003 | UniProtAcc | Q9H2U1 |
Top |
Malignant transformation analysis |
| Identification of the aberrant gene expression in precancerous and cancerous lesions by comparing the gene expression of stem-like cells in diseased tissues with normal stem cells |
| Entrez ID | Symbol | Replicates | Species | Organ | Tissue | Adj P-value | Log2FC | Malignancy |
| 170506 | DHX36 | CA_HPV_1 | Human | Cervix | CC | 4.89e-06 | -9.12e-02 | 0.0264 |
| 170506 | DHX36 | CCI_2 | Human | Cervix | CC | 2.02e-10 | 9.69e-01 | 0.5249 |
| 170506 | DHX36 | CCI_3 | Human | Cervix | CC | 4.22e-03 | 5.61e-01 | 0.516 |
| 170506 | DHX36 | L1 | Human | Cervix | CC | 3.61e-02 | -2.59e-01 | 0.0802 |
| 170506 | DHX36 | LZE2T | Human | Esophagus | ESCC | 1.71e-11 | 1.54e+00 | 0.082 |
| 170506 | DHX36 | LZE3D | Human | Esophagus | HGIN | 1.07e-02 | 3.13e-01 | 0.0668 |
| 170506 | DHX36 | LZE4T | Human | Esophagus | ESCC | 5.44e-29 | 9.90e-01 | 0.0811 |
| 170506 | DHX36 | LZE5T | Human | Esophagus | ESCC | 1.18e-03 | 4.36e-01 | 0.0514 |
| 170506 | DHX36 | LZE7T | Human | Esophagus | ESCC | 1.26e-13 | 9.67e-01 | 0.0667 |
| 170506 | DHX36 | LZE8T | Human | Esophagus | ESCC | 3.23e-14 | 3.61e-01 | 0.067 |
| 170506 | DHX36 | LZE22T | Human | Esophagus | ESCC | 1.82e-05 | 4.13e-01 | 0.068 |
| 170506 | DHX36 | LZE24T | Human | Esophagus | ESCC | 8.51e-30 | 9.52e-01 | 0.0596 |
| 170506 | DHX36 | LZE22D3 | Human | Esophagus | HGIN | 4.37e-02 | 3.42e-01 | 0.0653 |
| 170506 | DHX36 | LZE21T | Human | Esophagus | ESCC | 1.77e-15 | 1.24e+00 | 0.0655 |
| 170506 | DHX36 | P1T-E | Human | Esophagus | ESCC | 4.39e-25 | 1.28e+00 | 0.0875 |
| 170506 | DHX36 | P2T-E | Human | Esophagus | ESCC | 3.41e-107 | 2.18e+00 | 0.1177 |
| 170506 | DHX36 | P4T-E | Human | Esophagus | ESCC | 1.12e-56 | 1.60e+00 | 0.1323 |
| 170506 | DHX36 | P5T-E | Human | Esophagus | ESCC | 4.49e-55 | 1.01e+00 | 0.1327 |
| 170506 | DHX36 | P8T-E | Human | Esophagus | ESCC | 9.12e-79 | 1.35e+00 | 0.0889 |
| 170506 | DHX36 | P9T-E | Human | Esophagus | ESCC | 6.51e-51 | 1.26e+00 | 0.1131 |
| Page: 1 2 3 4 5 6 7 8 9 |
| Tissue | Expression Dynamics | Abbreviation |
| Cervix | 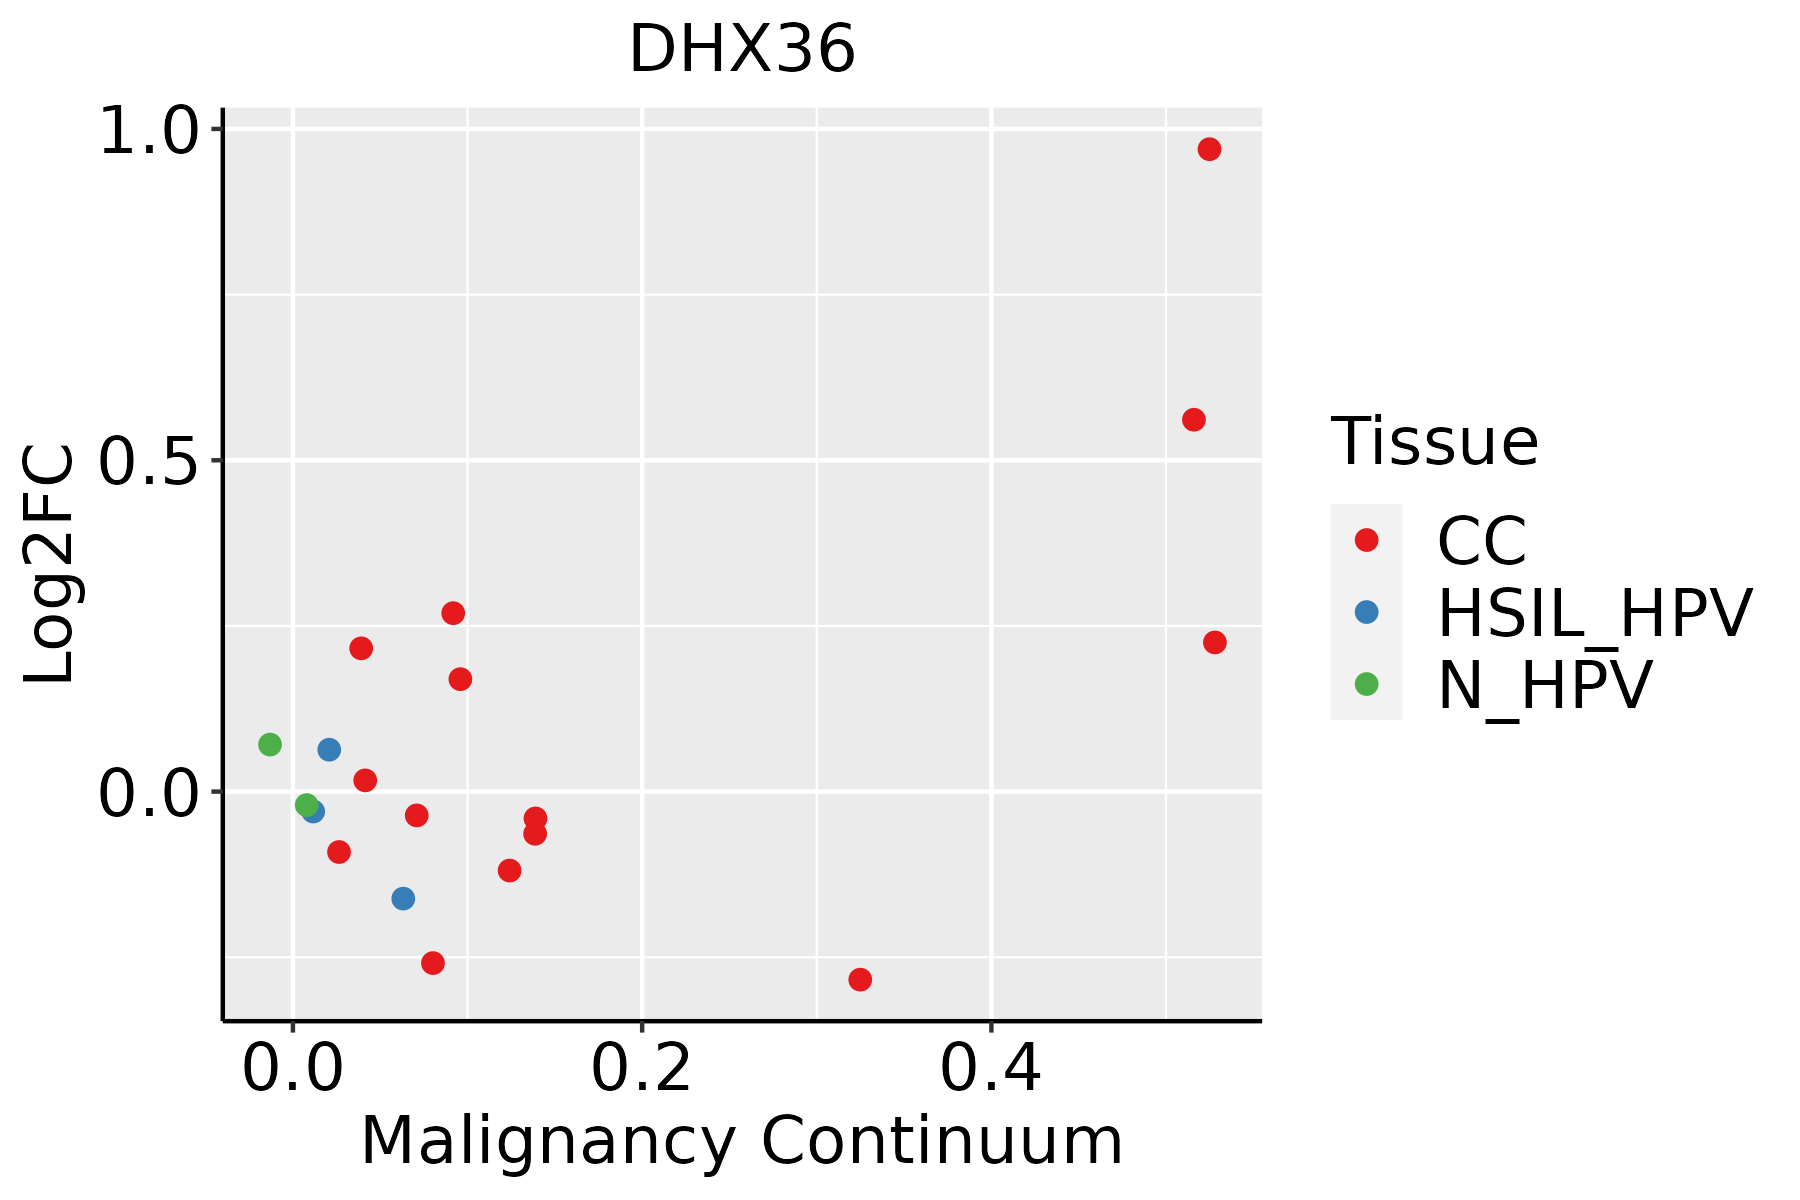 | CC: Cervix cancer |
| HSIL_HPV: HPV-infected high-grade squamous intraepithelial lesions | ||
| N_HPV: HPV-infected normal cervix | ||
| Esophagus | 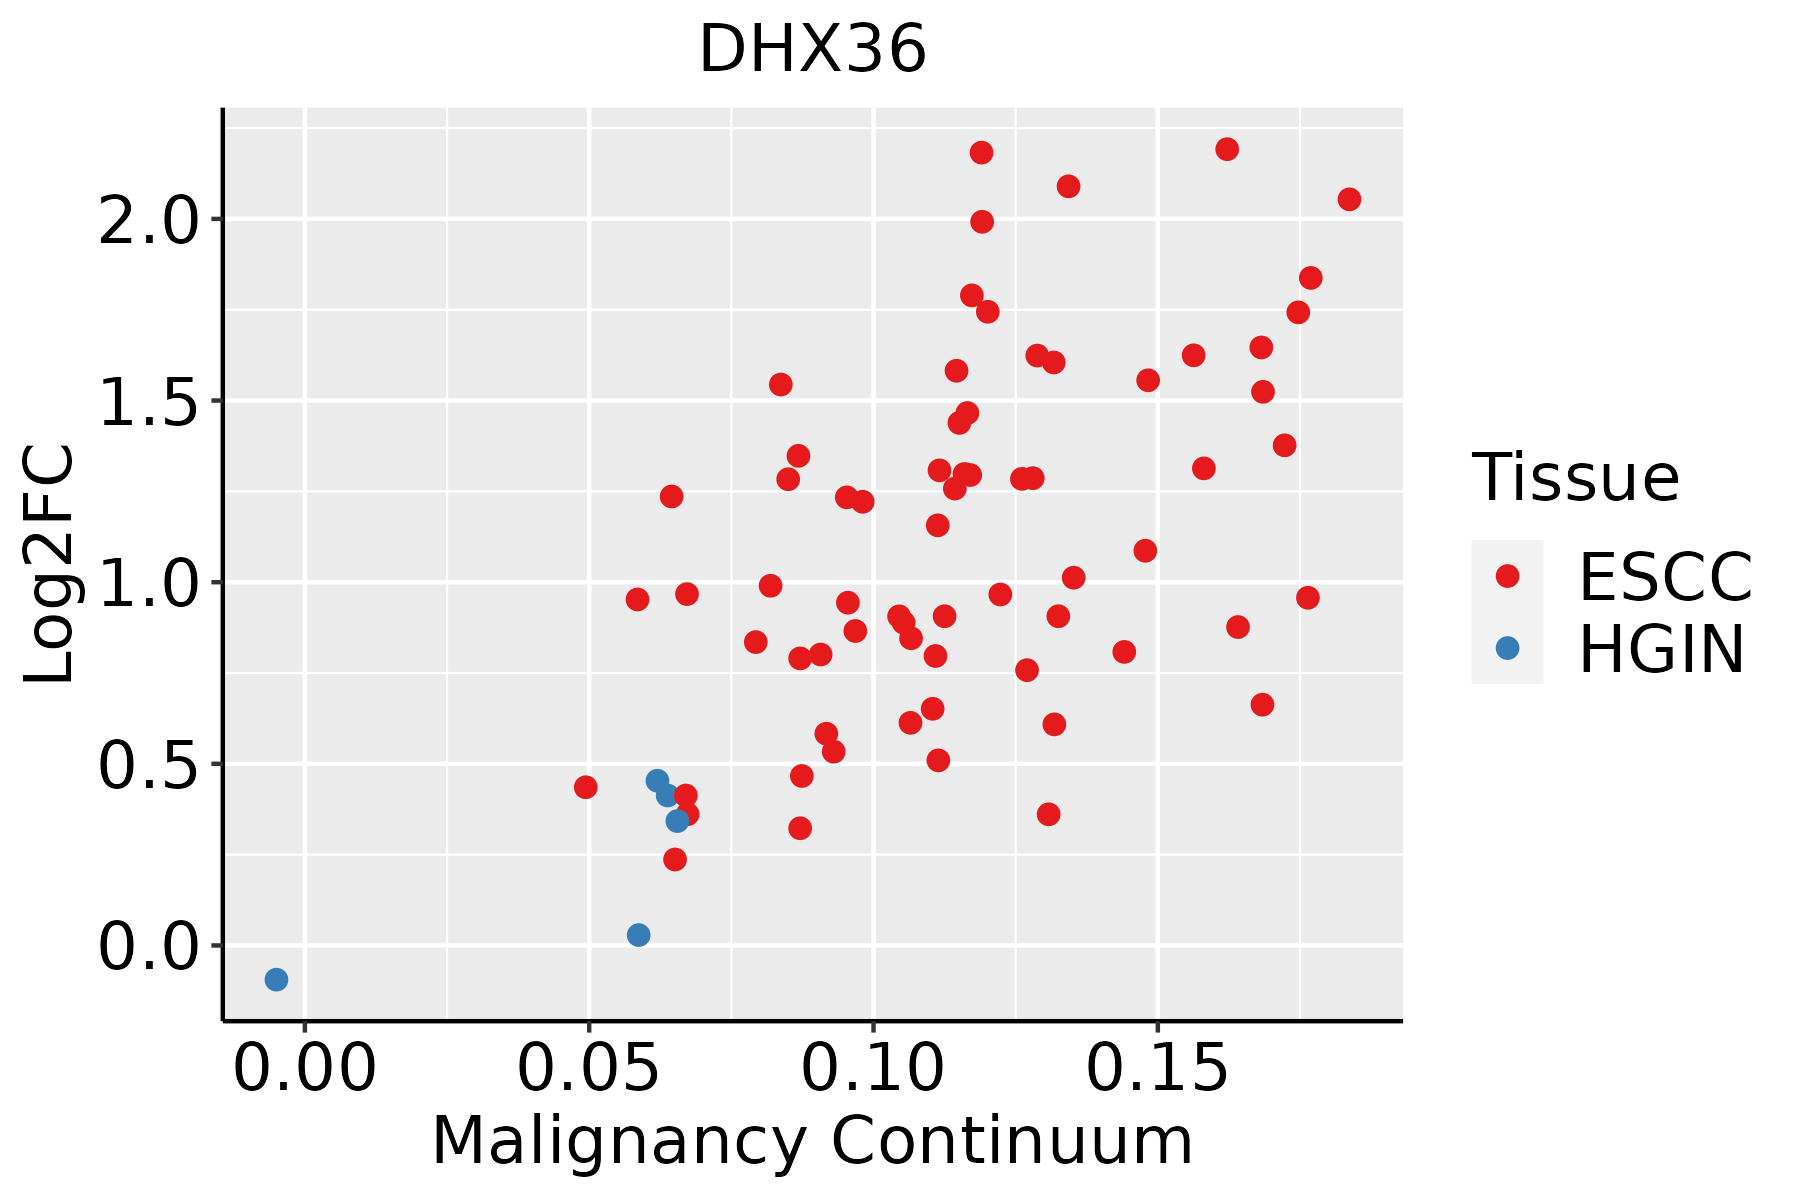 | ESCC: Esophageal squamous cell carcinoma |
| HGIN: High-grade intraepithelial neoplasias | ||
| LGIN: Low-grade intraepithelial neoplasias | ||
| Liver | 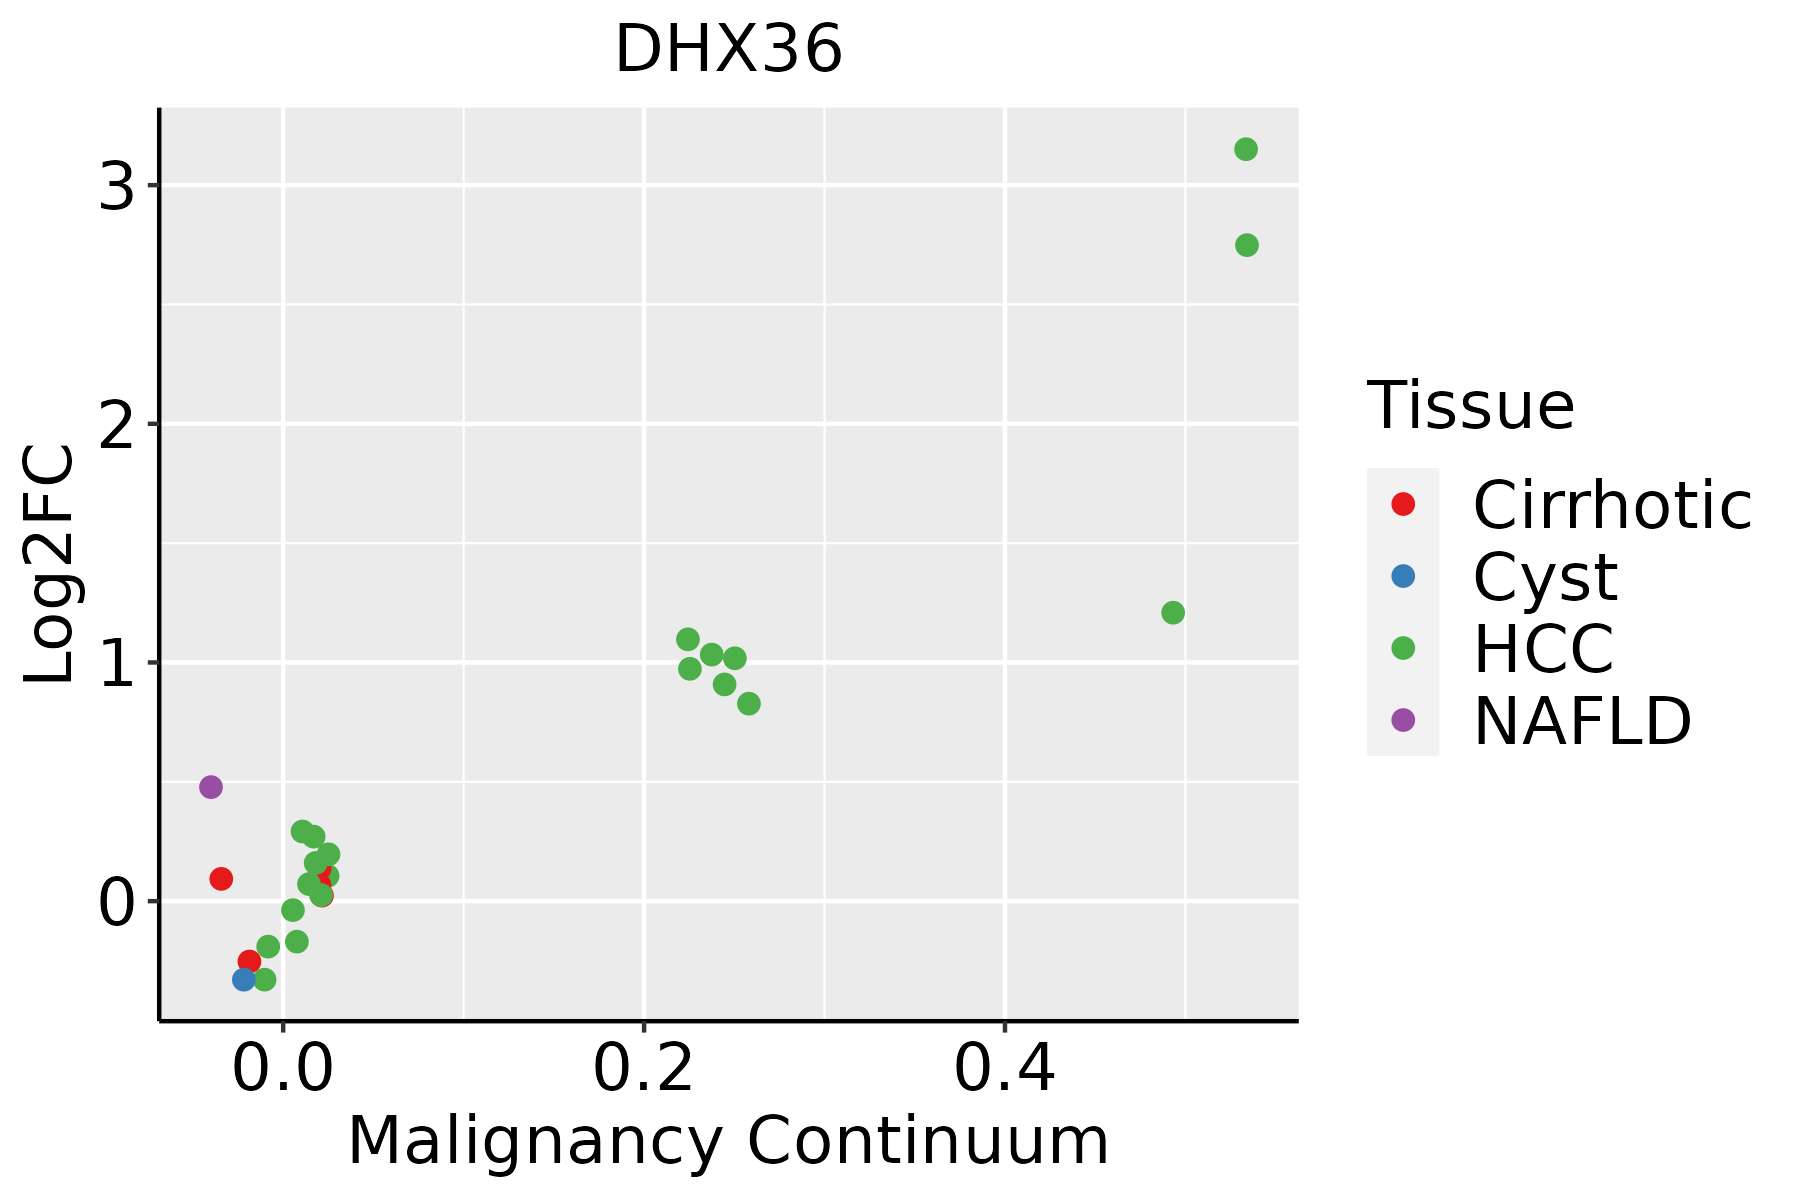 | HCC: Hepatocellular carcinoma |
| NAFLD: Non-alcoholic fatty liver disease | ||
| Lung |  | AAH: Atypical adenomatous hyperplasia |
| AIS: Adenocarcinoma in situ | ||
| IAC: Invasive lung adenocarcinoma | ||
| MIA: Minimally invasive adenocarcinoma | ||
| Oral Cavity | 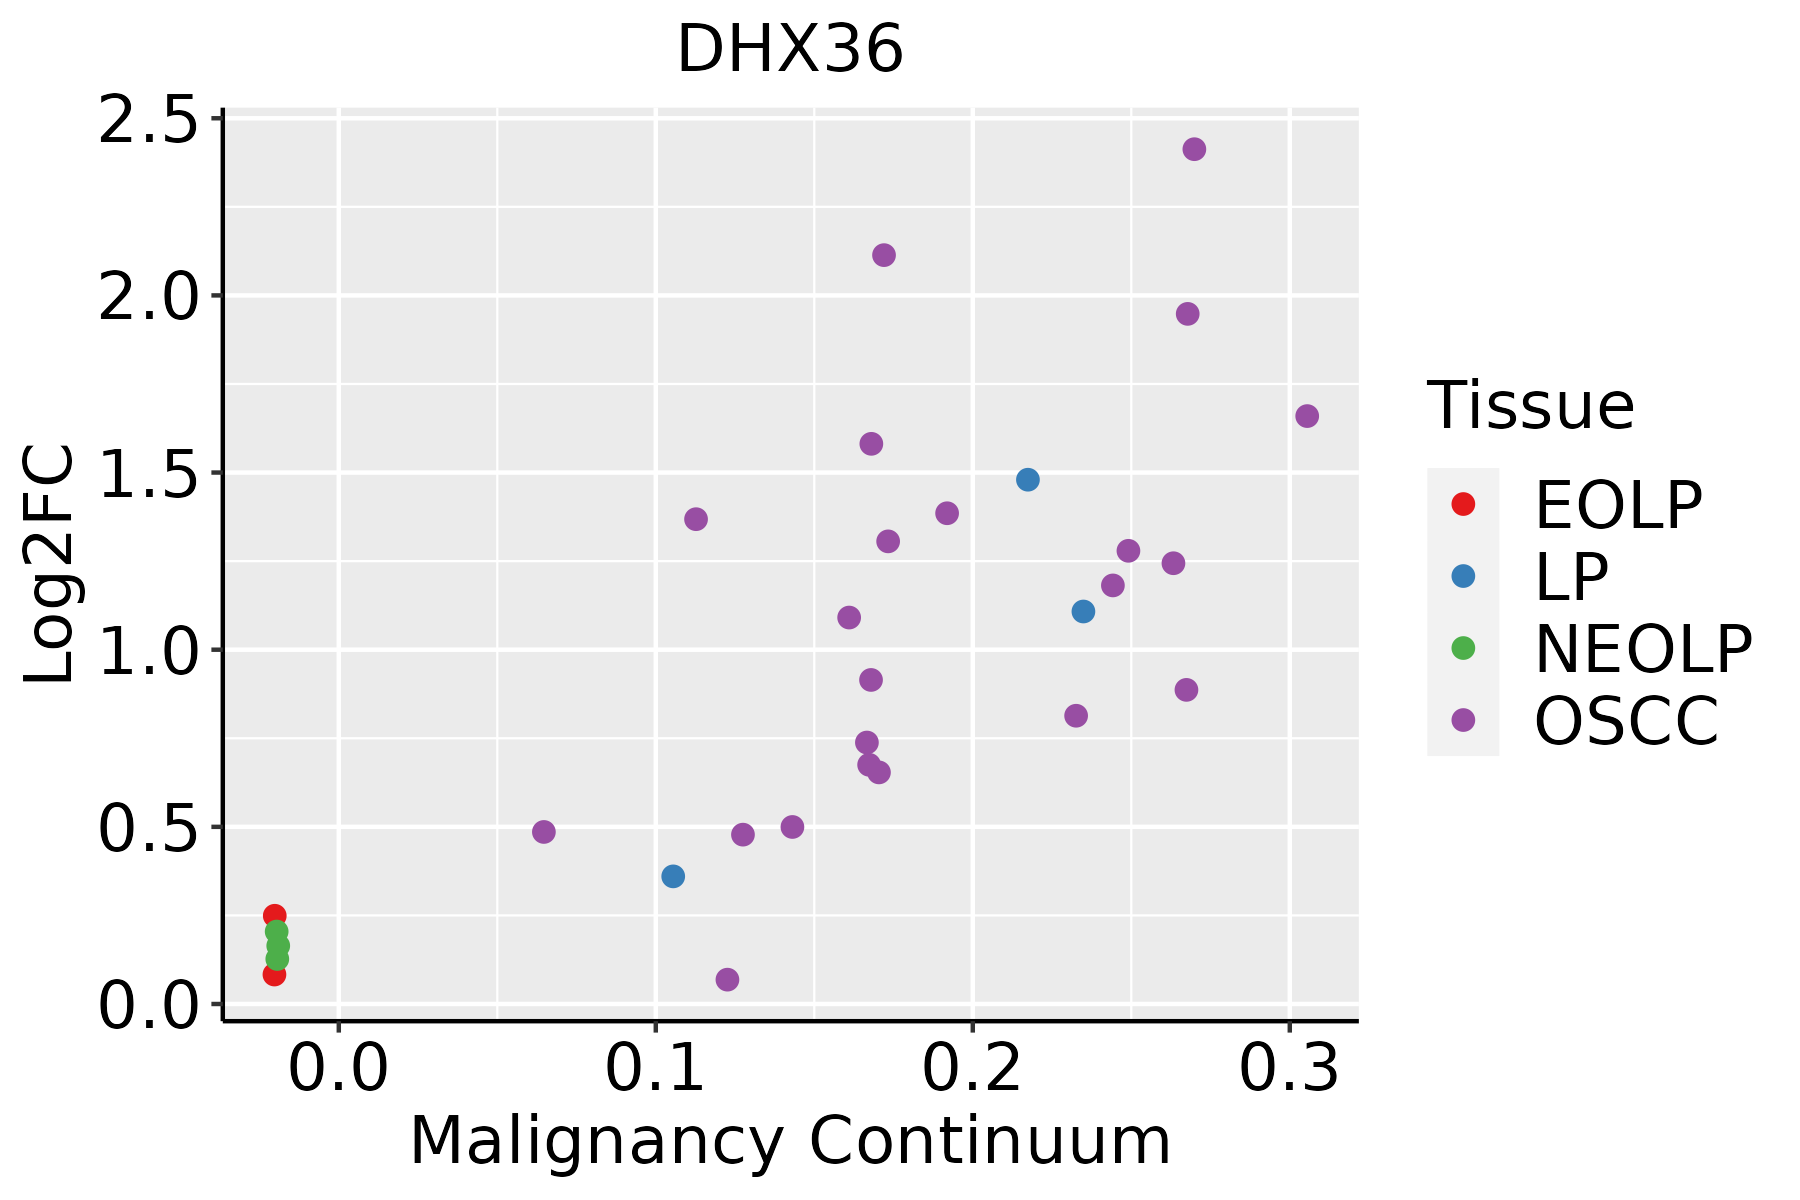 | EOLP: Erosive Oral lichen planus |
| LP: leukoplakia | ||
| NEOLP: Non-erosive oral lichen planus | ||
| OSCC: Oral squamous cell carcinoma | ||
| Prostate |  | BPH: Benign Prostatic Hyperplasia |
| Skin | 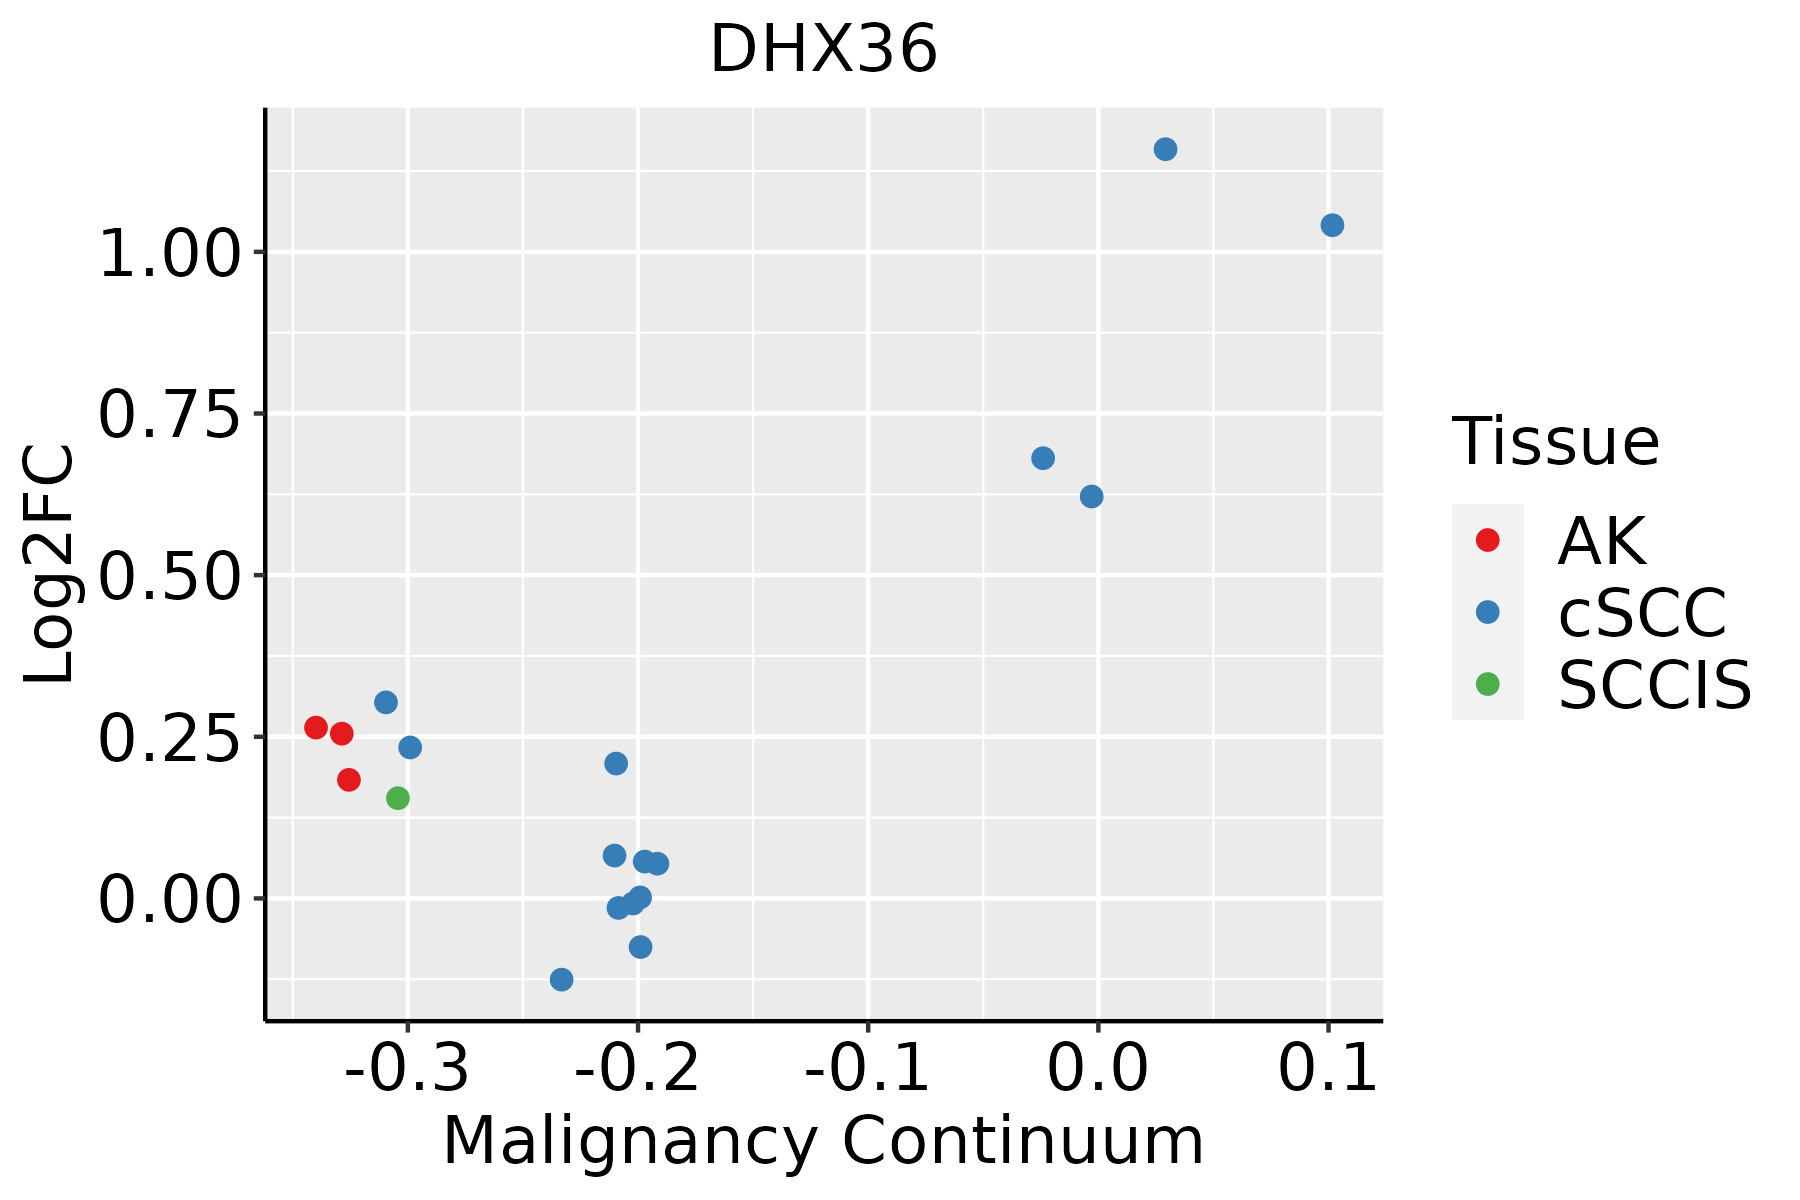 | AK: Actinic keratosis |
| cSCC: Cutaneous squamous cell carcinoma | ||
| SCCIS:squamous cell carcinoma in situ | ||
| Thyroid |  | ATC: Anaplastic thyroid cancer |
| HT: Hashimoto's thyroiditis | ||
| PTC: Papillary thyroid cancer |
| ∗log2FC in expression of this searched gene in stem-like cells from each diseased tissue sample relative to stem-like cells in normal samples in each tissue plotted against the malignancy continuum. Samples are colored based on if they are from different disease stage. |
Top |
Malignant transformation related pathway analysis |
| Find out the enriched GO biological processes and KEGG pathways involved in transition from healthy to precancer to cancer |
| Tissue | Disease Stage | Enriched GO biological Processes |
| Colorectum | AD |  |
| Colorectum | SER |  |
| Colorectum | MSS |  |
| Colorectum | MSI-H |  |
| Colorectum | FAP |  |
| ∗Top 15 enriched GO BP terms are showed in the bar plot of each disease state in each tissue. Each row represents a significant GO biological process which is colored according to the -log10(p.adjust). |
| Page: 1 2 3 4 5 6 7 8 9 |
| GO ID | Tissue | Disease Stage | Description | Gene Ratio | Bg Ratio | pvalue | p.adjust | Count |
| GO:00431234 | Liver | Cirrhotic | positive regulation of I-kappaB kinase/NF-kappaB signaling | 71/4634 | 186/18723 | 3.20e-05 | 3.97e-04 | 71 |
| GO:19043587 | Liver | Cirrhotic | positive regulation of telomere maintenance via telomere lengthening | 21/4634 | 37/18723 | 3.20e-05 | 3.97e-04 | 21 |
| GO:006115711 | Liver | Cirrhotic | mRNA destabilization | 38/4634 | 84/18723 | 3.34e-05 | 4.13e-04 | 38 |
| GO:005077911 | Liver | Cirrhotic | RNA destabilization | 39/4634 | 88/18723 | 4.69e-05 | 5.47e-04 | 39 |
| GO:006101411 | Liver | Cirrhotic | positive regulation of mRNA catabolic process | 38/4634 | 87/18723 | 8.55e-05 | 9.25e-04 | 38 |
| GO:001714811 | Liver | Cirrhotic | negative regulation of translation | 87/4634 | 245/18723 | 1.01e-04 | 1.05e-03 | 87 |
| GO:001077012 | Liver | Cirrhotic | positive regulation of cell morphogenesis involved in differentiation | 35/4634 | 79/18723 | 1.13e-04 | 1.14e-03 | 35 |
| GO:00510546 | Liver | Cirrhotic | positive regulation of DNA metabolic process | 73/4634 | 201/18723 | 1.60e-04 | 1.52e-03 | 73 |
| GO:007147811 | Liver | Cirrhotic | cellular response to radiation | 68/4634 | 186/18723 | 2.11e-04 | 1.94e-03 | 68 |
| GO:190435611 | Liver | Cirrhotic | regulation of telomere maintenance via telomere lengthening | 28/4634 | 61/18723 | 2.59e-04 | 2.31e-03 | 28 |
| GO:000028811 | Liver | Cirrhotic | nuclear-transcribed mRNA catabolic process, deadenylation-dependent decay | 26/4634 | 56/18723 | 3.40e-04 | 2.91e-03 | 26 |
| GO:00107205 | Liver | Cirrhotic | positive regulation of cell development | 99/4634 | 298/18723 | 5.71e-04 | 4.46e-03 | 99 |
| GO:00322002 | Liver | Cirrhotic | telomere organization | 58/4634 | 159/18723 | 6.31e-04 | 4.82e-03 | 58 |
| GO:20007361 | Liver | Cirrhotic | regulation of stem cell differentiation | 26/4634 | 58/18723 | 6.65e-04 | 5.04e-03 | 26 |
| GO:19001534 | Liver | Cirrhotic | positive regulation of nuclear-transcribed mRNA catabolic process, deadenylation-dependent decay | 10/4634 | 15/18723 | 7.26e-04 | 5.36e-03 | 10 |
| GO:00092666 | Liver | Cirrhotic | response to temperature stimulus | 63/4634 | 178/18723 | 9.38e-04 | 6.66e-03 | 63 |
| GO:190015111 | Liver | Cirrhotic | regulation of nuclear-transcribed mRNA catabolic process, deadenylation-dependent decay | 11/4634 | 18/18723 | 1.13e-03 | 7.73e-03 | 11 |
| GO:005105211 | Liver | Cirrhotic | regulation of DNA metabolic process | 114/4634 | 359/18723 | 1.48e-03 | 9.85e-03 | 114 |
| GO:00015035 | Liver | Cirrhotic | ossification | 127/4634 | 408/18723 | 1.89e-03 | 1.19e-02 | 127 |
| GO:0006367 | Liver | Cirrhotic | transcription initiation from RNA polymerase II promoter | 31/4634 | 77/18723 | 1.91e-03 | 1.20e-02 | 31 |
| Page: 1 2 3 4 5 6 7 8 9 10 11 12 13 14 15 16 17 18 19 20 21 22 23 24 25 26 27 28 29 30 31 32 33 34 35 36 37 38 39 40 41 42 43 44 45 46 47 48 49 50 51 52 53 54 55 56 57 58 59 60 61 62 63 64 65 66 67 68 69 70 71 72 73 74 75 76 |
| Pathway ID | Tissue | Disease Stage | Description | Gene Ratio | Bg Ratio | pvalue | p.adjust | qvalue | Count |
| hsa0301824 | Esophagus | ESCC | RNA degradation | 62/4205 | 79/8465 | 1.18e-07 | 9.39e-07 | 4.81e-07 | 62 |
| hsa0301834 | Esophagus | ESCC | RNA degradation | 62/4205 | 79/8465 | 1.18e-07 | 9.39e-07 | 4.81e-07 | 62 |
| hsa03018 | Liver | Cirrhotic | RNA degradation | 44/2530 | 79/8465 | 1.43e-06 | 1.65e-05 | 1.02e-05 | 44 |
| hsa030181 | Liver | Cirrhotic | RNA degradation | 44/2530 | 79/8465 | 1.43e-06 | 1.65e-05 | 1.02e-05 | 44 |
| hsa030182 | Liver | HCC | RNA degradation | 58/4020 | 79/8465 | 2.29e-06 | 2.19e-05 | 1.22e-05 | 58 |
| hsa030183 | Liver | HCC | RNA degradation | 58/4020 | 79/8465 | 2.29e-06 | 2.19e-05 | 1.22e-05 | 58 |
| hsa030189 | Oral cavity | OSCC | RNA degradation | 59/3704 | 79/8465 | 2.05e-08 | 1.91e-07 | 9.70e-08 | 59 |
| hsa0301814 | Oral cavity | OSCC | RNA degradation | 59/3704 | 79/8465 | 2.05e-08 | 1.91e-07 | 9.70e-08 | 59 |
| hsa0301823 | Oral cavity | LP | RNA degradation | 39/2418 | 79/8465 | 6.98e-05 | 4.38e-04 | 2.83e-04 | 39 |
| hsa0301833 | Oral cavity | LP | RNA degradation | 39/2418 | 79/8465 | 6.98e-05 | 4.38e-04 | 2.83e-04 | 39 |
| hsa0301841 | Oral cavity | EOLP | RNA degradation | 22/1218 | 79/8465 | 1.33e-03 | 4.80e-03 | 2.83e-03 | 22 |
| hsa0301851 | Oral cavity | EOLP | RNA degradation | 22/1218 | 79/8465 | 1.33e-03 | 4.80e-03 | 2.83e-03 | 22 |
| hsa0301861 | Oral cavity | NEOLP | RNA degradation | 18/1112 | 79/8465 | 1.25e-02 | 4.06e-02 | 2.56e-02 | 18 |
| hsa0301871 | Oral cavity | NEOLP | RNA degradation | 18/1112 | 79/8465 | 1.25e-02 | 4.06e-02 | 2.56e-02 | 18 |
| hsa030188 | Prostate | BPH | RNA degradation | 29/1718 | 79/8465 | 5.17e-04 | 2.67e-03 | 1.65e-03 | 29 |
| hsa0301813 | Prostate | BPH | RNA degradation | 29/1718 | 79/8465 | 5.17e-04 | 2.67e-03 | 1.65e-03 | 29 |
| hsa0301822 | Prostate | Tumor | RNA degradation | 30/1791 | 79/8465 | 4.48e-04 | 2.35e-03 | 1.46e-03 | 30 |
| hsa0301832 | Prostate | Tumor | RNA degradation | 30/1791 | 79/8465 | 4.48e-04 | 2.35e-03 | 1.46e-03 | 30 |
| Page: 1 |
Top |
Cell-cell communication analysis |
| Identification of potential cell-cell interactions between two cell types and their ligand-receptor pairs for different disease states |
| Ligand | Receptor | LRpair | Pathway | Tissue | Disease Stage |
| Page: 1 |
Top |
Single-cell gene regulatory network inference analysis |
| Find out the significant the regulons (TFs) and the target genes of each regulon across cell types for different disease states |
| TF | Cell Type | Tissue | Disease Stage | Target Gene | RSS | Regulon Activity |
| ∗The dot plots of a searched regulon are shown for all cell subpopulations in each disease state of each tissue based on the regulon specific score inferred using pySCENIC and by calculating the average expression. |
| Page: 1 |
Top |
Somatic mutation of malignant transformation related genes |
| Annotation of somatic variants for genes involved in malignant transformation |
| Hugo Symbol | Variant Class | Variant Classification | dbSNP RS | HGVSc | HGVSp | HGVSp Short | SWISSPROT | BIOTYPE | SIFT | PolyPhen | Tumor Sample Barcode | Tissue | Histology | Sex | Age | Stage | Therapy Types | Drugs | Outcome |
| DHX36 | SNV | Missense_Mutation | novel | c.2971N>A | p.Glu991Lys | p.E991K | Q9H2U1 | protein_coding | deleterious(0.02) | benign(0.013) | TCGA-AC-A23H-01 | Breast | breast invasive carcinoma | Female | >=65 | I/II | Unknown | Unknown | PD |
| DHX36 | SNV | Missense_Mutation | c.319N>A | p.Asp107Asn | p.D107N | Q9H2U1 | protein_coding | tolerated(0.31) | benign(0) | TCGA-AC-A23H-01 | Breast | breast invasive carcinoma | Female | >=65 | I/II | Unknown | Unknown | PD | |
| DHX36 | SNV | Missense_Mutation | rs151135113 | c.1070N>A | p.Arg357Gln | p.R357Q | Q9H2U1 | protein_coding | deleterious(0) | probably_damaging(0.997) | TCGA-AN-A046-01 | Breast | breast invasive carcinoma | Female | >=65 | I/II | Unknown | Unknown | SD |
| DHX36 | SNV | Missense_Mutation | novel | c.2400G>C | p.Gln800His | p.Q800H | Q9H2U1 | protein_coding | deleterious(0) | probably_damaging(0.986) | TCGA-B6-A402-01 | Breast | breast invasive carcinoma | Female | <65 | I/II | Chemotherapy | cyclophosphamide | PD |
| DHX36 | SNV | Missense_Mutation | novel | c.140N>A | p.Arg47Gln | p.R47Q | Q9H2U1 | protein_coding | tolerated(0.59) | possibly_damaging(0.885) | TCGA-BH-A0B6-01 | Breast | breast invasive carcinoma | Female | <65 | I/II | Unknown | Unknown | SD |
| DHX36 | SNV | Missense_Mutation | novel | c.875N>T | p.Tyr292Phe | p.Y292F | Q9H2U1 | protein_coding | tolerated(0.12) | probably_damaging(0.979) | TCGA-D8-A1XQ-01 | Breast | breast invasive carcinoma | Female | >=65 | I/II | Unknown | Unknown | SD |
| DHX36 | insertion | Nonsense_Mutation | novel | c.1464_1465insTAATTATTTATTTATTAATTTATTTTTGAAAC | p.Gly489Ter | p.G489* | Q9H2U1 | protein_coding | TCGA-A8-A07Z-01 | Breast | breast invasive carcinoma | Female | >=65 | I/II | Unspecific | Exemestane | SD | ||
| DHX36 | SNV | Missense_Mutation | novel | c.418N>T | p.Leu140Phe | p.L140F | Q9H2U1 | protein_coding | tolerated(0.73) | benign(0) | TCGA-DS-A1OC-01 | Cervix | cervical & endocervical cancer | Female | <65 | I/II | Chemotherapy | gemcitabine | SD |
| DHX36 | SNV | Missense_Mutation | rs747063807 | c.1949N>A | p.Gly650Glu | p.G650E | Q9H2U1 | protein_coding | tolerated(0.71) | benign(0.007) | TCGA-JX-A3Q0-01 | Cervix | cervical & endocervical cancer | Female | <65 | III/IV | Unknown | Unknown | SD |
| DHX36 | SNV | Missense_Mutation | novel | c.1003G>A | p.Glu335Lys | p.E335K | Q9H2U1 | protein_coding | deleterious(0) | probably_damaging(1) | TCGA-VS-A8QM-01 | Cervix | cervical & endocervical cancer | Female | <65 | I/II | Chemotherapy | cisplatin | PD |
| Page: 1 2 3 4 5 6 7 8 9 10 11 12 |
Top |
Related drugs of malignant transformation related genes |
| Identification of chemicals and drugs interact with genes involved in malignant transfromation |
| (DGIdb 4.0) |
| Entrez ID | Symbol | Category | Interaction Types | Drug Claim Name | Drug Name | PMIDs |
| 170506 | DHX36 | NA | MANOALIDE | MANOALIDE | 22394195 |
| Page: 1 |

Copyright 2023-Present -The University of Texas Health Science Center at Houston |