
|
|||||
|
 | |
| |
| |
| |
| |
| |
|
Gene: CNOT1 |
Gene summary for CNOT1 |
| Gene information | Species | Human | Gene symbol | CNOT1 | Gene ID | 23019 |
| Gene name | CCR4-NOT transcription complex subunit 1 | |
| Gene Alias | AD-005 | |
| Cytomap | 16q21 | |
| Gene Type | protein-coding | GO ID | GO:0000122 | UniProtAcc | A5YKK6 |
Top |
Malignant transformation analysis |
| Identification of the aberrant gene expression in precancerous and cancerous lesions by comparing the gene expression of stem-like cells in diseased tissues with normal stem cells |
| Entrez ID | Symbol | Replicates | Species | Organ | Tissue | Adj P-value | Log2FC | Malignancy |
| 23019 | CNOT1 | CA_HPV_2 | Human | Cervix | CC | 3.22e-08 | 3.44e-01 | 0.0391 |
| 23019 | CNOT1 | CCI_1 | Human | Cervix | CC | 2.98e-03 | 6.69e-01 | 0.528 |
| 23019 | CNOT1 | CCI_2 | Human | Cervix | CC | 1.63e-09 | 9.66e-01 | 0.5249 |
| 23019 | CNOT1 | CCI_3 | Human | Cervix | CC | 6.26e-04 | 7.76e-01 | 0.516 |
| 23019 | CNOT1 | sample3 | Human | Cervix | CC | 1.16e-02 | 1.87e-01 | 0.1387 |
| 23019 | CNOT1 | T3 | Human | Cervix | CC | 1.16e-05 | 2.01e-01 | 0.1389 |
| 23019 | CNOT1 | HTA11_3410_2000001011 | Human | Colorectum | AD | 5.26e-12 | -5.29e-01 | 0.0155 |
| 23019 | CNOT1 | HTA11_2487_2000001011 | Human | Colorectum | SER | 2.37e-03 | -4.89e-01 | -0.1808 |
| 23019 | CNOT1 | HTA11_78_2000001011 | Human | Colorectum | AD | 4.40e-02 | -4.02e-01 | -0.1088 |
| 23019 | CNOT1 | HTA11_3361_2000001011 | Human | Colorectum | AD | 2.84e-07 | -5.78e-01 | -0.1207 |
| 23019 | CNOT1 | HTA11_696_2000001011 | Human | Colorectum | AD | 3.23e-07 | -3.42e-01 | -0.1464 |
| 23019 | CNOT1 | HTA11_7862_2000001011 | Human | Colorectum | AD | 2.65e-03 | -6.01e-01 | -0.0179 |
| 23019 | CNOT1 | HTA11_866_3004761011 | Human | Colorectum | AD | 5.88e-08 | -4.98e-01 | 0.096 |
| 23019 | CNOT1 | HTA11_7696_3000711011 | Human | Colorectum | AD | 2.15e-17 | -5.32e-01 | 0.0674 |
| 23019 | CNOT1 | HTA11_99999970781_79442 | Human | Colorectum | MSS | 2.28e-22 | -5.67e-01 | 0.294 |
| 23019 | CNOT1 | HTA11_99999971662_82457 | Human | Colorectum | MSS | 2.62e-15 | -5.24e-01 | 0.3859 |
| 23019 | CNOT1 | HTA11_99999973899_84307 | Human | Colorectum | MSS | 3.23e-03 | -5.67e-01 | 0.2585 |
| 23019 | CNOT1 | HTA11_99999974143_84620 | Human | Colorectum | MSS | 4.88e-15 | -5.13e-01 | 0.3005 |
| 23019 | CNOT1 | F007 | Human | Colorectum | FAP | 1.17e-02 | -3.21e-01 | 0.1176 |
| 23019 | CNOT1 | A002-C-010 | Human | Colorectum | FAP | 2.54e-02 | -1.41e-01 | 0.242 |
| Page: 1 2 3 4 5 6 7 8 9 10 |
| Tissue | Expression Dynamics | Abbreviation |
| Cervix |  | CC: Cervix cancer |
| HSIL_HPV: HPV-infected high-grade squamous intraepithelial lesions | ||
| N_HPV: HPV-infected normal cervix | ||
| Colorectum (GSE201348) |  | FAP: Familial adenomatous polyposis |
| CRC: Colorectal cancer | ||
| Colorectum (HTA11) |  | AD: Adenomas |
| SER: Sessile serrated lesions | ||
| MSI-H: Microsatellite-high colorectal cancer | ||
| MSS: Microsatellite stable colorectal cancer | ||
| Endometrium | 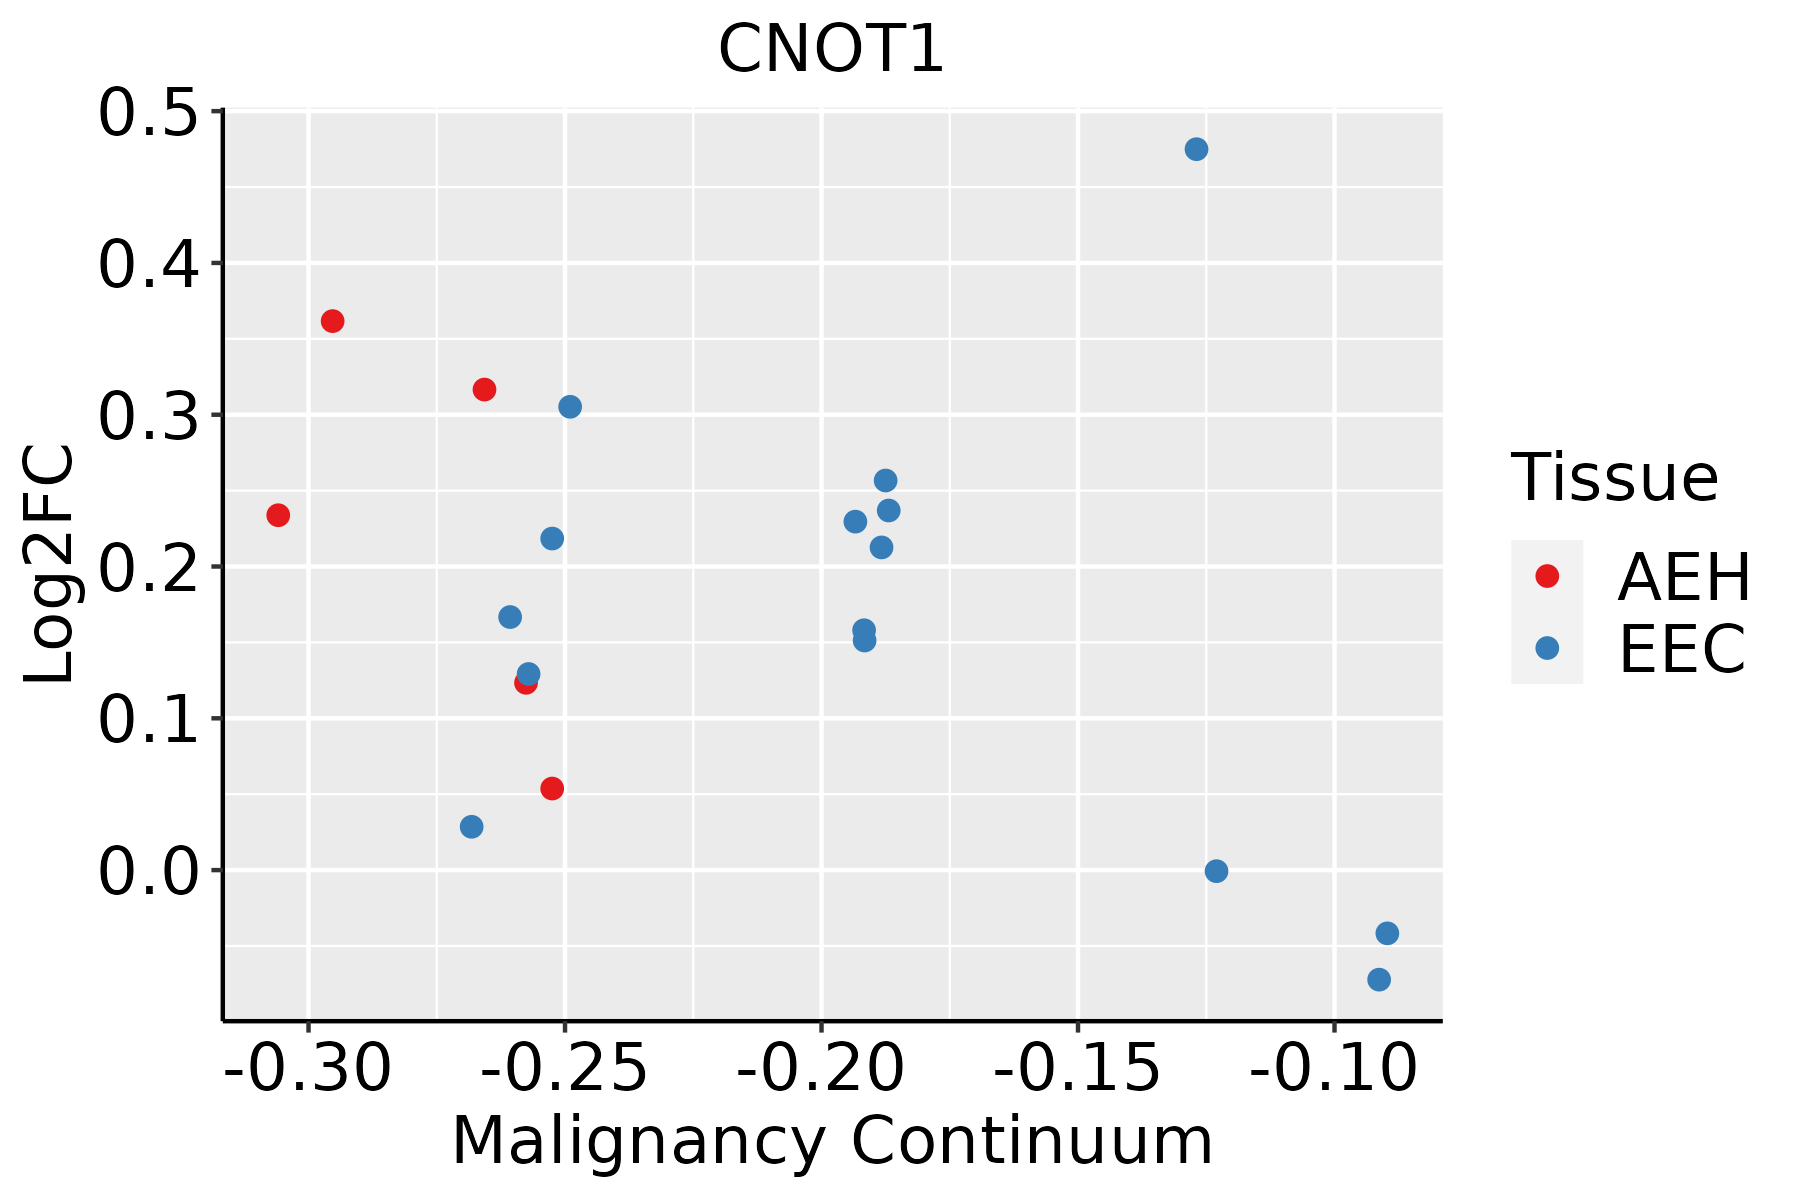 | AEH: Atypical endometrial hyperplasia |
| EEC: Endometrioid Cancer | ||
| Esophagus | 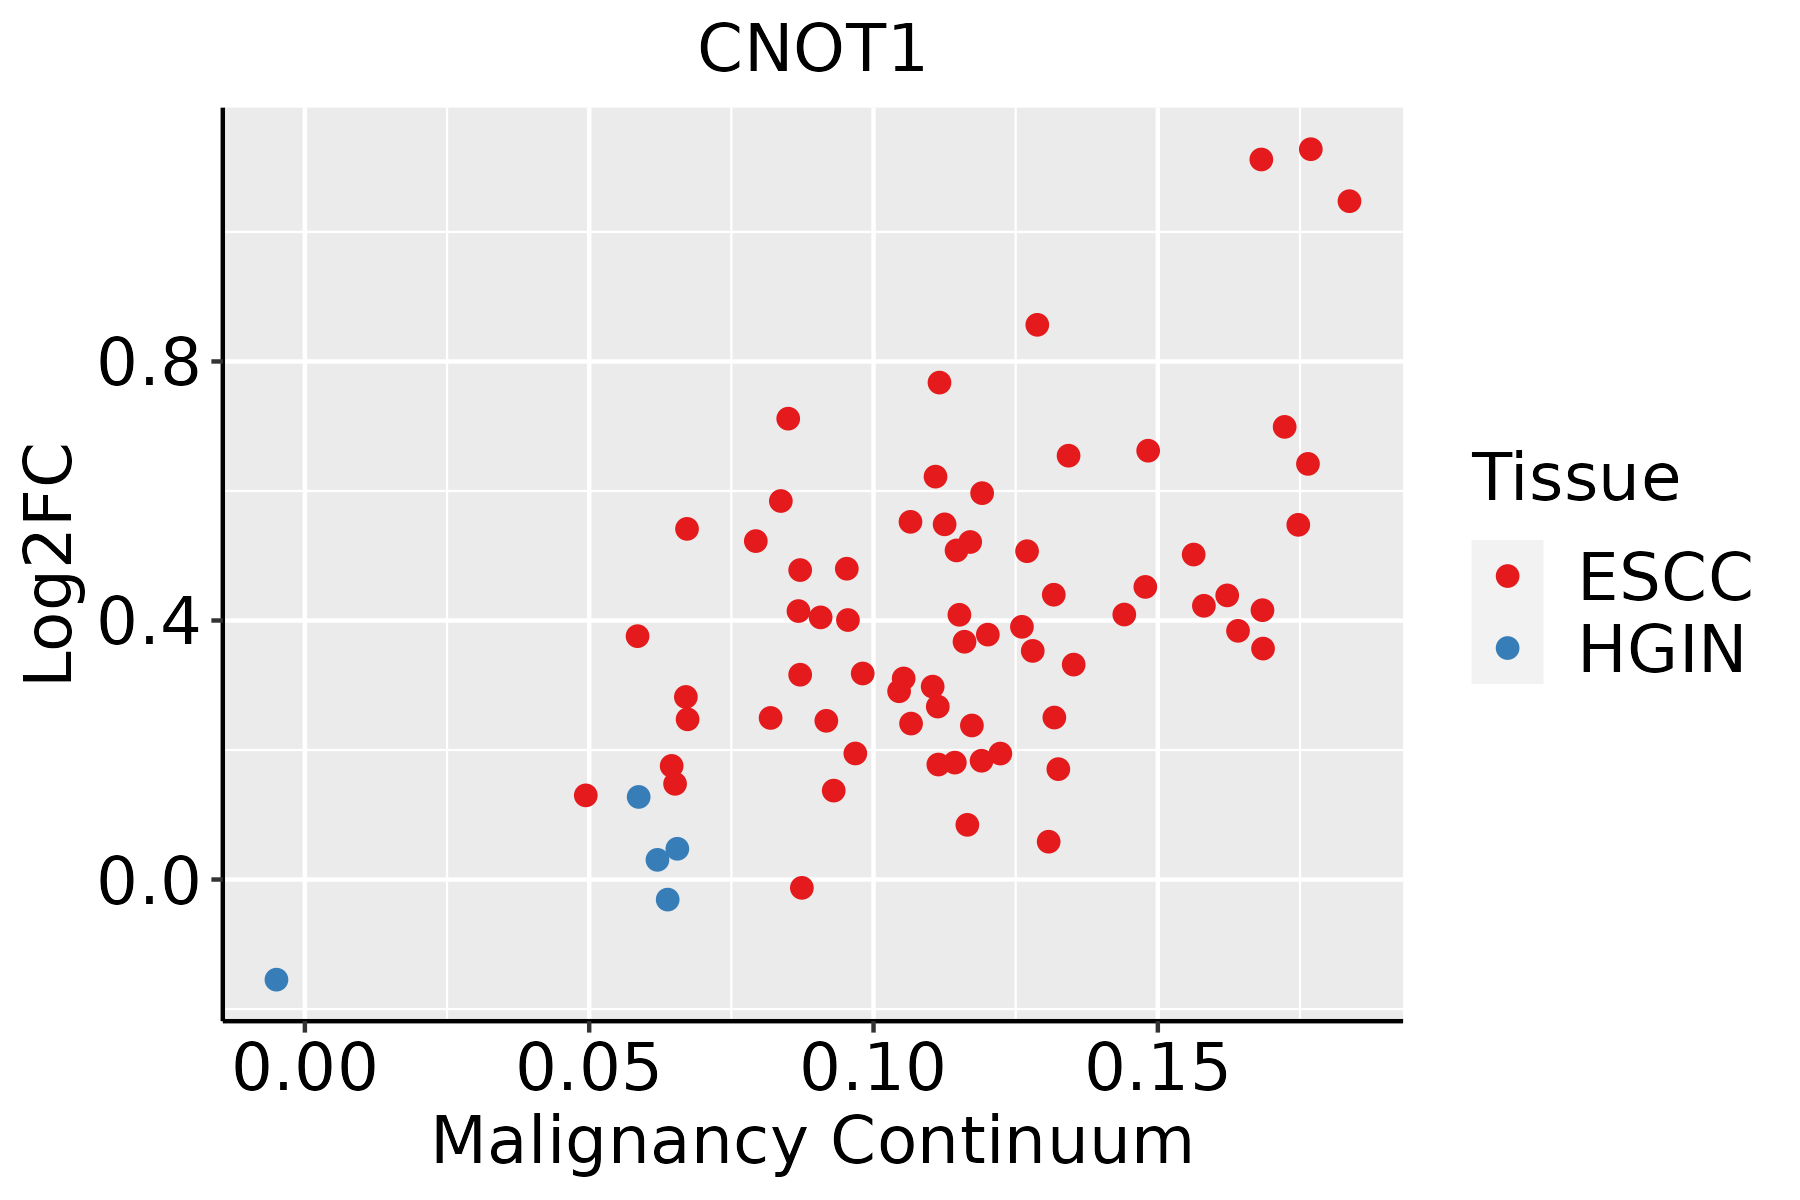 | ESCC: Esophageal squamous cell carcinoma |
| HGIN: High-grade intraepithelial neoplasias | ||
| LGIN: Low-grade intraepithelial neoplasias | ||
| Liver | 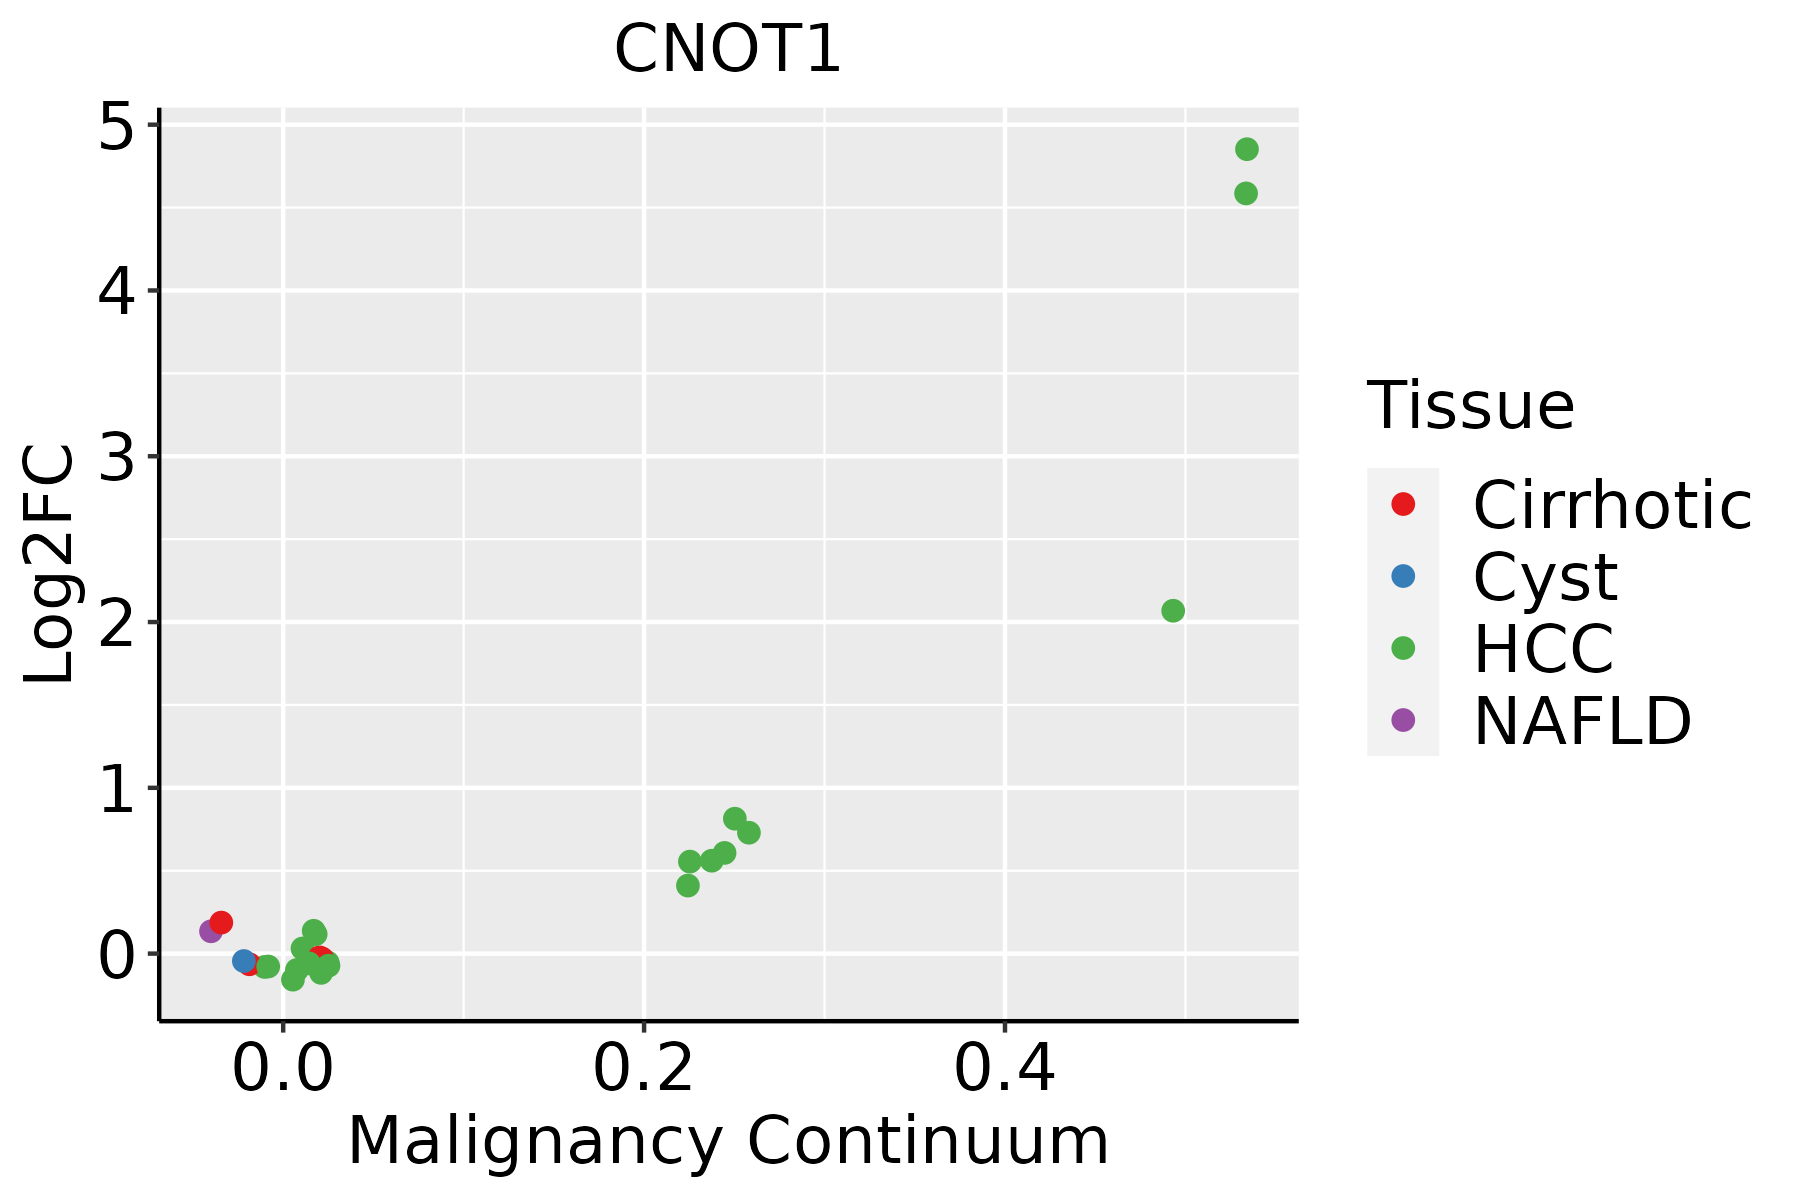 | HCC: Hepatocellular carcinoma |
| NAFLD: Non-alcoholic fatty liver disease | ||
| Oral Cavity | 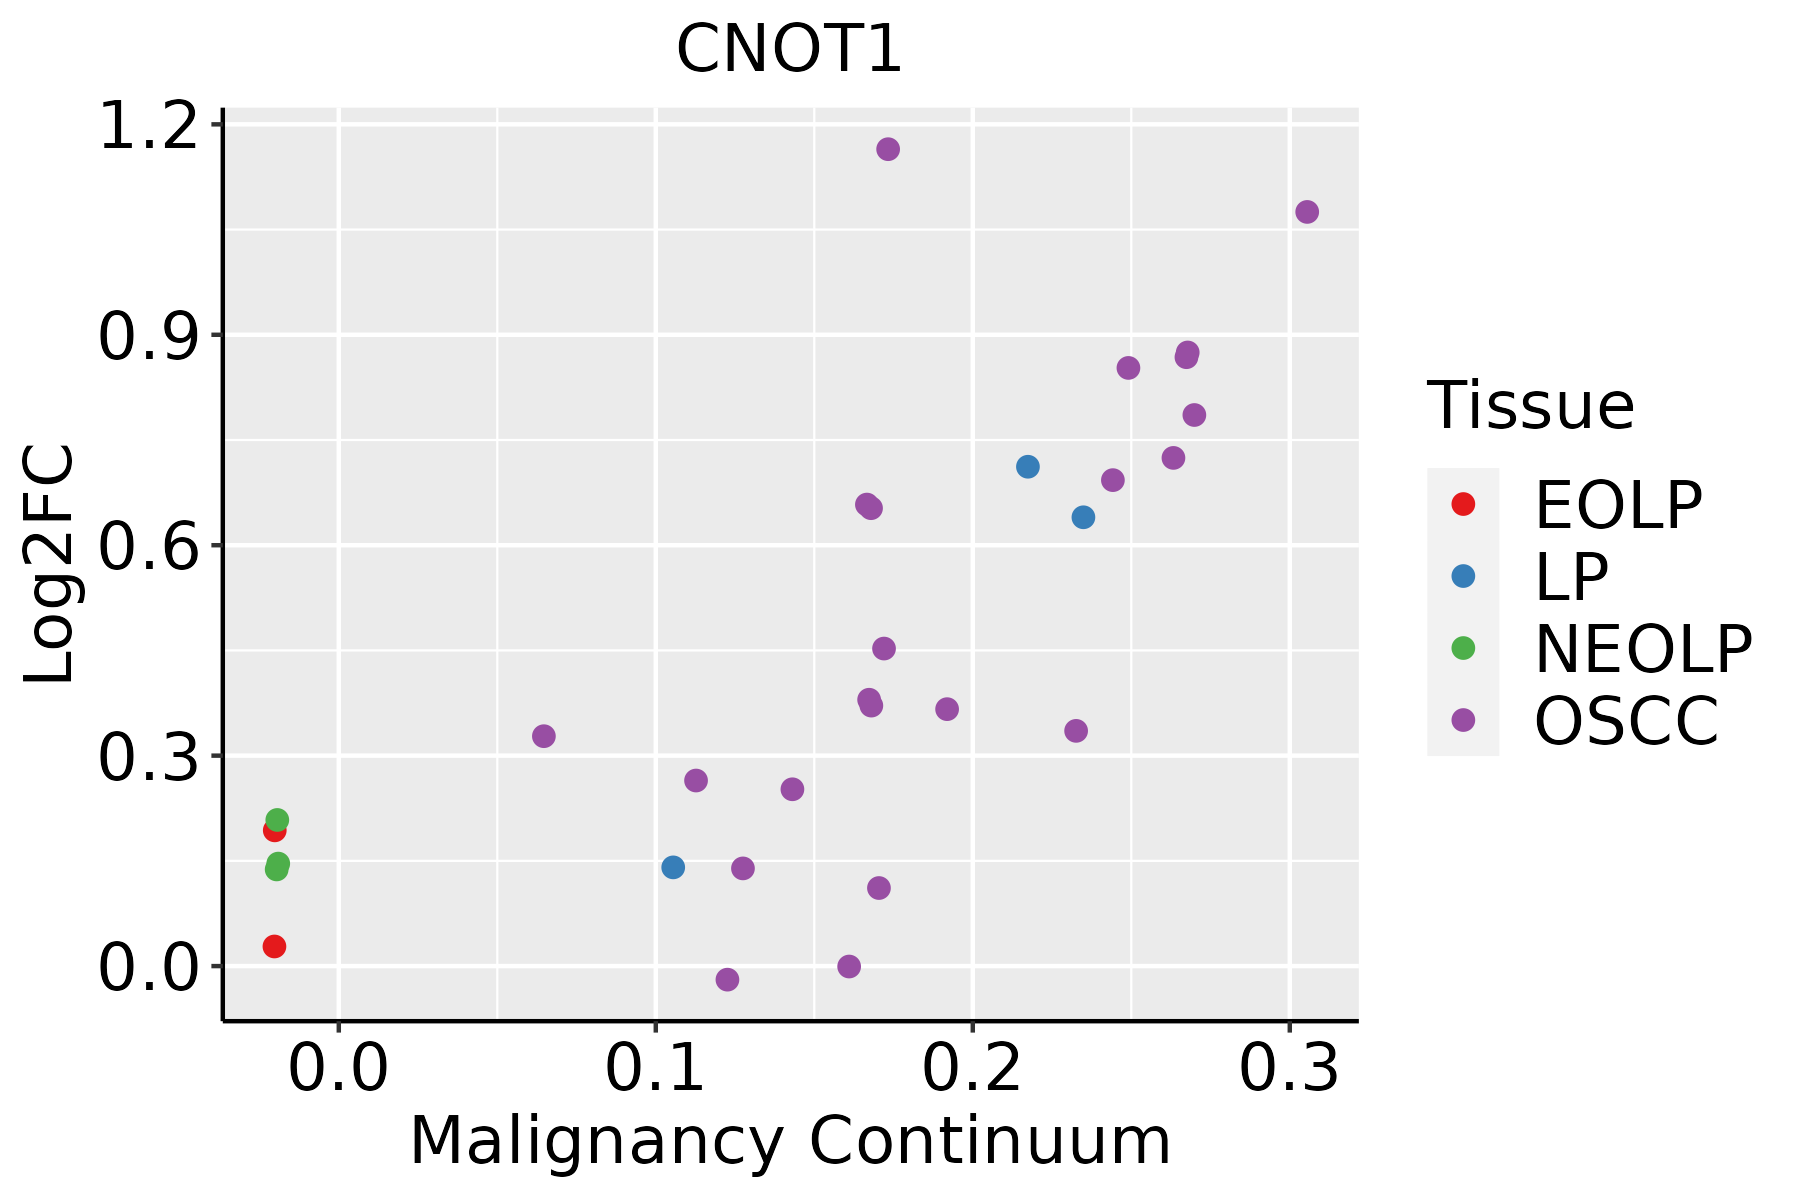 | EOLP: Erosive Oral lichen planus |
| LP: leukoplakia | ||
| NEOLP: Non-erosive oral lichen planus | ||
| OSCC: Oral squamous cell carcinoma | ||
| Prostate |  | BPH: Benign Prostatic Hyperplasia |
| Skin | 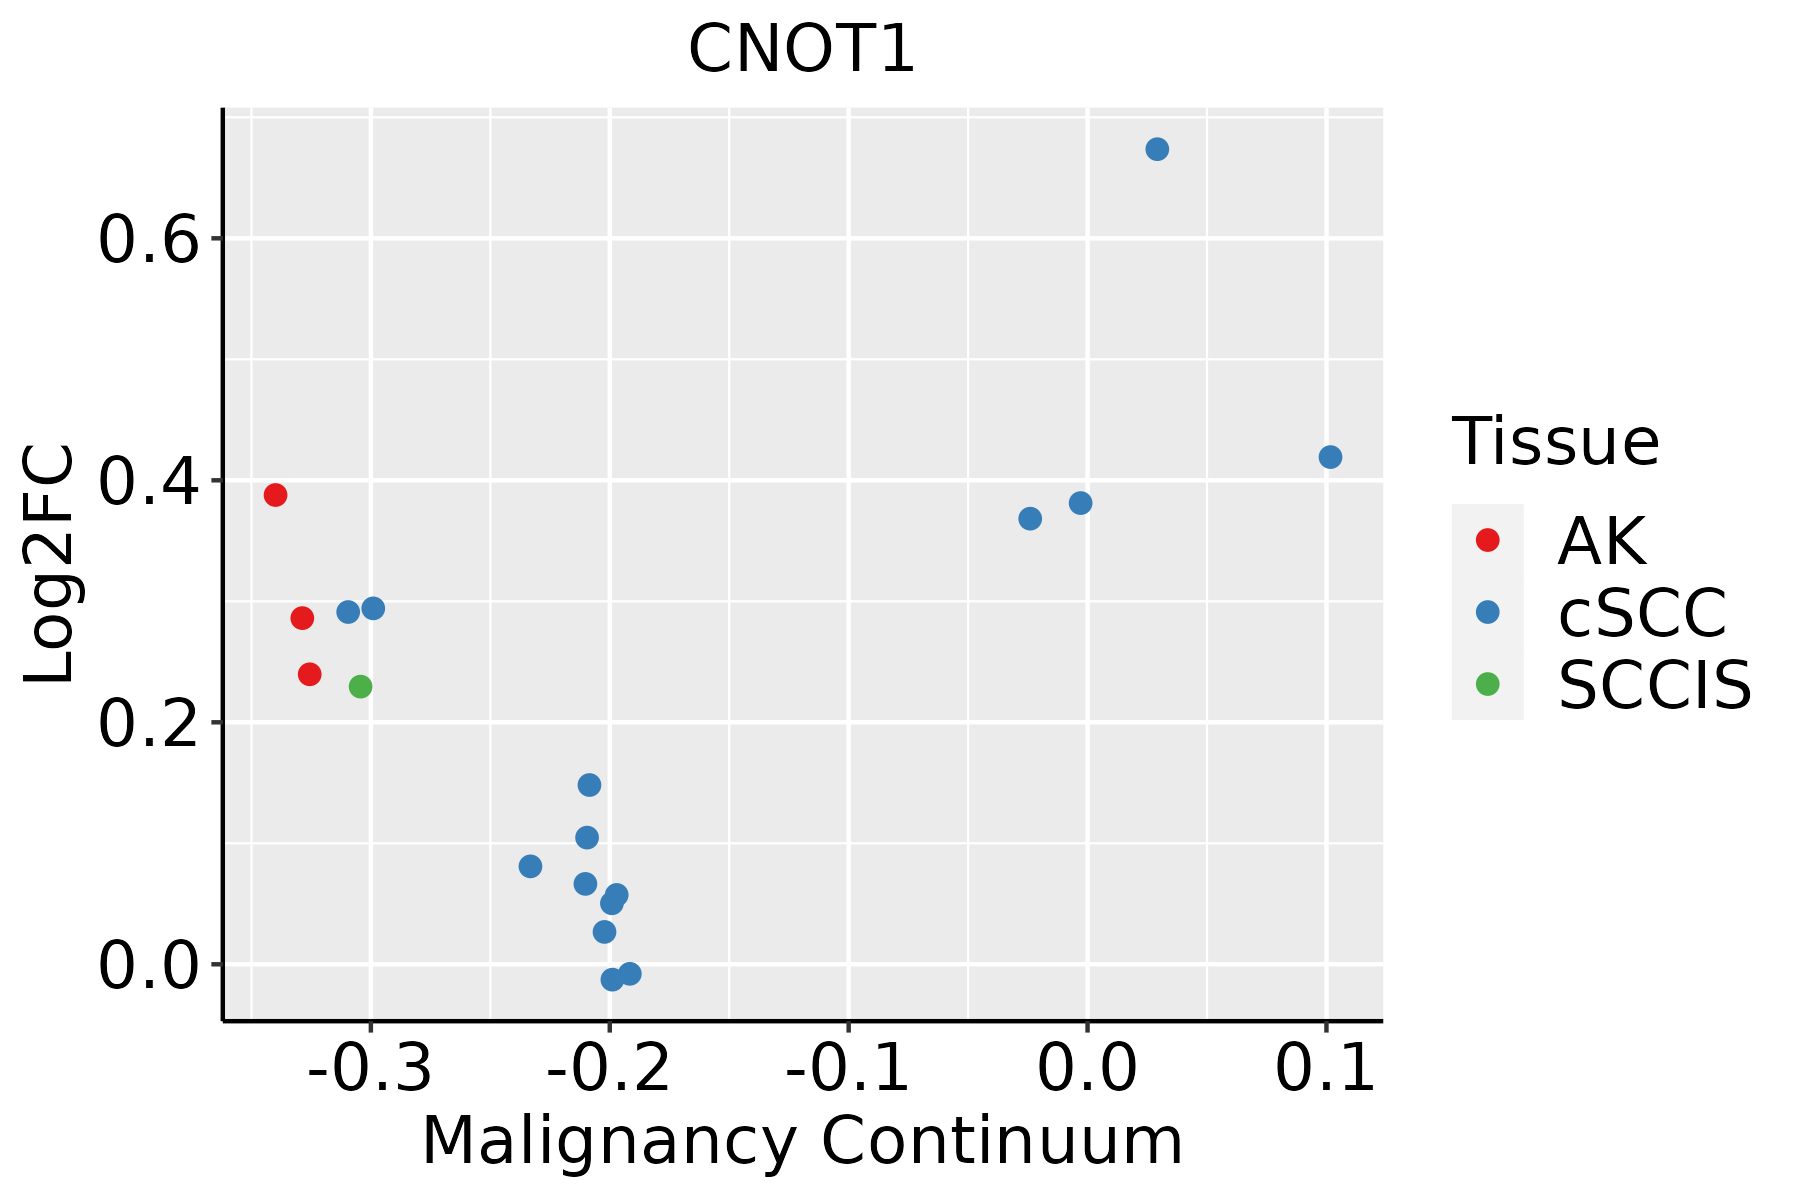 | AK: Actinic keratosis |
| cSCC: Cutaneous squamous cell carcinoma | ||
| SCCIS:squamous cell carcinoma in situ | ||
| Thyroid | 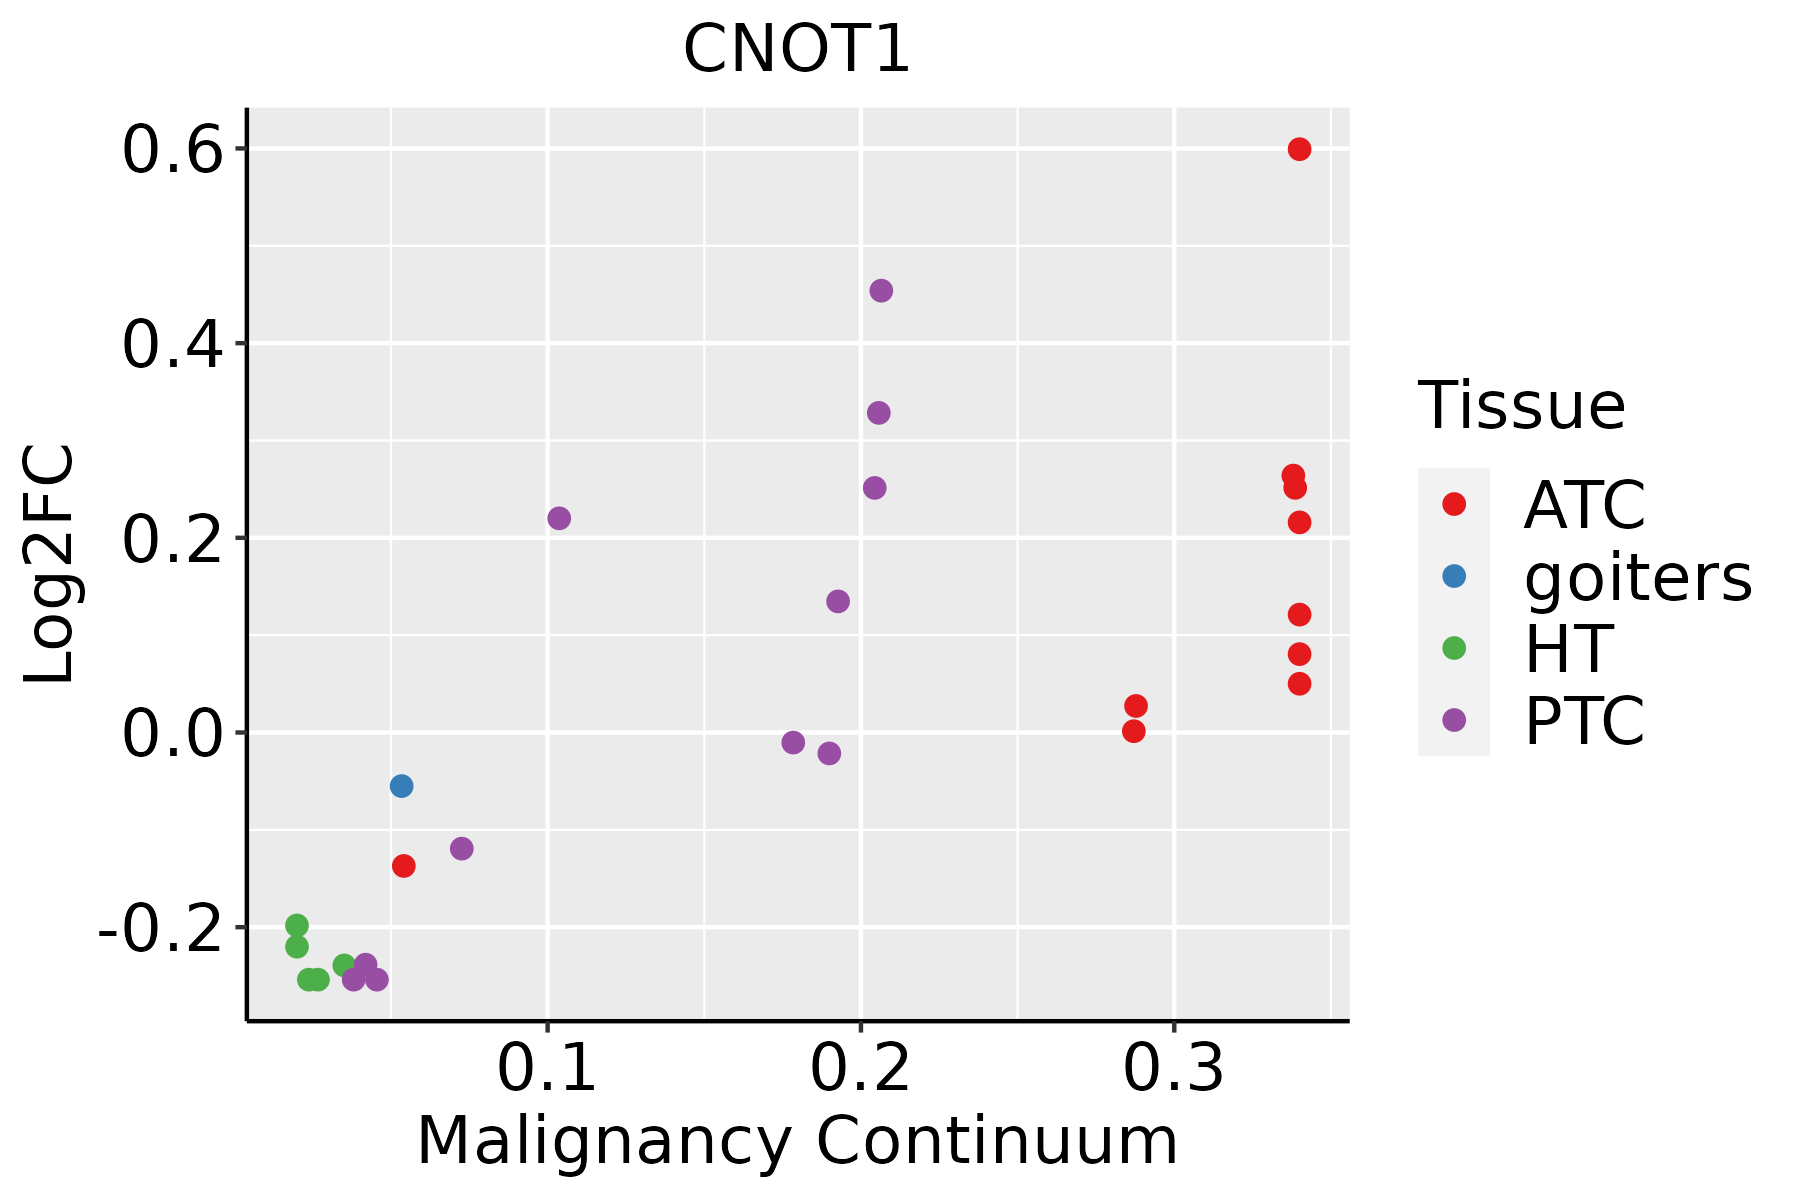 | ATC: Anaplastic thyroid cancer |
| HT: Hashimoto's thyroiditis | ||
| PTC: Papillary thyroid cancer |
| ∗log2FC in expression of this searched gene in stem-like cells from each diseased tissue sample relative to stem-like cells in normal samples in each tissue plotted against the malignancy continuum. Samples are colored based on if they are from different disease stage. |
Top |
Malignant transformation related pathway analysis |
| Find out the enriched GO biological processes and KEGG pathways involved in transition from healthy to precancer to cancer |
| Tissue | Disease Stage | Enriched GO biological Processes |
| Colorectum | AD |  |
| Colorectum | SER |  |
| Colorectum | MSS |  |
| Colorectum | MSI-H |  |
| Colorectum | FAP |  |
| ∗Top 15 enriched GO BP terms are showed in the bar plot of each disease state in each tissue. Each row represents a significant GO biological process which is colored according to the -log10(p.adjust). |
| Page: 1 2 3 4 5 6 7 8 9 |
| GO ID | Tissue | Disease Stage | Description | Gene Ratio | Bg Ratio | pvalue | p.adjust | Count |
| GO:0048545111 | Esophagus | ESCC | response to steroid hormone | 204/8552 | 339/18723 | 4.47e-08 | 8.11e-07 | 204 |
| GO:006101416 | Esophagus | ESCC | positive regulation of mRNA catabolic process | 63/8552 | 87/18723 | 3.70e-07 | 5.15e-06 | 63 |
| GO:009872714 | Esophagus | ESCC | maintenance of cell number | 90/8552 | 134/18723 | 3.94e-07 | 5.43e-06 | 90 |
| GO:006115716 | Esophagus | ESCC | mRNA destabilization | 61/8552 | 84/18723 | 4.81e-07 | 6.49e-06 | 61 |
| GO:001982714 | Esophagus | ESCC | stem cell population maintenance | 88/8552 | 131/18723 | 5.23e-07 | 6.97e-06 | 88 |
| GO:00905033 | Esophagus | ESCC | RNA phosphodiester bond hydrolysis, exonucleolytic | 35/8552 | 42/18723 | 5.35e-07 | 7.11e-06 | 35 |
| GO:005077916 | Esophagus | ESCC | RNA destabilization | 63/8552 | 88/18723 | 7.23e-07 | 9.40e-06 | 63 |
| GO:000182412 | Esophagus | ESCC | blastocyst development | 73/8552 | 106/18723 | 1.13e-06 | 1.40e-05 | 73 |
| GO:0071383110 | Esophagus | ESCC | cellular response to steroid hormone stimulus | 127/8552 | 204/18723 | 1.26e-06 | 1.55e-05 | 127 |
| GO:190211514 | Esophagus | ESCC | regulation of organelle assembly | 116/8552 | 186/18723 | 3.15e-06 | 3.53e-05 | 116 |
| GO:003051819 | Esophagus | ESCC | intracellular steroid hormone receptor signaling pathway | 76/8552 | 116/18723 | 1.25e-05 | 1.15e-04 | 76 |
| GO:004340119 | Esophagus | ESCC | steroid hormone mediated signaling pathway | 87/8552 | 136/18723 | 1.25e-05 | 1.15e-04 | 87 |
| GO:000028816 | Esophagus | ESCC | nuclear-transcribed mRNA catabolic process, deadenylation-dependent decay | 40/8552 | 56/18723 | 8.36e-05 | 6.08e-04 | 40 |
| GO:00331438 | Esophagus | ESCC | regulation of intracellular steroid hormone receptor signaling pathway | 50/8552 | 74/18723 | 1.16e-04 | 8.04e-04 | 50 |
| GO:00018253 | Esophagus | ESCC | blastocyst formation | 29/8552 | 38/18723 | 1.18e-04 | 8.13e-04 | 29 |
| GO:000975516 | Esophagus | ESCC | hormone-mediated signaling pathway | 106/8552 | 190/18723 | 3.13e-03 | 1.30e-02 | 106 |
| GO:003052014 | Esophagus | ESCC | intracellular estrogen receptor signaling pathway | 35/8552 | 54/18723 | 3.55e-03 | 1.45e-02 | 35 |
| GO:19021174 | Esophagus | ESCC | positive regulation of organelle assembly | 42/8552 | 67/18723 | 3.72e-03 | 1.52e-02 | 42 |
| GO:004838412 | Esophagus | ESCC | retinoic acid receptor signaling pathway | 22/8552 | 31/18723 | 3.90e-03 | 1.58e-02 | 22 |
| GO:003396214 | Esophagus | ESCC | P-body assembly | 16/8552 | 21/18723 | 4.47e-03 | 1.76e-02 | 16 |
| Page: 1 2 3 4 5 6 7 8 9 10 11 12 13 14 15 16 17 18 19 20 21 22 23 24 25 26 27 28 29 30 31 32 33 34 35 36 37 38 39 40 41 42 43 |
| Pathway ID | Tissue | Disease Stage | Description | Gene Ratio | Bg Ratio | pvalue | p.adjust | qvalue | Count |
| hsa030187 | Endometrium | EEC | RNA degradation | 20/1237 | 79/8465 | 8.36e-03 | 3.88e-02 | 2.89e-02 | 20 |
| hsa0301812 | Endometrium | EEC | RNA degradation | 20/1237 | 79/8465 | 8.36e-03 | 3.88e-02 | 2.89e-02 | 20 |
| hsa0301810 | Esophagus | HGIN | RNA degradation | 27/1383 | 79/8465 | 7.73e-05 | 9.00e-04 | 7.15e-04 | 27 |
| hsa0301815 | Esophagus | HGIN | RNA degradation | 27/1383 | 79/8465 | 7.73e-05 | 9.00e-04 | 7.15e-04 | 27 |
| hsa0301824 | Esophagus | ESCC | RNA degradation | 62/4205 | 79/8465 | 1.18e-07 | 9.39e-07 | 4.81e-07 | 62 |
| hsa0301834 | Esophagus | ESCC | RNA degradation | 62/4205 | 79/8465 | 1.18e-07 | 9.39e-07 | 4.81e-07 | 62 |
| hsa03018 | Liver | Cirrhotic | RNA degradation | 44/2530 | 79/8465 | 1.43e-06 | 1.65e-05 | 1.02e-05 | 44 |
| hsa030181 | Liver | Cirrhotic | RNA degradation | 44/2530 | 79/8465 | 1.43e-06 | 1.65e-05 | 1.02e-05 | 44 |
| hsa030182 | Liver | HCC | RNA degradation | 58/4020 | 79/8465 | 2.29e-06 | 2.19e-05 | 1.22e-05 | 58 |
| hsa030183 | Liver | HCC | RNA degradation | 58/4020 | 79/8465 | 2.29e-06 | 2.19e-05 | 1.22e-05 | 58 |
| hsa030189 | Oral cavity | OSCC | RNA degradation | 59/3704 | 79/8465 | 2.05e-08 | 1.91e-07 | 9.70e-08 | 59 |
| hsa0301814 | Oral cavity | OSCC | RNA degradation | 59/3704 | 79/8465 | 2.05e-08 | 1.91e-07 | 9.70e-08 | 59 |
| hsa0301823 | Oral cavity | LP | RNA degradation | 39/2418 | 79/8465 | 6.98e-05 | 4.38e-04 | 2.83e-04 | 39 |
| hsa0301833 | Oral cavity | LP | RNA degradation | 39/2418 | 79/8465 | 6.98e-05 | 4.38e-04 | 2.83e-04 | 39 |
| hsa0301841 | Oral cavity | EOLP | RNA degradation | 22/1218 | 79/8465 | 1.33e-03 | 4.80e-03 | 2.83e-03 | 22 |
| hsa0301851 | Oral cavity | EOLP | RNA degradation | 22/1218 | 79/8465 | 1.33e-03 | 4.80e-03 | 2.83e-03 | 22 |
| hsa030188 | Prostate | BPH | RNA degradation | 29/1718 | 79/8465 | 5.17e-04 | 2.67e-03 | 1.65e-03 | 29 |
| hsa0301813 | Prostate | BPH | RNA degradation | 29/1718 | 79/8465 | 5.17e-04 | 2.67e-03 | 1.65e-03 | 29 |
| hsa0301822 | Prostate | Tumor | RNA degradation | 30/1791 | 79/8465 | 4.48e-04 | 2.35e-03 | 1.46e-03 | 30 |
| hsa0301832 | Prostate | Tumor | RNA degradation | 30/1791 | 79/8465 | 4.48e-04 | 2.35e-03 | 1.46e-03 | 30 |
| Page: 1 |
Top |
Cell-cell communication analysis |
| Identification of potential cell-cell interactions between two cell types and their ligand-receptor pairs for different disease states |
| Ligand | Receptor | LRpair | Pathway | Tissue | Disease Stage |
| Page: 1 |
Top |
Single-cell gene regulatory network inference analysis |
| Find out the significant the regulons (TFs) and the target genes of each regulon across cell types for different disease states |
| TF | Cell Type | Tissue | Disease Stage | Target Gene | RSS | Regulon Activity |
| ∗The dot plots of a searched regulon are shown for all cell subpopulations in each disease state of each tissue based on the regulon specific score inferred using pySCENIC and by calculating the average expression. |
| Page: 1 |
Top |
Somatic mutation of malignant transformation related genes |
| Annotation of somatic variants for genes involved in malignant transformation |
| Hugo Symbol | Variant Class | Variant Classification | dbSNP RS | HGVSc | HGVSp | HGVSp Short | SWISSPROT | BIOTYPE | SIFT | PolyPhen | Tumor Sample Barcode | Tissue | Histology | Sex | Age | Stage | Therapy Types | Drugs | Outcome |
| CNOT1 | SNV | Missense_Mutation | c.6685C>A | p.His2229Asn | p.H2229N | A5YKK6 | protein_coding | tolerated(0.15) | benign(0.062) | TCGA-A8-A09A-01 | Breast | breast invasive carcinoma | Female | <65 | I/II | Hormone Therapy | tamoxiphen | SD | |
| CNOT1 | SNV | Missense_Mutation | c.811N>C | p.Glu271Gln | p.E271Q | A5YKK6 | protein_coding | tolerated(0.05) | benign(0.08) | TCGA-AN-A0FV-01 | Breast | breast invasive carcinoma | Female | <65 | I/II | Unknown | Unknown | SD | |
| CNOT1 | SNV | Missense_Mutation | novel | c.5214N>A | p.Asn1738Lys | p.N1738K | A5YKK6 | protein_coding | deleterious(0.02) | benign(0.392) | TCGA-AR-A0U0-01 | Breast | breast invasive carcinoma | Female | >=65 | I/II | Unknown | Unknown | SD |
| CNOT1 | SNV | Missense_Mutation | novel | c.2692N>A | p.Glu898Lys | p.E898K | A5YKK6 | protein_coding | deleterious(0) | probably_damaging(0.996) | TCGA-AR-A2LE-01 | Breast | breast invasive carcinoma | Female | >=65 | I/II | Hormone Therapy | tamoxiphen | PD |
| CNOT1 | SNV | Missense_Mutation | c.3662T>C | p.Leu1221Pro | p.L1221P | A5YKK6 | protein_coding | deleterious(0) | probably_damaging(0.978) | TCGA-BH-A18G-01 | Breast | breast invasive carcinoma | Female | >=65 | I/II | Unknown | Unknown | SD | |
| CNOT1 | SNV | Missense_Mutation | c.2545N>T | p.Asn849Tyr | p.N849Y | A5YKK6 | protein_coding | deleterious(0) | probably_damaging(0.994) | TCGA-BH-A1F5-01 | Breast | breast invasive carcinoma | Female | <65 | I/II | Unknown | Unknown | SD | |
| CNOT1 | SNV | Missense_Mutation | c.5563N>G | p.Leu1855Val | p.L1855V | A5YKK6 | protein_coding | deleterious(0) | benign(0.184) | TCGA-D8-A1J8-01 | Breast | breast invasive carcinoma | Female | >=65 | I/II | Hormone Therapy | nolvadex | SD | |
| CNOT1 | SNV | Missense_Mutation | c.4606N>A | p.Glu1536Lys | p.E1536K | A5YKK6 | protein_coding | deleterious(0) | probably_damaging(0.992) | TCGA-D8-A1J8-01 | Breast | breast invasive carcinoma | Female | >=65 | I/II | Hormone Therapy | nolvadex | SD | |
| CNOT1 | SNV | Missense_Mutation | c.2891G>A | p.Arg964Lys | p.R964K | A5YKK6 | protein_coding | tolerated(0.44) | benign(0.152) | TCGA-D8-A1XQ-01 | Breast | breast invasive carcinoma | Female | >=65 | I/II | Unknown | Unknown | SD | |
| CNOT1 | SNV | Missense_Mutation | c.3023N>G | p.Ser1008Cys | p.S1008C | A5YKK6 | protein_coding | deleterious(0.04) | possibly_damaging(0.527) | TCGA-LL-A73Y-01 | Breast | breast invasive carcinoma | Female | >=65 | I/II | Chemotherapy | taxotere | SD |
| Page: 1 2 3 4 5 6 7 8 9 10 11 12 13 14 15 16 17 18 19 20 21 22 23 24 25 26 27 28 29 30 |
Top |
Related drugs of malignant transformation related genes |
| Identification of chemicals and drugs interact with genes involved in malignant transfromation |
| (DGIdb 4.0) |
| Entrez ID | Symbol | Category | Interaction Types | Drug Claim Name | Drug Name | PMIDs |
| Page: 1 |

Copyright 2023-Present -The University of Texas Health Science Center at Houston |