| Tissue | Expression Dynamics | Abbreviation |
| Breast |  | IDC: Invasive ductal carcinoma |
| DCIS: Ductal carcinoma in situ |
| Precancer(BRCA1-mut): Precancerous lesion from BRCA1 mutation carriers |
| Cervix | 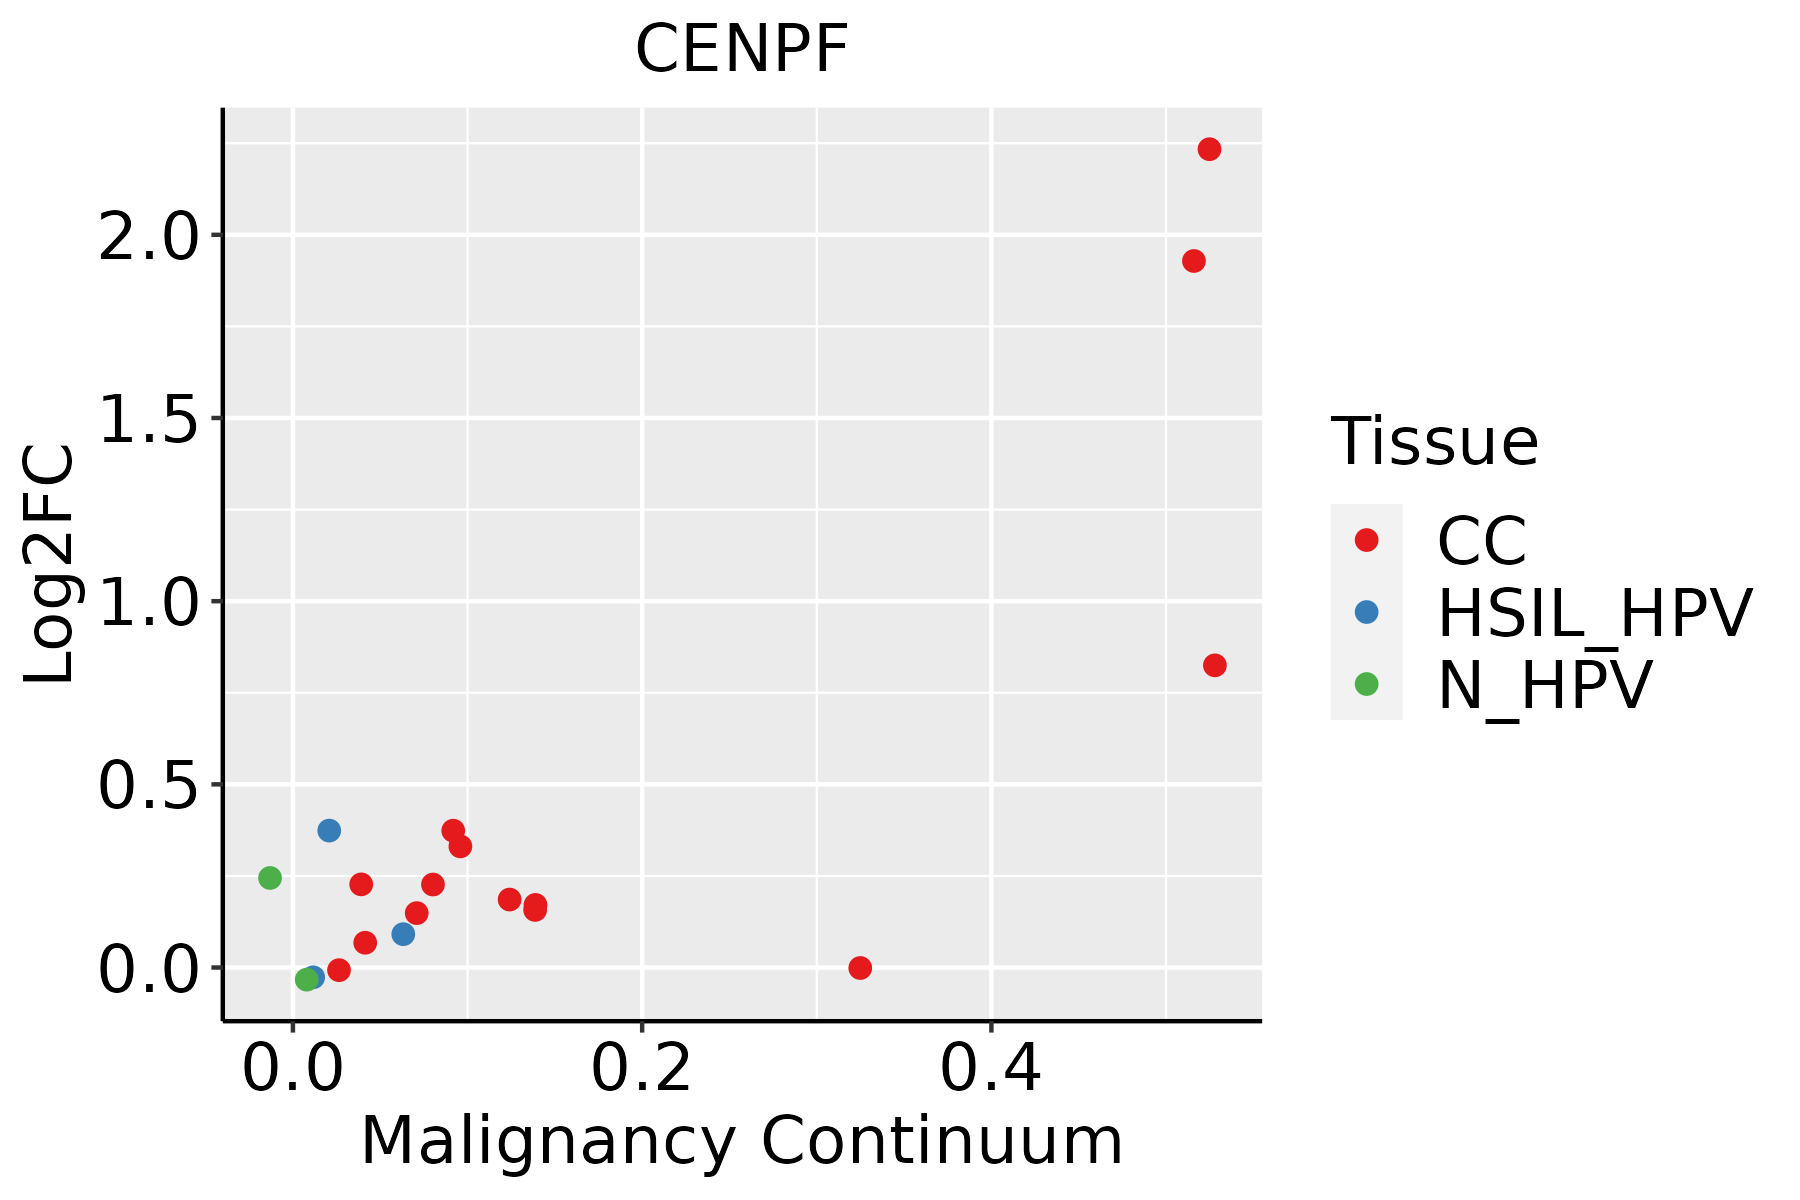 | CC: Cervix cancer |
| HSIL_HPV: HPV-infected high-grade squamous intraepithelial lesions |
| N_HPV: HPV-infected normal cervix |
| Colorectum (GSE201348) |  | FAP: Familial adenomatous polyposis |
| CRC: Colorectal cancer |
| Colorectum (HTA11) |  | AD: Adenomas |
| SER: Sessile serrated lesions |
| MSI-H: Microsatellite-high colorectal cancer |
| MSS: Microsatellite stable colorectal cancer |
| Esophagus |  | ESCC: Esophageal squamous cell carcinoma |
| HGIN: High-grade intraepithelial neoplasias |
| LGIN: Low-grade intraepithelial neoplasias |
| Liver | 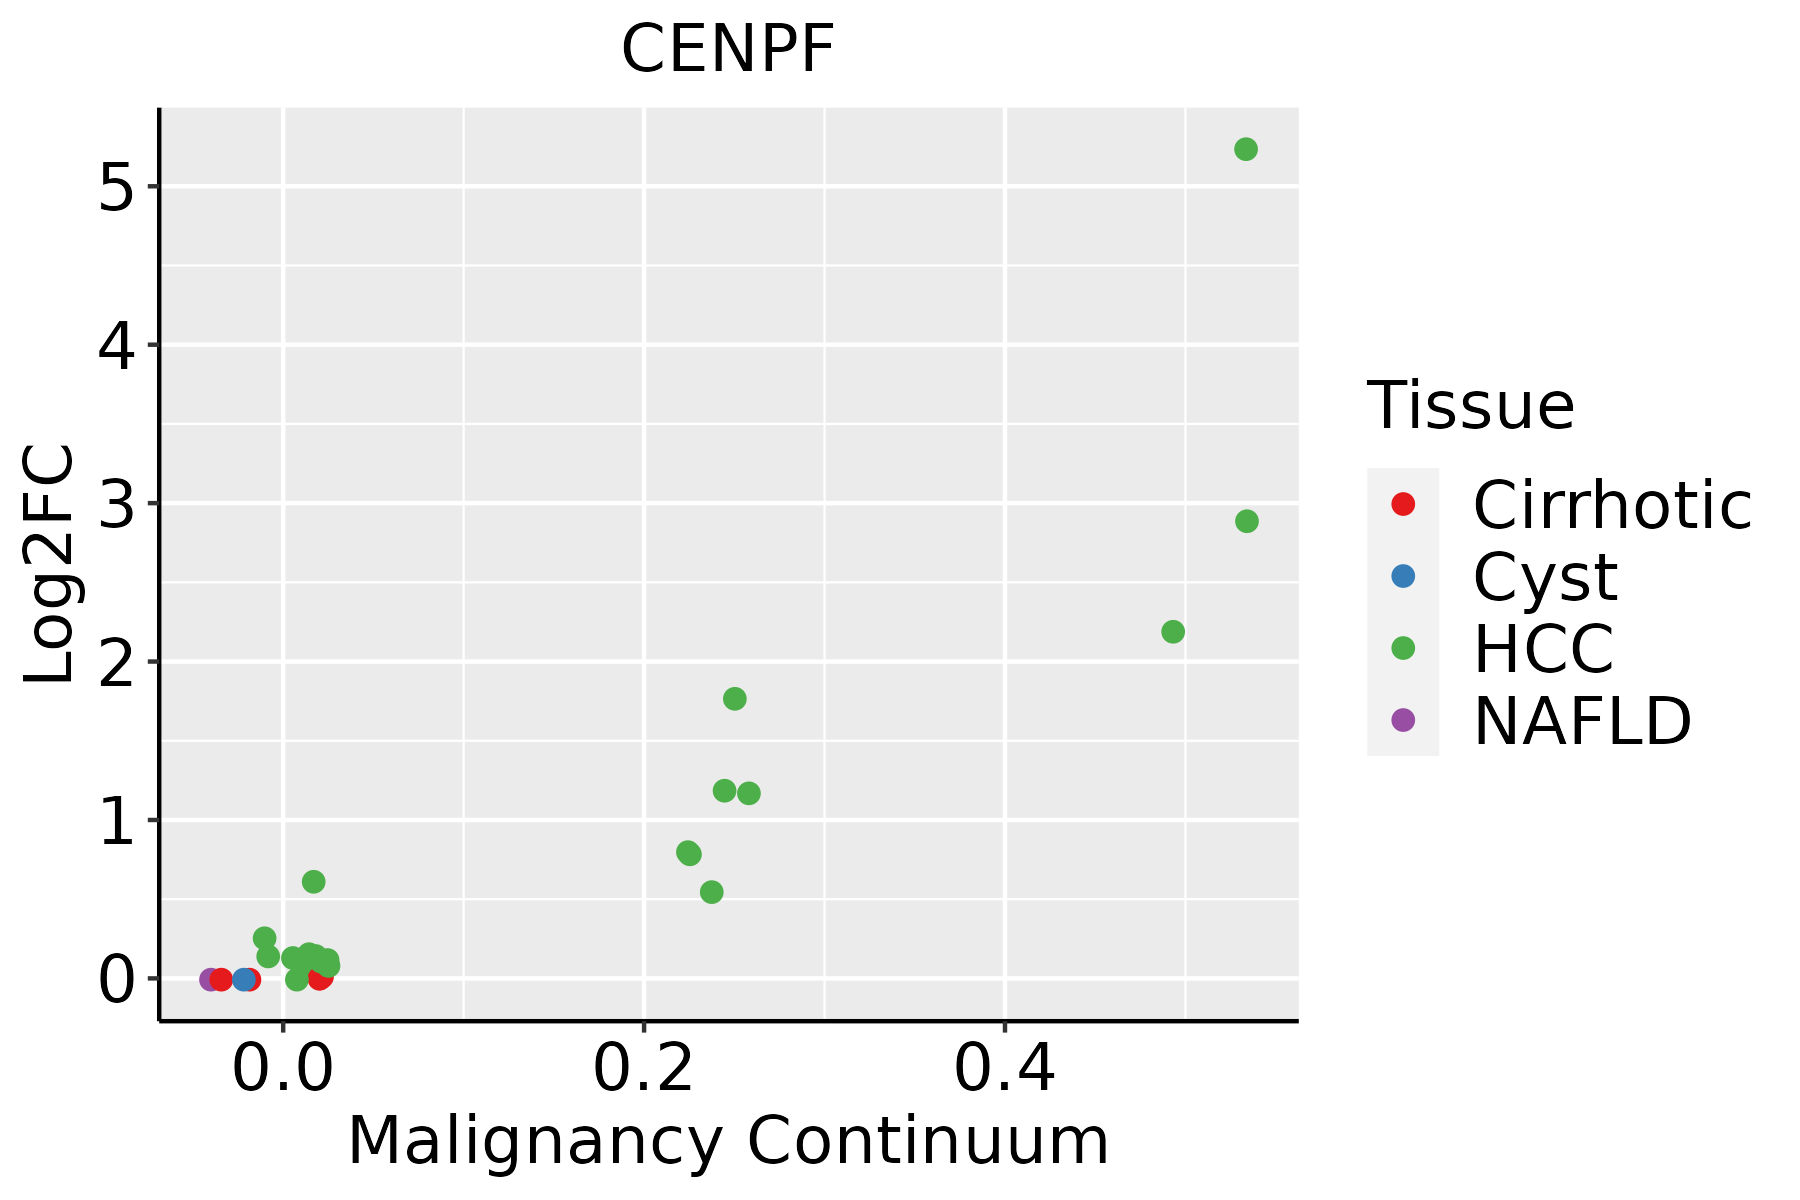 | HCC: Hepatocellular carcinoma |
| NAFLD: Non-alcoholic fatty liver disease |
| Oral Cavity | 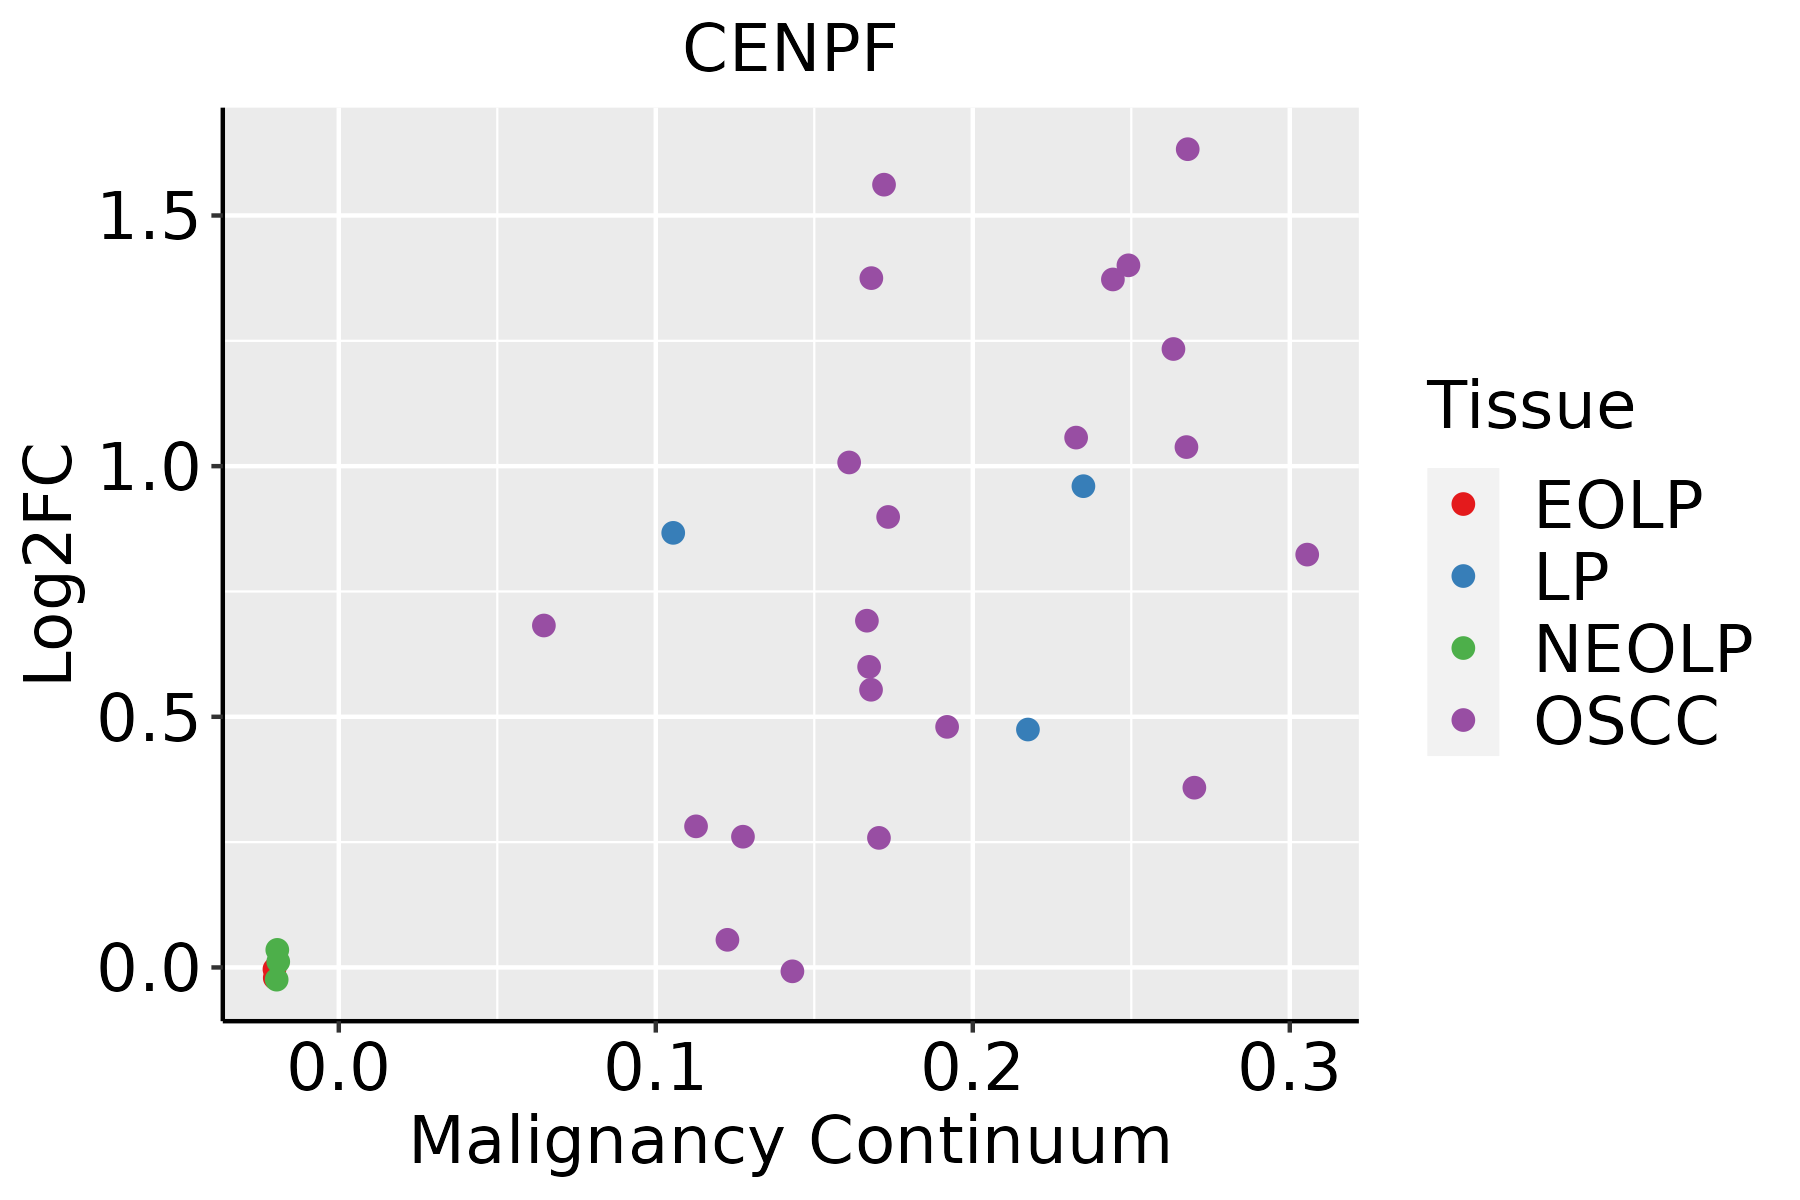 | EOLP: Erosive Oral lichen planus |
| LP: leukoplakia |
| NEOLP: Non-erosive oral lichen planus |
| OSCC: Oral squamous cell carcinoma |
| Skin | 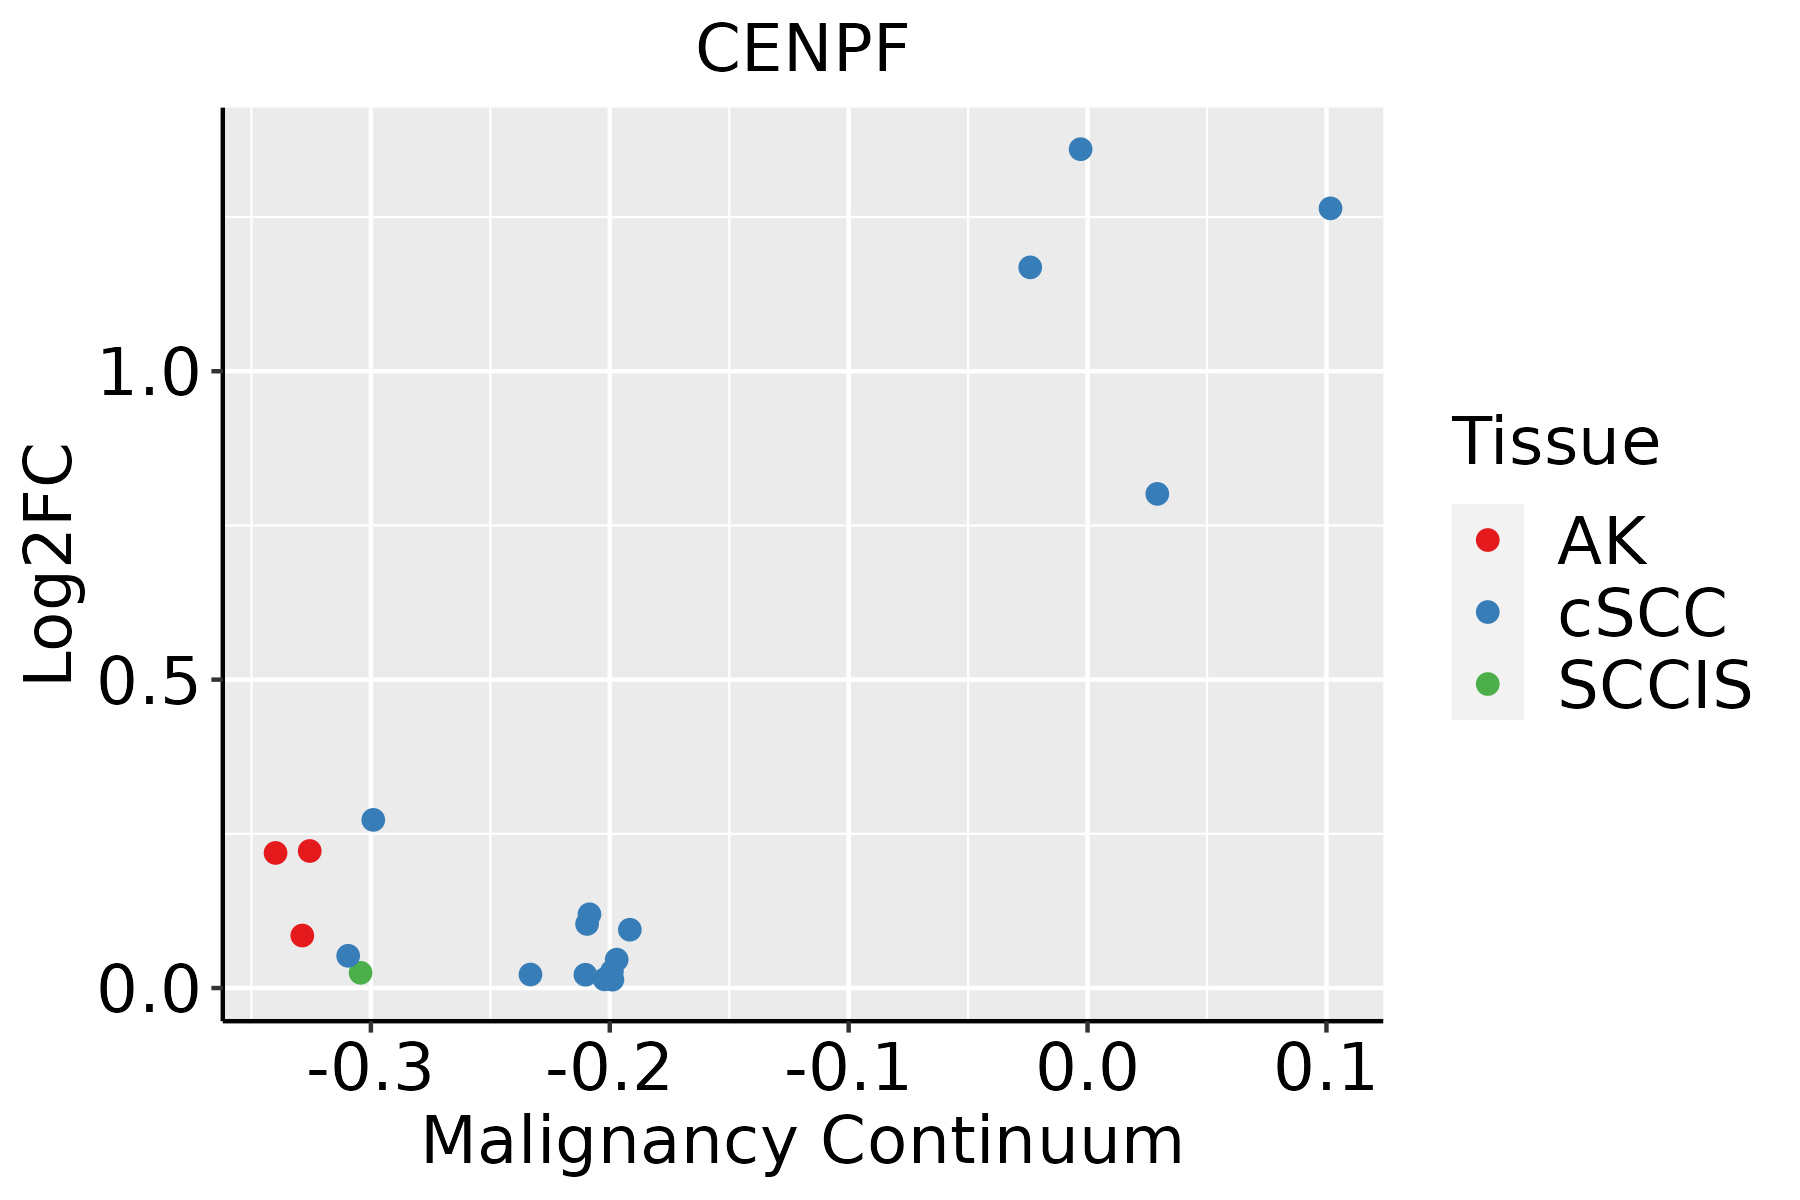 | AK: Actinic keratosis |
| cSCC: Cutaneous squamous cell carcinoma |
| SCCIS:squamous cell carcinoma in situ |
| Thyroid |  | ATC: Anaplastic thyroid cancer |
| HT: Hashimoto's thyroiditis |
| PTC: Papillary thyroid cancer |
| GO ID | Tissue | Disease Stage | Description | Gene Ratio | Bg Ratio | pvalue | p.adjust | Count |
| GO:00070935 | Skin | cSCC | mitotic cell cycle checkpoint | 54/4864 | 129/18723 | 5.99e-05 | 5.87e-04 | 54 |
| GO:19021003 | Skin | cSCC | negative regulation of metaphase/anaphase transition of cell cycle | 23/4864 | 42/18723 | 6.79e-05 | 6.58e-04 | 23 |
| GO:00519853 | Skin | cSCC | negative regulation of chromosome segregation | 24/4864 | 45/18723 | 8.34e-05 | 7.94e-04 | 24 |
| GO:19058193 | Skin | cSCC | negative regulation of chromosome separation | 24/4864 | 45/18723 | 8.34e-05 | 7.94e-04 | 24 |
| GO:00513832 | Skin | cSCC | kinetochore organization | 15/4864 | 23/18723 | 8.72e-05 | 8.21e-04 | 15 |
| GO:00718241 | Skin | cSCC | protein-DNA complex subunit organization | 87/4864 | 241/18723 | 3.09e-04 | 2.47e-03 | 87 |
| GO:0009410110 | Skin | cSCC | response to xenobiotic stimulus | 151/4864 | 462/18723 | 6.76e-04 | 4.82e-03 | 151 |
| GO:00345082 | Skin | cSCC | centromere complex assembly | 16/4864 | 30/18723 | 1.27e-03 | 8.19e-03 | 16 |
| GO:00513822 | Skin | cSCC | kinetochore assembly | 11/4864 | 18/18723 | 1.74e-03 | 1.06e-02 | 11 |
| GO:00103892 | Skin | cSCC | regulation of G2/M transition of mitotic cell cycle | 37/4864 | 94/18723 | 3.02e-03 | 1.67e-02 | 37 |
| GO:19027492 | Skin | cSCC | regulation of cell cycle G2/M phase transition | 38/4864 | 102/18723 | 7.85e-03 | 3.65e-02 | 38 |
| GO:014001416 | Thyroid | ATC | mitotic nuclear division | 171/6293 | 287/18723 | 1.13e-19 | 1.66e-17 | 171 |
| GO:003304423 | Thyroid | ATC | regulation of chromosome organization | 119/6293 | 187/18723 | 3.55e-17 | 3.40e-15 | 119 |
| GO:004477219 | Thyroid | ATC | mitotic cell cycle phase transition | 223/6293 | 424/18723 | 3.46e-16 | 2.88e-14 | 223 |
| GO:000007013 | Thyroid | ATC | mitotic sister chromatid segregation | 108/6293 | 168/18723 | 3.53e-16 | 2.90e-14 | 108 |
| GO:000734622 | Thyroid | ATC | regulation of mitotic cell cycle | 236/6293 | 457/18723 | 7.58e-16 | 5.92e-14 | 236 |
| GO:005165625 | Thyroid | ATC | establishment of organelle localization | 206/6293 | 390/18723 | 2.62e-15 | 1.84e-13 | 206 |
| GO:000081913 | Thyroid | ATC | sister chromatid segregation | 122/6293 | 202/18723 | 4.71e-15 | 3.17e-13 | 122 |
| GO:000705913 | Thyroid | ATC | chromosome segregation | 183/6293 | 346/18723 | 8.03e-14 | 4.23e-12 | 183 |
| GO:001063926 | Thyroid | ATC | negative regulation of organelle organization | 179/6293 | 348/18723 | 3.74e-12 | 1.50e-10 | 179 |
| Hugo Symbol | Variant Class | Variant Classification | dbSNP RS | HGVSc | HGVSp | HGVSp Short | SWISSPROT | BIOTYPE | SIFT | PolyPhen | Tumor Sample Barcode | Tissue | Histology | Sex | Age | Stage | Therapy Types | Drugs | Outcome |
| CENPF | SNV | Missense_Mutation | novel | c.3773N>C | p.Ile1258Thr | p.I1258T | P49454 | protein_coding | tolerated(0.56) | benign(0.007) | TCGA-3C-AALI-01 | Breast | breast invasive carcinoma | Female | <65 | I/II | Unspecific | Poly E | Complete Response |
| CENPF | SNV | Missense_Mutation | | c.2474N>T | p.Ser825Phe | p.S825F | P49454 | protein_coding | tolerated(0.41) | benign(0.187) | TCGA-5L-AAT1-01 | Breast | breast invasive carcinoma | Female | <65 | III/IV | Hormone Therapy | letrozol | SD |
| CENPF | SNV | Missense_Mutation | novel | c.6094N>G | p.His2032Asp | p.H2032D | P49454 | protein_coding | tolerated(0.33) | benign(0.007) | TCGA-5L-AAT1-01 | Breast | breast invasive carcinoma | Female | <65 | III/IV | Hormone Therapy | letrozol | SD |
| CENPF | SNV | Missense_Mutation | novel | c.938N>G | p.Asn313Ser | p.N313S | P49454 | protein_coding | tolerated(0.09) | benign(0.105) | TCGA-A7-A4SD-01 | Breast | breast invasive carcinoma | Female | <65 | I/II | Chemotherapy | taxotere | CR |
| CENPF | SNV | Missense_Mutation | rs555088086 | c.1879N>A | p.Glu627Lys | p.E627K | P49454 | protein_coding | deleterious(0.05) | possibly_damaging(0.884) | TCGA-A8-A08G-01 | Breast | breast invasive carcinoma | Female | <65 | I/II | Chemotherapy | 5-fluorouracil | CR |
| CENPF | SNV | Missense_Mutation | novel | c.41N>T | p.Thr14Ile | p.T14I | P49454 | protein_coding | deleterious(0.02) | benign(0.281) | TCGA-A8-A09A-01 | Breast | breast invasive carcinoma | Female | <65 | I/II | Hormone Therapy | tamoxiphen | SD |
| CENPF | SNV | Missense_Mutation | | c.830N>T | p.Pro277Leu | p.P277L | P49454 | protein_coding | tolerated(0.09) | benign(0.001) | TCGA-A8-A0A7-01 | Breast | breast invasive carcinoma | Female | <65 | I/II | Unknown | Unknown | SD |
| CENPF | SNV | Missense_Mutation | | c.3035C>T | p.Ser1012Leu | p.S1012L | P49454 | protein_coding | tolerated(0.12) | benign(0.386) | TCGA-AC-A23H-01 | Breast | breast invasive carcinoma | Female | >=65 | I/II | Unknown | Unknown | PD |
| CENPF | SNV | Missense_Mutation | novel | c.5984A>C | p.Gln1995Pro | p.Q1995P | P49454 | protein_coding | deleterious(0.01) | benign(0.317) | TCGA-AN-A046-01 | Breast | breast invasive carcinoma | Female | >=65 | I/II | Unknown | Unknown | SD |
| CENPF | SNV | Missense_Mutation | novel | c.9248N>A | p.Ser3083Asn | p.S3083N | P49454 | protein_coding | tolerated(0.14) | benign(0.297) | TCGA-AN-A0AK-01 | Breast | breast invasive carcinoma | Female | >=65 | I/II | Unknown | Unknown | SD |


