Schematic overview of the cellular and molecular mechanisms involved in the cancer progression, including the proposed cellular and molecular mechanisms in cancer cells trajectory. AT1: alveolar type 1 cells; AT2: alveolar type 2 cells; AAH: atypical adenomatous hyperplasia; AIS: adenocarcinoma in situ; MIA: minimally invasive adenocarcinoma; IA: invasive adenocarcinoma; EMT: epithelial-mesenchymal transition

Home

Download

Statistics

Help

Contact

Center for Computational Systems Medicine
leaf

Gene summary

leaf

Malignant transformation analysis

leaf

Malignant transformation related pathway analysis

leaf

Cell-cell communication analysis

leaf

Single-cell gene regulatory network inference analysis

leaf

Somatic mutation of malignant transformation related genes

leaf

Related drugs of malignant transformation related genes

Gene: CDK5RAP3

Gene summary for CDK5RAP3

check button Gene summary.

Gene informationSpeciesHuman
Gene symbol

CDK5RAP3

Gene ID

80279

Gene nameCDK5 regulatory subunit associated protein 3
Gene AliasC53
Cytomap17q21.32
Gene Typeprotein-coding
GO ID

GO:0000075

UniProtAcc

Q96JB5


Top

Malignant transformation analysis

check button Identification of the aberrant gene expression in precancerous and cancerous lesions by comparing the gene expression of stem-like cells in diseased tissues with normal stem cells
check button Malignant transformation involving gene list.
Entrez IDSymbolReplicatesSpeciesOrganTissueAdj P-valueLog2FCMalignancy
80279CDK5RAP3HTA11_2487_2000001011HumanColorectumSER5.15e-031.88e-01-0.1808
80279CDK5RAP3HTA11_78_2000001011HumanColorectumAD3.71e-032.30e-01-0.1088
80279CDK5RAP3HTA11_347_2000001011HumanColorectumAD2.44e-072.32e-01-0.1954
80279CDK5RAP3HTA11_411_2000001011HumanColorectumSER2.94e-024.83e-01-0.2602
80279CDK5RAP3HTA11_83_2000001011HumanColorectumSER3.04e-031.89e-01-0.1526
80279CDK5RAP3HTA11_696_2000001011HumanColorectumAD9.34e-042.48e-01-0.1464
80279CDK5RAP3HTA11_1391_2000001011HumanColorectumAD3.82e-083.86e-01-0.059
80279CDK5RAP3HTA11_866_3004761011HumanColorectumAD1.65e-052.61e-010.096
80279CDK5RAP3HTA11_4255_2000001011HumanColorectumSER4.01e-032.84e-010.0446
80279CDK5RAP3HTA11_99999970781_79442HumanColorectumMSS5.76e-042.95e-010.294
80279CDK5RAP3HTA11_99999971662_82457HumanColorectumMSS2.02e-115.41e-010.3859
80279CDK5RAP3HTA11_99999974143_84620HumanColorectumMSS2.06e-084.05e-010.3005
80279CDK5RAP3A015-C-203HumanColorectumFAP3.80e-063.77e-01-0.1294
80279CDK5RAP3A015-C-006HumanColorectumFAP2.12e-075.33e-01-0.0994
80279CDK5RAP3A015-C-104HumanColorectumFAP1.22e-084.20e-01-0.1899
80279CDK5RAP3A018-E-020HumanColorectumFAP6.60e-033.23e-01-0.2034
80279CDK5RAP3LZE2THumanEsophagusESCC2.94e-103.56e-010.082
80279CDK5RAP3LZE4THumanEsophagusESCC4.96e-122.06e-010.0811
80279CDK5RAP3LZE5THumanEsophagusESCC2.26e-053.10e-010.0514
80279CDK5RAP3LZE7THumanEsophagusESCC4.23e-116.73e-010.0667
Page: 1 2 3 4 5 6 7 8 

check button Transcriptomic changes along malignancy continuum.
TissueExpression DynamicsAbbreviation
Colorectum (GSE201348)The image shows the transcriptomic changes along malignancy continuum.log2FC in expression of this searched gene in stem-like cells from each diseased tissue sample relative to stem-like cells in normal samples in each tissue plotted against the malignancy continuum. Samples are colored based on if they are from different disease stage.FAP: Familial adenomatous polyposis
CRC: Colorectal cancer
Colorectum (HTA11)The image shows the transcriptomic changes along malignancy continuum.log2FC in expression of this searched gene in stem-like cells from each diseased tissue sample relative to stem-like cells in normal samples in each tissue plotted against the malignancy continuum. Samples are colored based on if they are from different disease stage.AD: Adenomas
SER: Sessile serrated lesions
MSI-H: Microsatellite-high colorectal cancer
MSS: Microsatellite stable colorectal cancer
EsophagusThe image shows the transcriptomic changes along malignancy continuum.log2FC in expression of this searched gene in stem-like cells from each diseased tissue sample relative to stem-like cells in normal samples in each tissue plotted against the malignancy continuum. Samples are colored based on if they are from different disease stage.ESCC: Esophageal squamous cell carcinoma
HGIN: High-grade intraepithelial neoplasias
LGIN: Low-grade intraepithelial neoplasias
LiverThe image shows the transcriptomic changes along malignancy continuum.log2FC in expression of this searched gene in stem-like cells from each diseased tissue sample relative to stem-like cells in normal samples in each tissue plotted against the malignancy continuum. Samples are colored based on if they are from different disease stage.HCC: Hepatocellular carcinoma
NAFLD: Non-alcoholic fatty liver disease
Oral CavityThe image shows the transcriptomic changes along malignancy continuum.log2FC in expression of this searched gene in stem-like cells from each diseased tissue sample relative to stem-like cells in normal samples in each tissue plotted against the malignancy continuum. Samples are colored based on if they are from different disease stage.
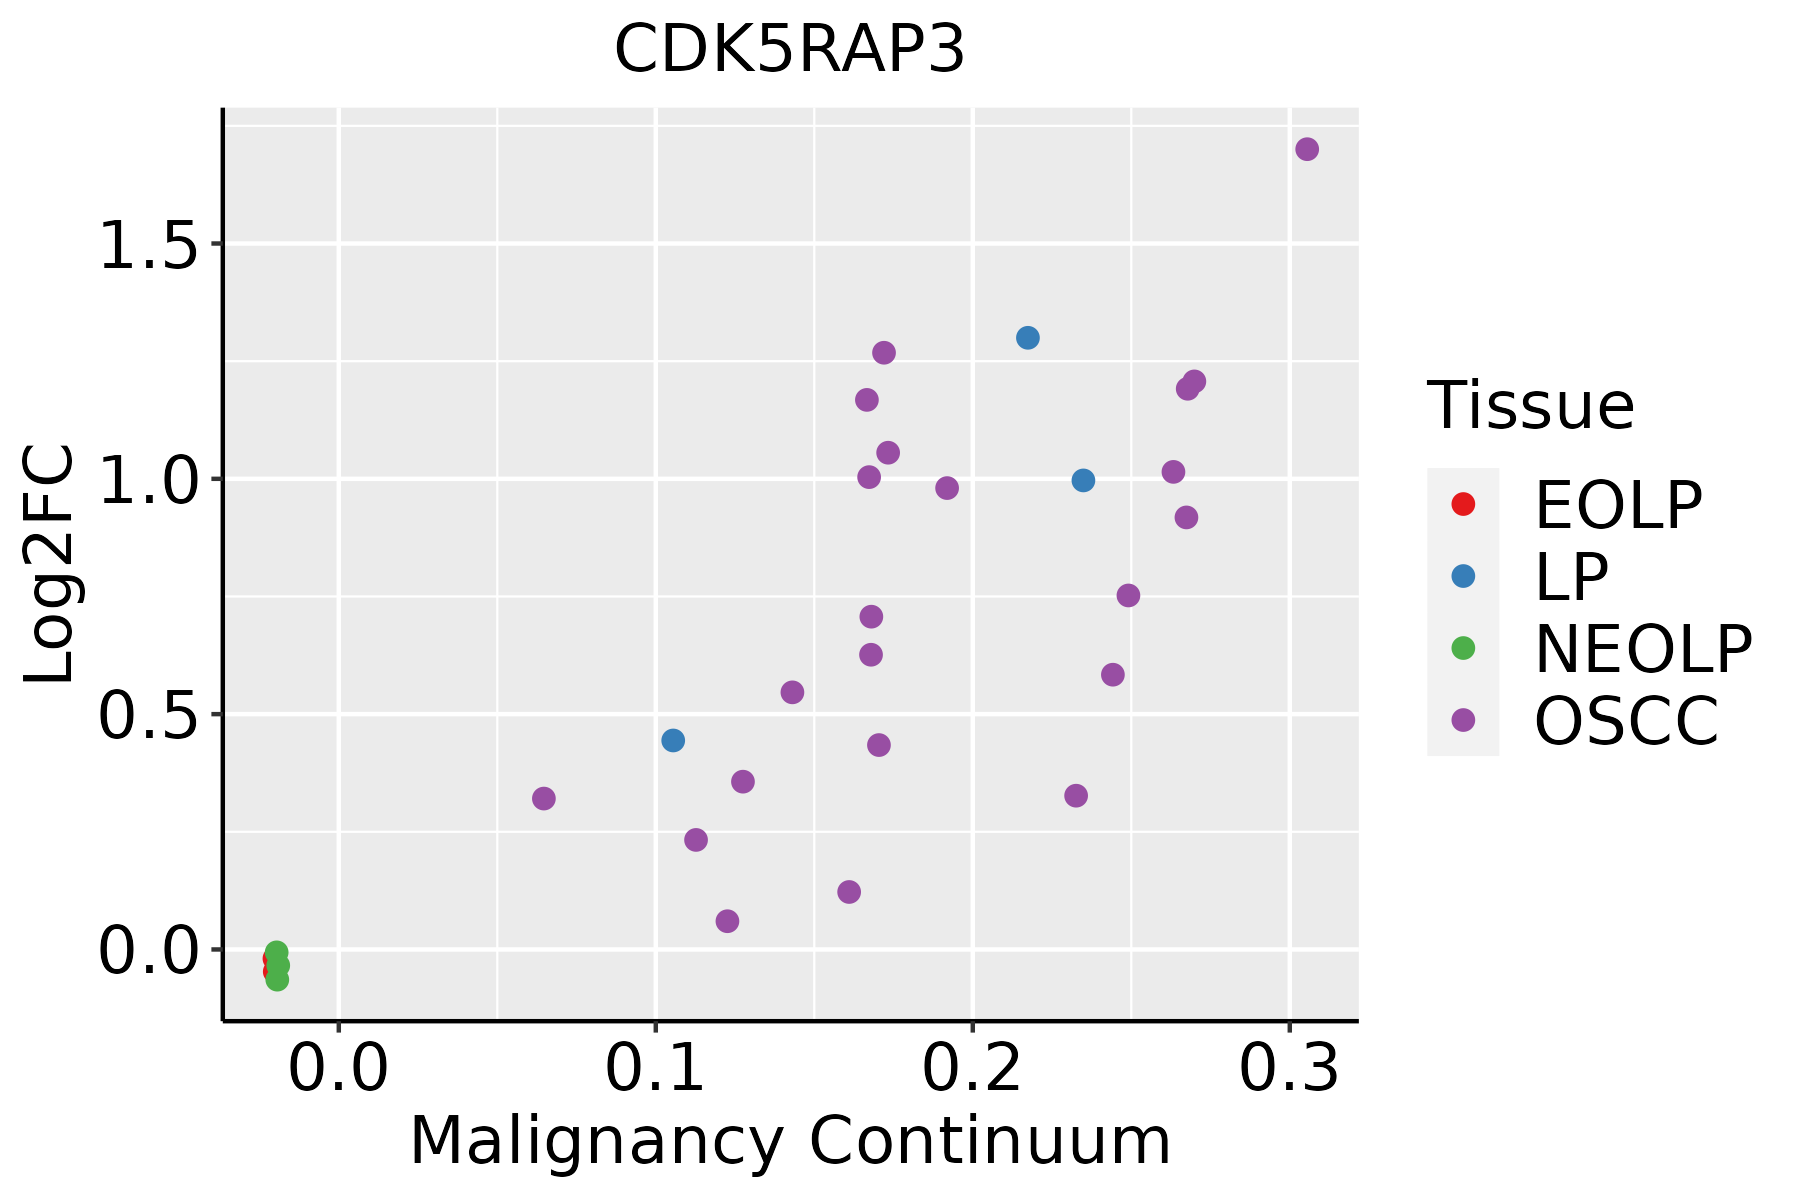
EOLP: Erosive Oral lichen planus
LP: leukoplakia
NEOLP: Non-erosive oral lichen planus
OSCC: Oral squamous cell carcinoma
ProstateThe image shows the transcriptomic changes along malignancy continuum.log2FC in expression of this searched gene in stem-like cells from each diseased tissue sample relative to stem-like cells in normal samples in each tissue plotted against the malignancy continuum. Samples are colored based on if they are from different disease stage.
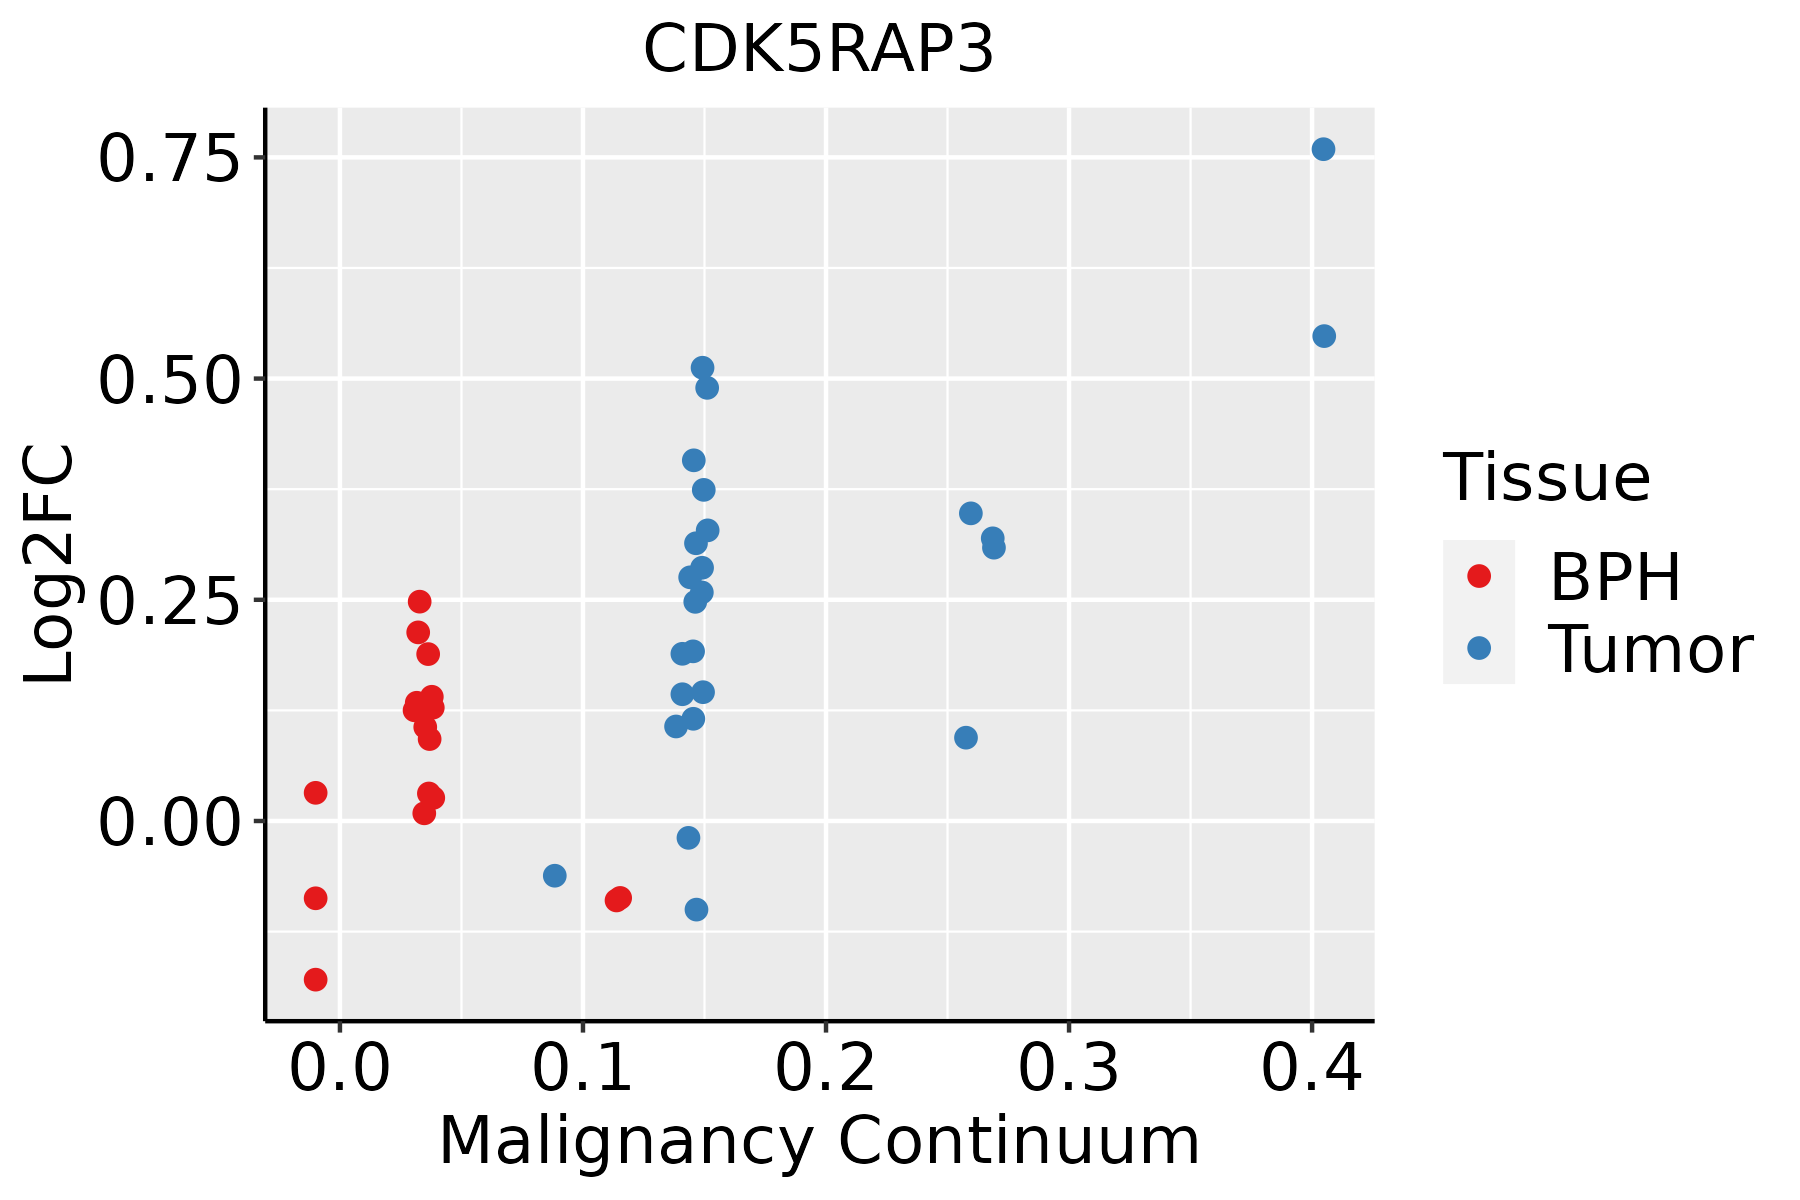
BPH: Benign Prostatic Hyperplasia
SkinThe image shows the transcriptomic changes along malignancy continuum.log2FC in expression of this searched gene in stem-like cells from each diseased tissue sample relative to stem-like cells in normal samples in each tissue plotted against the malignancy continuum. Samples are colored based on if they are from different disease stage.
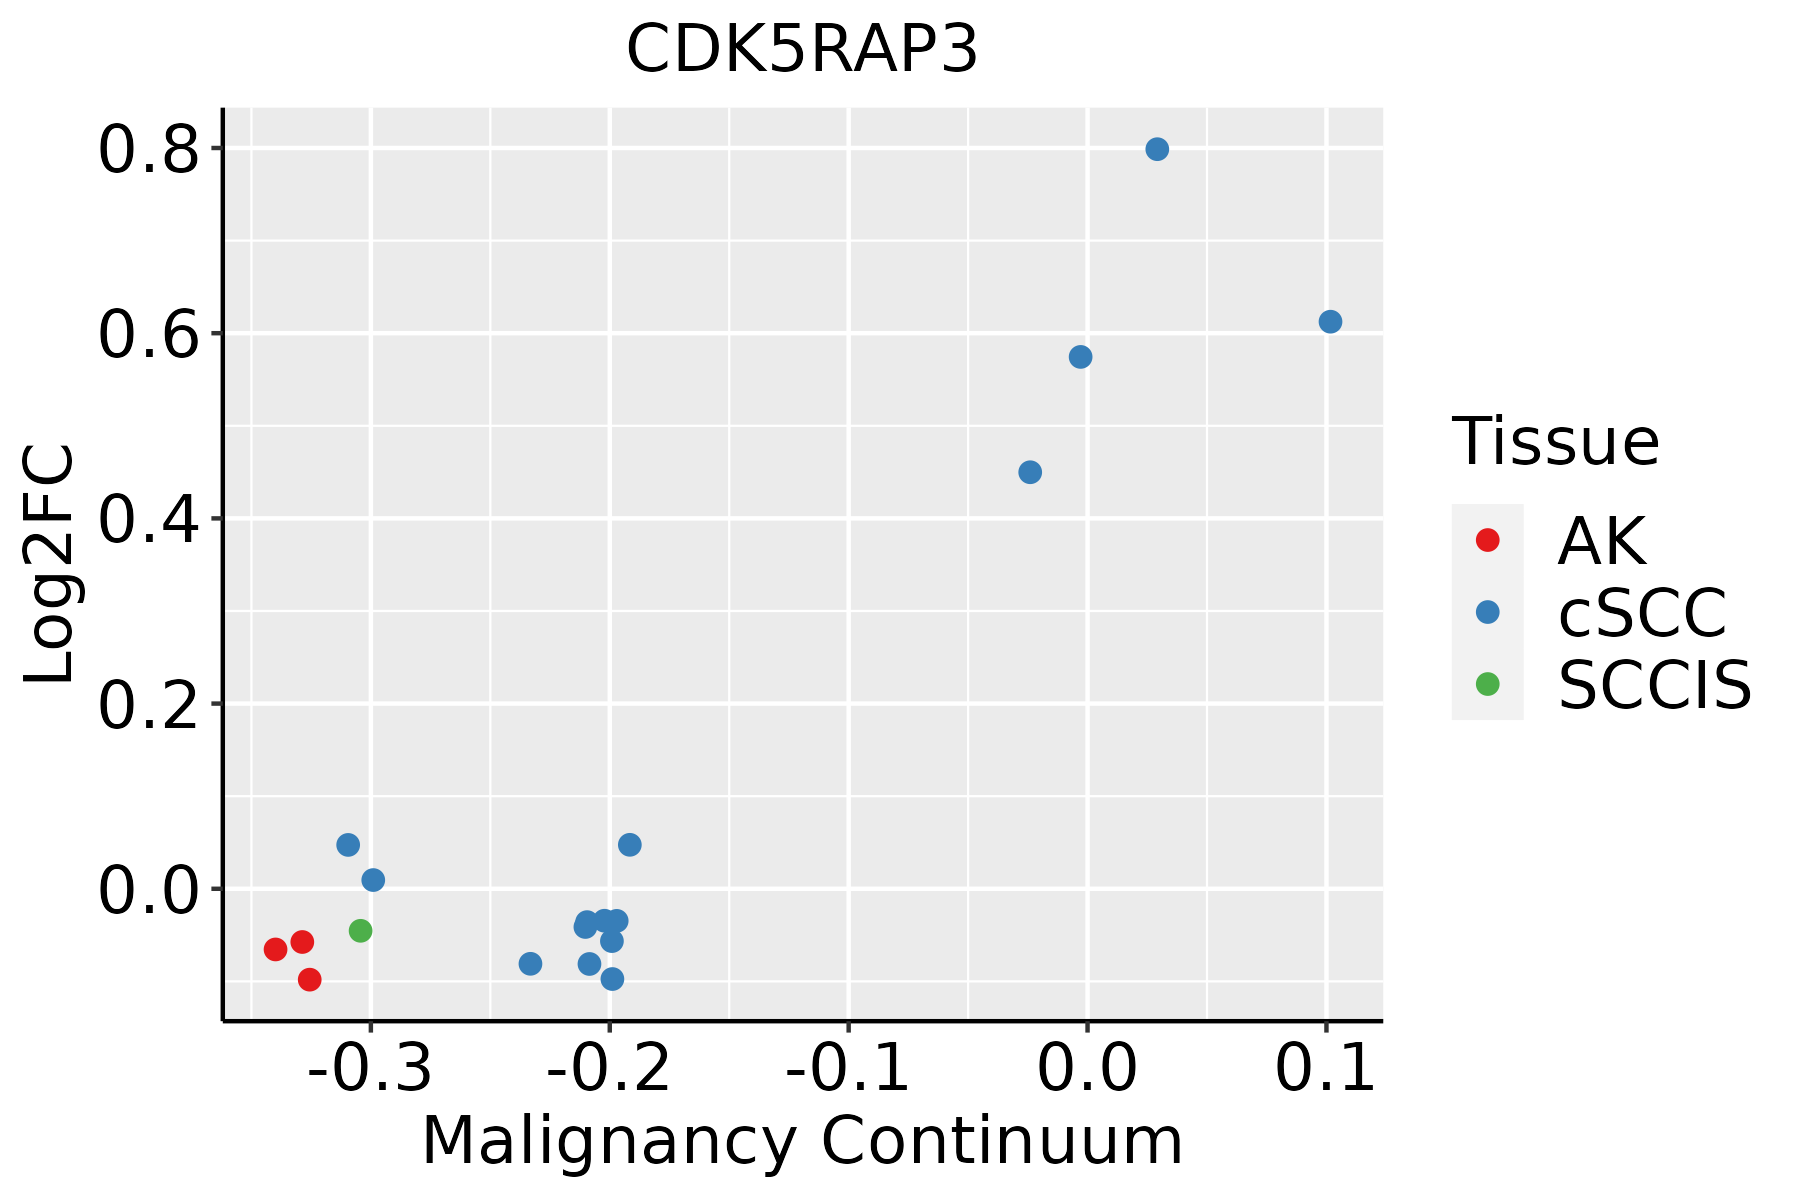
AK: Actinic keratosis
cSCC: Cutaneous squamous cell carcinoma
SCCIS:squamous cell carcinoma in situ
ThyroidThe image shows the transcriptomic changes along malignancy continuum.log2FC in expression of this searched gene in stem-like cells from each diseased tissue sample relative to stem-like cells in normal samples in each tissue plotted against the malignancy continuum. Samples are colored based on if they are from different disease stage.ATC: Anaplastic thyroid cancer
HT: Hashimoto's thyroiditis
PTC: Papillary thyroid cancer
∗log2FC in expression of this searched gene in stem-like cells from each diseased tissue sample relative to stem-like cells in normal samples in each tissue plotted against the malignancy continuum. Samples are colored based on if they are from different disease stage.

Top

Malignant transformation related pathway analysis

check buttonFind out the enriched GO biological processes and KEGG pathways involved in transition from healthy to precancer to cancer
check button Figure of enriched GO biological processes.
TissueDisease StageEnriched GO biological Processes
ColorectumADGO analysis - Figure of enriched GO biological processes: Top 15 enriched GO BP terms are showed in the bar plot of each disease state in each tissue. Each row represents a significant GO biological process which is colored according to the -log10(p.adjust).
ColorectumSERGO analysis - Figure of enriched GO biological processes: Top 15 enriched GO BP terms are showed in the bar plot of each disease state in each tissue. Each row represents a significant GO biological process which is colored according to the -log10(p.adjust).
ColorectumMSSGO analysis - Figure of enriched GO biological processes: Top 15 enriched GO BP terms are showed in the bar plot of each disease state in each tissue. Each row represents a significant GO biological process which is colored according to the -log10(p.adjust).
ColorectumMSI-HGO analysis - Figure of enriched GO biological processes: Top 15 enriched GO BP terms are showed in the bar plot of each disease state in each tissue. Each row represents a significant GO biological process which is colored according to the -log10(p.adjust).
ColorectumFAPGO analysis - Figure of enriched GO biological processes: Top 15 enriched GO BP terms are showed in the bar plot of each disease state in each tissue. Each row represents a significant GO biological process which is colored according to the -log10(p.adjust).
∗Top 15 enriched GO BP terms are showed in the bar plot of each disease state in each tissue. Each row represents a significant GO biological process which is colored according to the -log10(p.adjust).
Page: 1 2 3 4 5 6 7 8 9 

check button Enriched GO biological processes.
GO IDTissueDisease StageDescriptionGene RatioBg Ratiopvaluep.adjustCount
GO:190336222LiverHCCregulation of cellular protein catabolic process182/7958255/187235.91e-218.52e-19182
GO:002241112LiverHCCcellular component disassembly282/7958443/187231.02e-191.38e-17282
GO:003596612LiverHCCresponse to topologically incorrect protein123/7958159/187232.60e-193.44e-17123
GO:003450421LiverHCCprotein localization to nucleus194/7958290/187232.84e-172.85e-15194
GO:190332022LiverHCCregulation of protein modification by small protein conjugation or removal167/7958242/187234.99e-174.72e-15167
GO:000698612LiverHCCresponse to unfolded protein103/7958137/187236.50e-154.48e-13103
GO:000188922LiverHCCliver development108/7958147/187232.16e-141.41e-12108
GO:003596712LiverHCCcellular response to topologically incorrect protein89/7958116/187235.61e-143.39e-1289
GO:006100822LiverHCChepaticobiliary system development109/7958150/187235.72e-143.42e-12109
GO:003139622LiverHCCregulation of protein ubiquitination142/7958210/187231.39e-137.81e-12142
GO:001056322LiverHCCnegative regulation of phosphorus metabolic process259/7958442/187234.29e-121.92e-10259
GO:004593622LiverHCCnegative regulation of phosphate metabolic process258/7958441/187236.00e-122.60e-10258
GO:000989522LiverHCCnegative regulation of catabolic process196/7958320/187237.98e-123.35e-10196
GO:003133022LiverHCCnegative regulation of cellular catabolic process164/7958262/187233.52e-111.35e-09164
GO:004232622LiverHCCnegative regulation of phosphorylation227/7958385/187233.98e-111.52e-09227
GO:190018212LiverHCCpositive regulation of protein localization to nucleus67/795887/187235.43e-112.00e-0967
GO:005134822LiverHCCnegative regulation of transferase activity166/7958268/187238.97e-113.18e-09166
GO:190018012LiverHCCregulation of protein localization to nucleus95/7958136/187239.26e-113.26e-0995
GO:003462012LiverHCCcellular response to unfolded protein71/795896/187233.70e-101.22e-0871
GO:007233122LiverHCCsignal transduction by p53 class mediator108/7958163/187237.14e-102.23e-08108
Page: 1 2 3 4 5 6 7 8 9 10 11 12 13 14 15 16 17 18 19 20 21 22 23 24 25 26 27 28 29 30 31 32 33 34 35 36 37 38 39 40 41 42 43 

check button Enriched KEGG pathways.
Pathway IDTissueDisease StageDescriptionGene RatioBg Ratiopvaluep.adjustqvalueCount
Page: 1 

Top

Cell-cell communication analysis

check buttonIdentification of potential cell-cell interactions between two cell types and their ligand-receptor pairs for different disease states
LigandReceptorLRpairPathwayTissueDisease Stage
Page: 1 

Top

Single-cell gene regulatory network inference analysis

check buttonFind out the significant the regulons (TFs) and the target genes of each regulon across cell types for different disease states
TFCell TypeTissueDisease StageTarget GeneRSSRegulon Activity
∗The dot plots of a searched regulon are shown for all cell subpopulations in each disease state of each tissue based on the regulon specific score inferred using pySCENIC and by calculating the average expression.
Page: 1 

Top

Somatic mutation of malignant transformation related genes

check buttonAnnotation of somatic variants for genes involved in malignant transformation
Hugo SymbolVariant ClassVariant ClassificationdbSNP RSHGVScHGVSpHGVSp ShortSWISSPROTBIOTYPESIFTPolyPhenTumor Sample BarcodeTissueHistologySexAgeStageTherapy TypesDrugsOutcome
CDK5RAP3SNVMissense_Mutationnovelc.814N>Tp.Pro272Serp.P272SQ96JB5protein_codingdeleterious(0)probably_damaging(0.999)TCGA-A2-A0D1-01Breastbreast invasive carcinomaFemale>=65I/IIChemotherapytaxotereSD
CDK5RAP3SNVMissense_Mutationnovelc.1164C>Ap.Phe388Leup.F388LQ96JB5protein_codingdeleterious(0.03)probably_damaging(0.997)TCGA-A2-A3XT-01Breastbreast invasive carcinomaFemale<65I/IIChemotherapycyclophosphamidePR
CDK5RAP3SNVMissense_Mutationnovelc.371N>Gp.Glu124Glyp.E124GQ96JB5protein_codingdeleterious(0)possibly_damaging(0.894)TCGA-C8-A273-01Breastbreast invasive carcinomaFemale<65I/IIHormone TherapytamoxiphenSD
CDK5RAP3SNVMissense_Mutationnovelc.371N>Gp.Glu124Glyp.E124GQ96JB5protein_codingdeleterious(0)possibly_damaging(0.894)TCGA-E9-A1NF-01Breastbreast invasive carcinomaFemale<65I/IIChemotherapydoxorubicinPD
CDK5RAP3insertionFrame_Shift_Insnovelc.354_355insGGCCCp.Met119GlyfsTer3p.M119Gfs*3Q96JB5protein_codingTCGA-BH-A0DS-01Breastbreast invasive carcinomaFemale>=65III/IVChemotherapycyclophosphamideSD
CDK5RAP3insertionNonsense_Mutationnovelc.355_356insGACTTTGAGAGGTCAGTCCCATp.Met119ArgfsTer3p.M119Rfs*3Q96JB5protein_codingTCGA-BH-A0DS-01Breastbreast invasive carcinomaFemale>=65III/IVChemotherapycyclophosphamideSD
CDK5RAP3deletionFrame_Shift_Delnovelc.528delNp.Ala177GlnfsTer32p.A177Qfs*32Q96JB5protein_codingTCGA-D8-A27V-01Breastbreast invasive carcinomaFemale<65I/IIHormone TherapytamoxiphenSD
CDK5RAP3SNVMissense_Mutationc.832C>Tp.Pro278Serp.P278SQ96JB5protein_codingdeleterious(0.01)probably_damaging(0.999)TCGA-C5-A7CO-01Cervixcervical & endocervical cancerFemale>=65I/IIChemotherapycisplatinSD
CDK5RAP3SNVMissense_Mutationc.530N>Ap.Ala177Glup.A177EQ96JB5protein_codingtolerated(0.94)benign(0.148)TCGA-DR-A0ZM-01Cervixcervical & endocervical cancerFemale<65III/IVUnspecificCisplatinSD
CDK5RAP3SNVMissense_Mutationc.450G>Tp.Glu150Aspp.E150DQ96JB5protein_codingdeleterious(0)probably_damaging(0.998)TCGA-AA-A010-01Colorectumcolon adenocarcinomaFemale<65I/IIChemotherapyfolinicCR
Page: 1 2 3 4 

Top

Related drugs of malignant transformation related genes

check buttonIdentification of chemicals and drugs interact with genes involved in malignant transfromation
(DGIdb 4.0)
Entrez IDSymbolCategoryInteraction TypesDrug Claim NameDrug NamePMIDs
Page: 1