
|
|||||
|
 | |
| |
| |
| |
| |
| |
|
Gene: VCL |
Gene summary for VCL |
| Gene information | Species | Human | Gene symbol | VCL | Gene ID | 7414 |
| Gene name | vinculin | |
| Gene Alias | CMD1W | |
| Cytomap | 10q22.2 | |
| Gene Type | protein-coding | GO ID | GO:0000902 | UniProtAcc | A0A024QZN4 |
Top |
Malignant transformation analysis |
| Identification of the aberrant gene expression in precancerous and cancerous lesions by comparing the gene expression of stem-like cells in diseased tissues with normal stem cells |
| Entrez ID | Symbol | Replicates | Species | Organ | Tissue | Adj P-value | Log2FC | Malignancy |
| 7414 | VCL | CCI_1 | Human | Cervix | CC | 5.95e-08 | 7.44e-01 | 0.528 |
| 7414 | VCL | CCI_2 | Human | Cervix | CC | 7.48e-12 | 1.10e+00 | 0.5249 |
| 7414 | VCL | Tumor | Human | Cervix | CC | 9.01e-06 | 2.17e-01 | 0.1241 |
| 7414 | VCL | sample3 | Human | Cervix | CC | 1.42e-06 | 2.66e-01 | 0.1387 |
| 7414 | VCL | T1 | Human | Cervix | CC | 1.10e-03 | 2.99e-01 | 0.0918 |
| 7414 | VCL | T3 | Human | Cervix | CC | 6.91e-08 | 2.94e-01 | 0.1389 |
| 7414 | VCL | HTA11_3410_2000001011 | Human | Colorectum | AD | 3.13e-04 | -4.23e-01 | 0.0155 |
| 7414 | VCL | HTA11_99999974143_84620 | Human | Colorectum | MSS | 1.79e-03 | -3.66e-01 | 0.3005 |
| 7414 | VCL | F007 | Human | Colorectum | FAP | 1.10e-02 | -4.36e-01 | 0.1176 |
| 7414 | VCL | A015-C-203 | Human | Colorectum | FAP | 2.86e-18 | -2.62e-01 | -0.1294 |
| 7414 | VCL | A015-C-204 | Human | Colorectum | FAP | 3.49e-04 | -2.54e-01 | -0.0228 |
| 7414 | VCL | A002-C-201 | Human | Colorectum | FAP | 2.84e-09 | -1.70e-01 | 0.0324 |
| 7414 | VCL | A002-C-203 | Human | Colorectum | FAP | 3.89e-03 | -2.02e-01 | 0.2786 |
| 7414 | VCL | A001-C-119 | Human | Colorectum | FAP | 1.67e-08 | 2.86e-01 | -0.1557 |
| 7414 | VCL | A001-C-108 | Human | Colorectum | FAP | 1.92e-10 | -8.94e-02 | -0.0272 |
| 7414 | VCL | A002-C-205 | Human | Colorectum | FAP | 4.56e-15 | -2.41e-01 | -0.1236 |
| 7414 | VCL | A001-C-104 | Human | Colorectum | FAP | 6.57e-03 | 3.48e-02 | 0.0184 |
| 7414 | VCL | A015-C-006 | Human | Colorectum | FAP | 4.00e-08 | -3.63e-01 | -0.0994 |
| 7414 | VCL | A015-C-106 | Human | Colorectum | FAP | 3.49e-07 | -1.98e-01 | -0.0511 |
| 7414 | VCL | A002-C-114 | Human | Colorectum | FAP | 1.74e-12 | -1.78e-01 | -0.1561 |
| Page: 1 2 3 4 5 6 7 8 9 10 |
| Tissue | Expression Dynamics | Abbreviation |
| Cervix |  | CC: Cervix cancer |
| HSIL_HPV: HPV-infected high-grade squamous intraepithelial lesions | ||
| N_HPV: HPV-infected normal cervix | ||
| Colorectum (GSE201348) |  | FAP: Familial adenomatous polyposis |
| CRC: Colorectal cancer | ||
| Colorectum (HTA11) |  | AD: Adenomas |
| SER: Sessile serrated lesions | ||
| MSI-H: Microsatellite-high colorectal cancer | ||
| MSS: Microsatellite stable colorectal cancer | ||
| Endometrium | 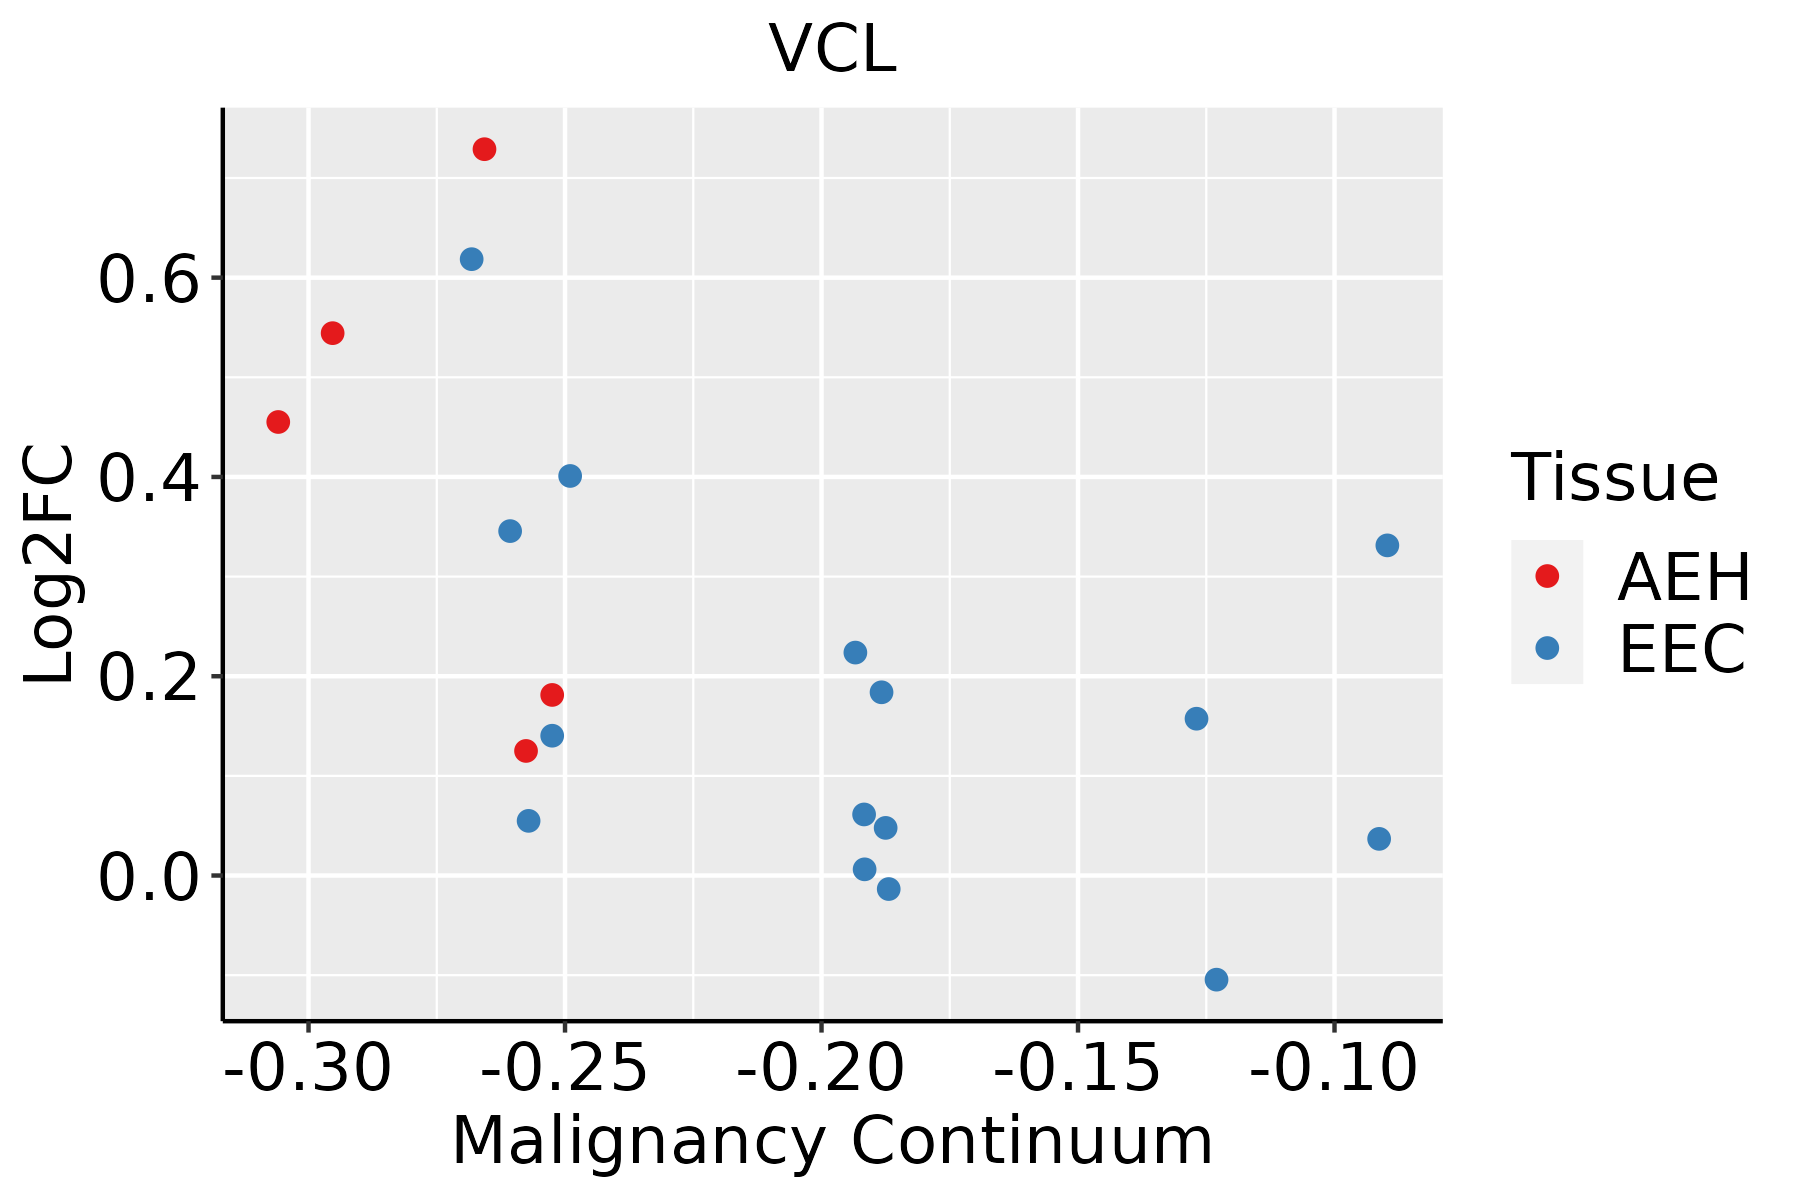 | AEH: Atypical endometrial hyperplasia |
| EEC: Endometrioid Cancer | ||
| Esophagus | 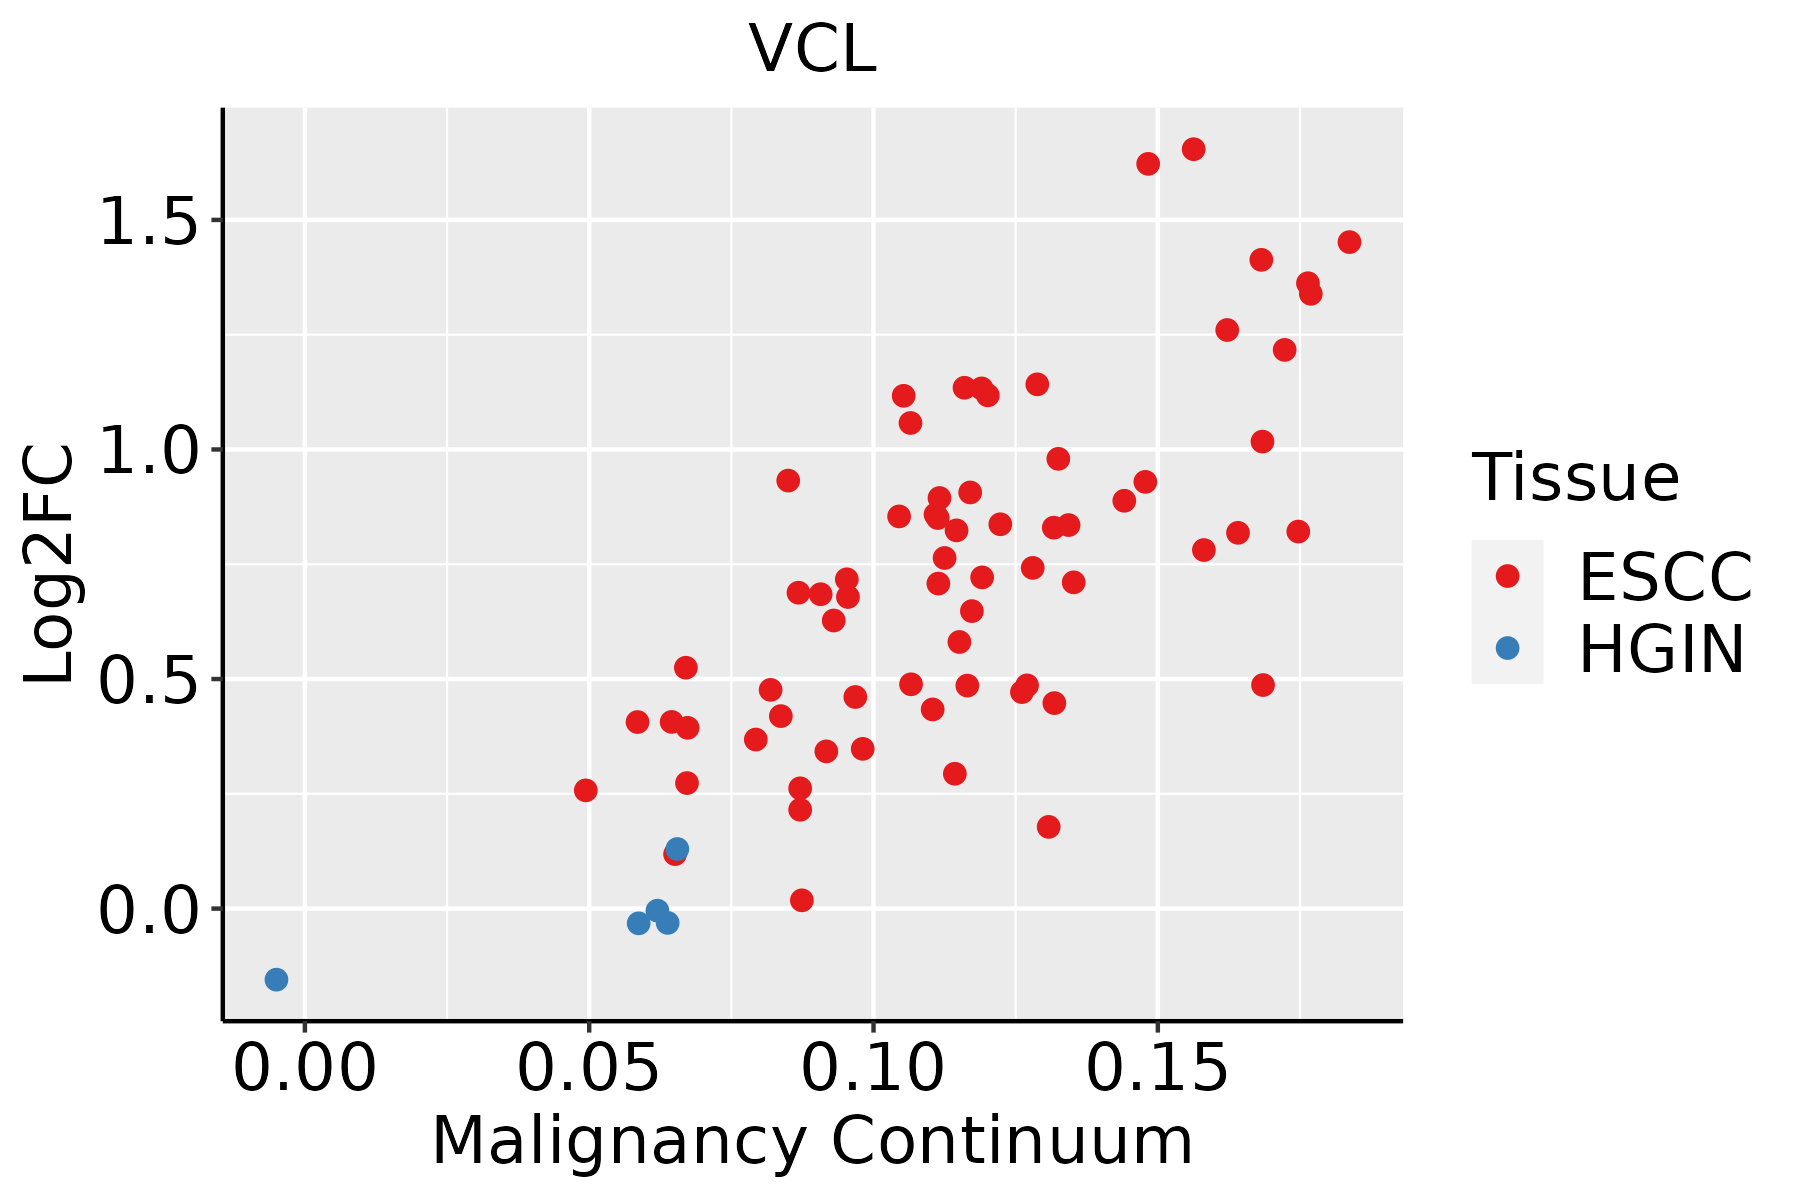 | ESCC: Esophageal squamous cell carcinoma |
| HGIN: High-grade intraepithelial neoplasias | ||
| LGIN: Low-grade intraepithelial neoplasias | ||
| Liver | 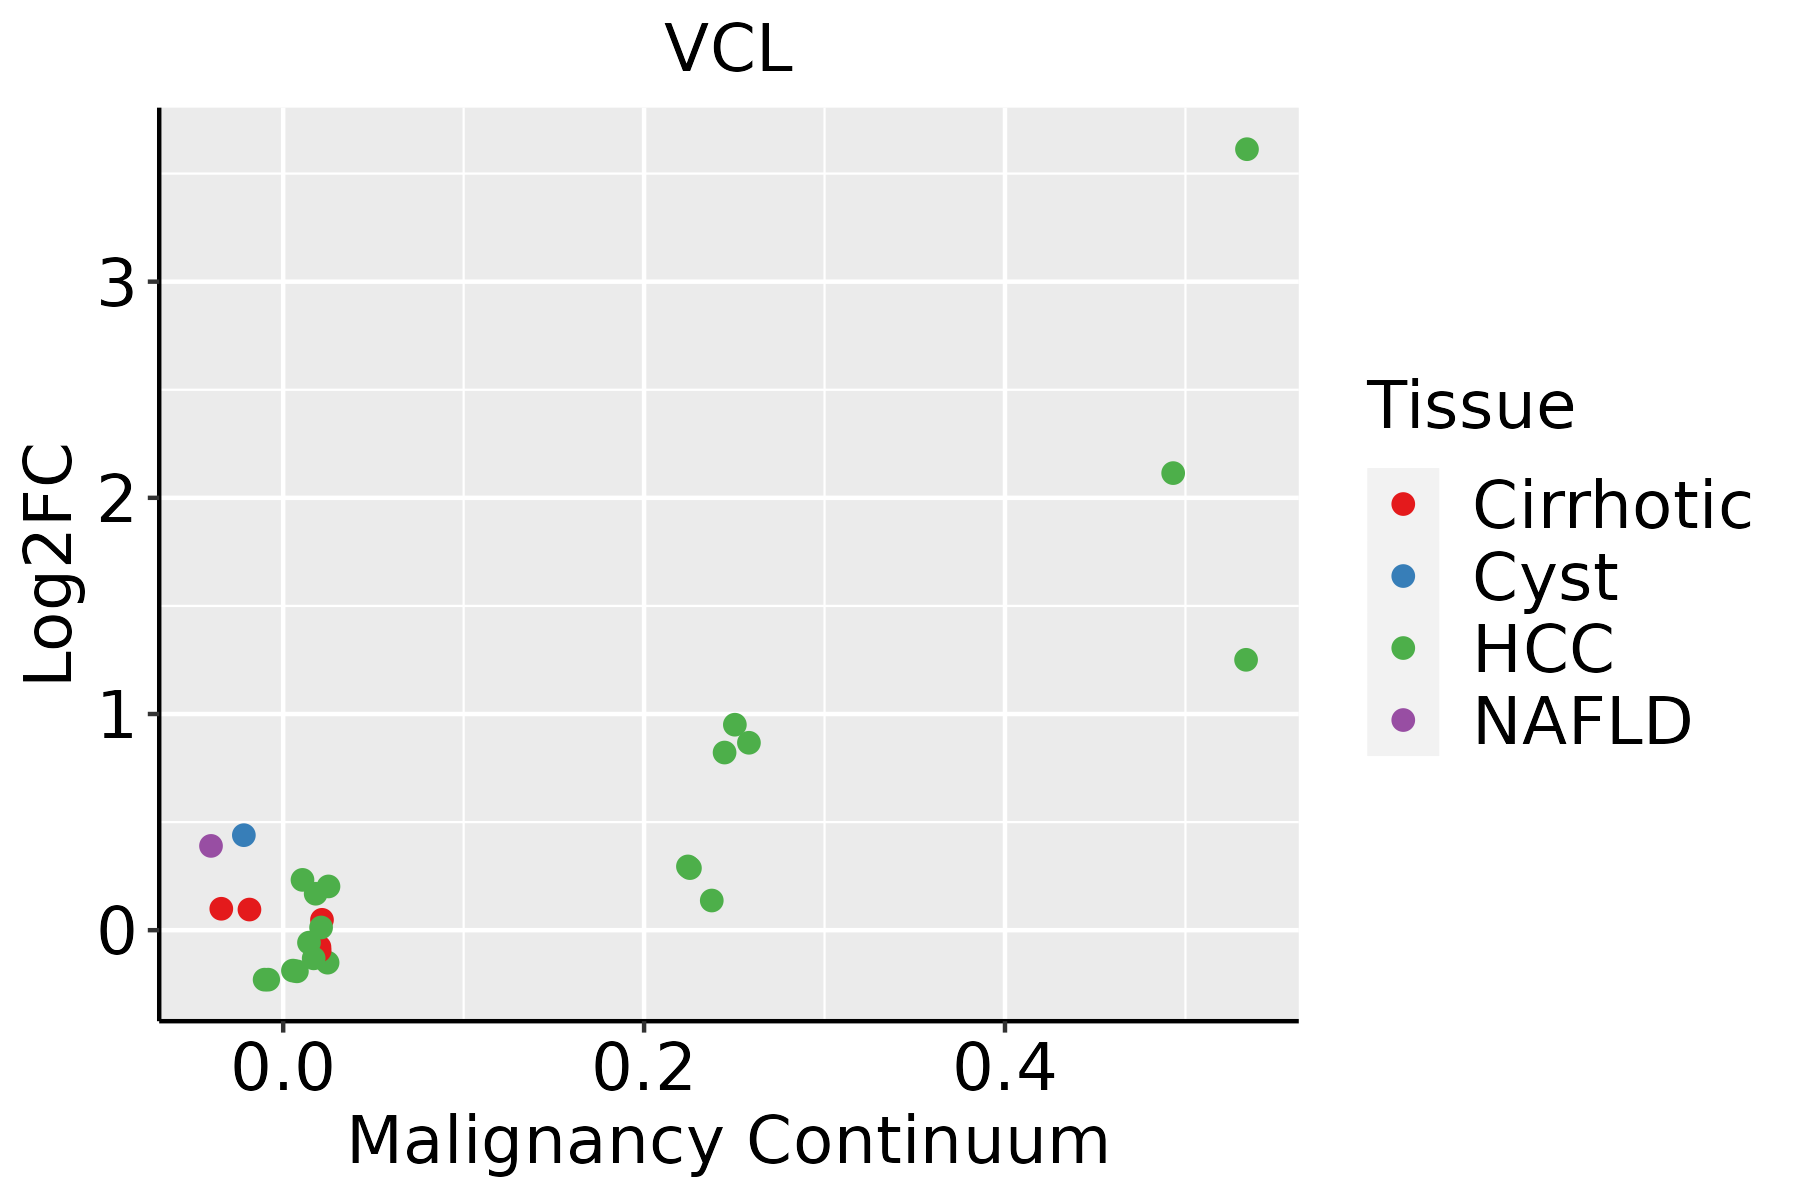 | HCC: Hepatocellular carcinoma |
| NAFLD: Non-alcoholic fatty liver disease | ||
| Lung |  | AAH: Atypical adenomatous hyperplasia |
| AIS: Adenocarcinoma in situ | ||
| IAC: Invasive lung adenocarcinoma | ||
| MIA: Minimally invasive adenocarcinoma | ||
| Oral Cavity |  | EOLP: Erosive Oral lichen planus |
| LP: leukoplakia | ||
| NEOLP: Non-erosive oral lichen planus | ||
| OSCC: Oral squamous cell carcinoma | ||
| Prostate | 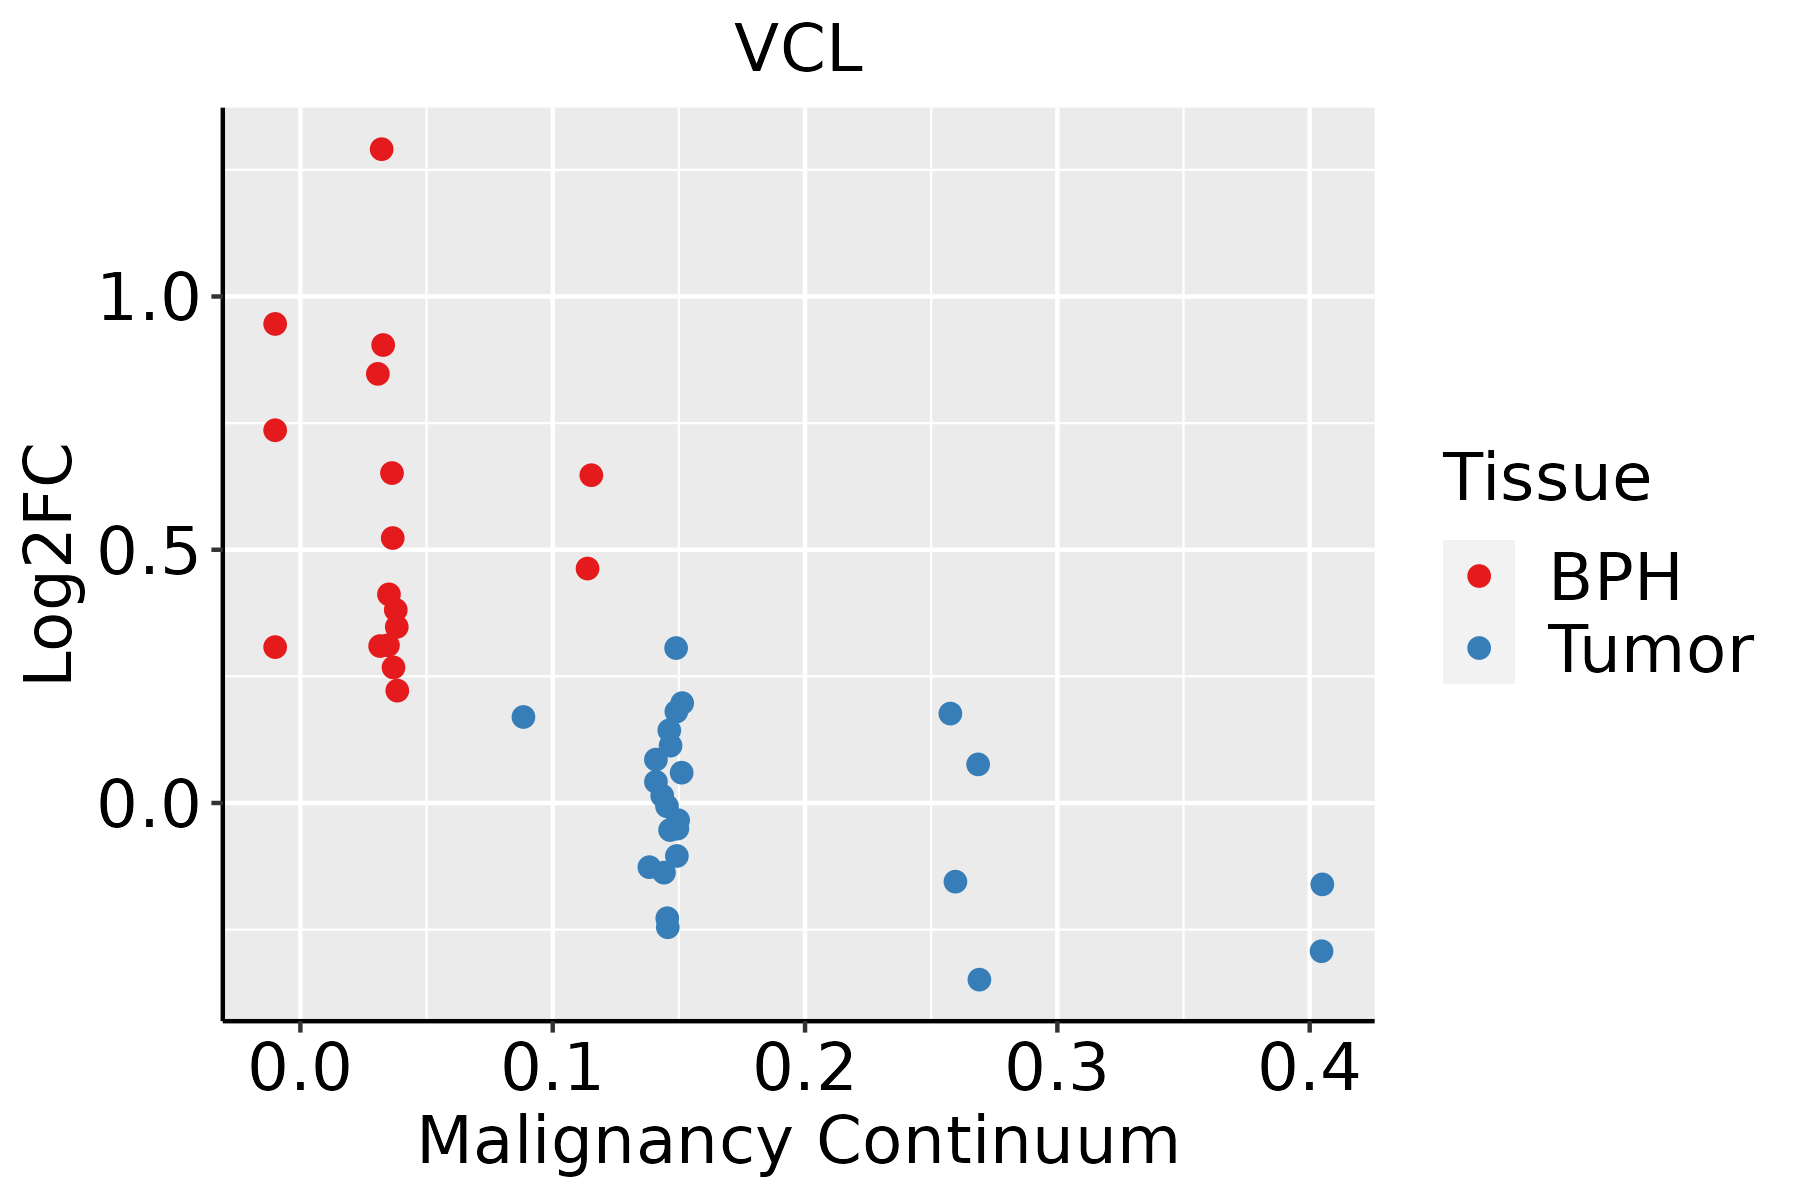 | BPH: Benign Prostatic Hyperplasia |
| Skin |  | AK: Actinic keratosis |
| cSCC: Cutaneous squamous cell carcinoma | ||
| SCCIS:squamous cell carcinoma in situ | ||
| Thyroid | 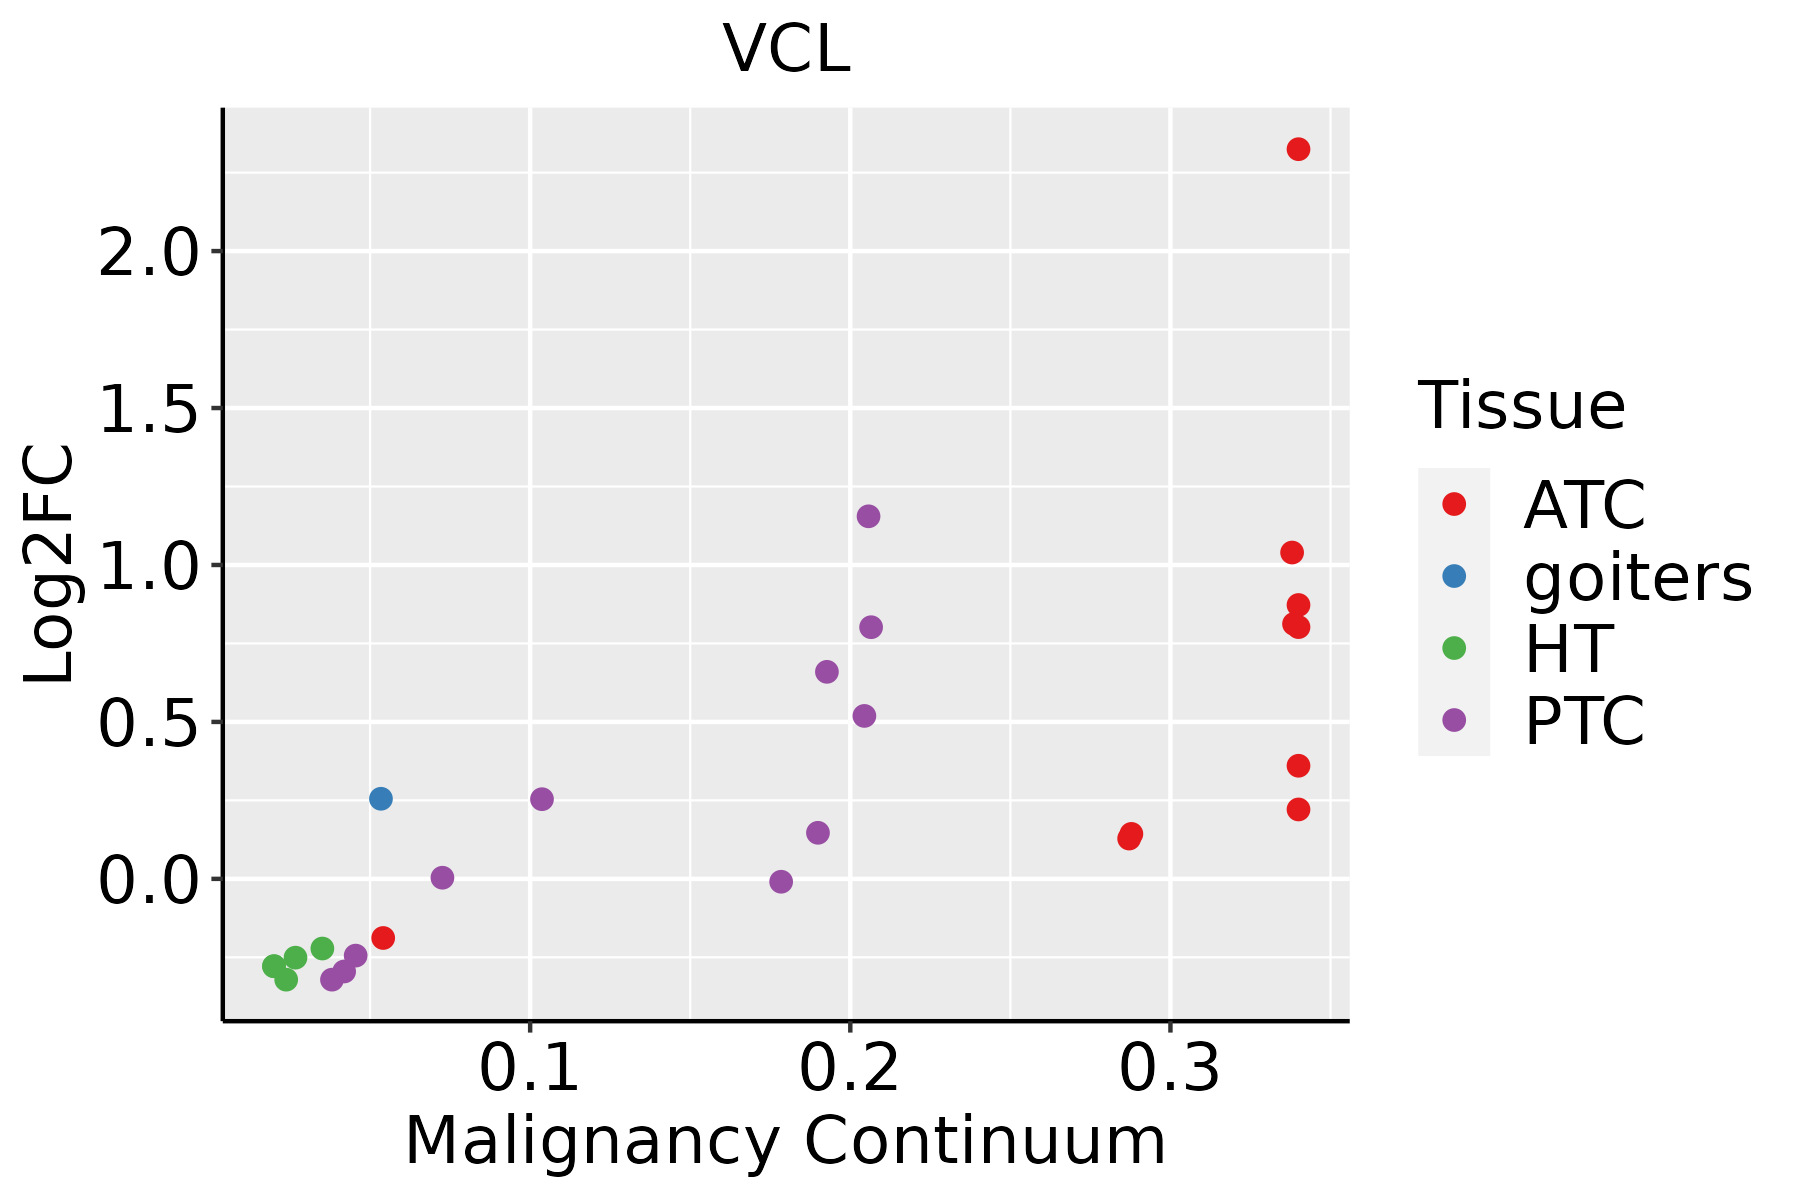 | ATC: Anaplastic thyroid cancer |
| HT: Hashimoto's thyroiditis | ||
| PTC: Papillary thyroid cancer |
| ∗log2FC in expression of this searched gene in stem-like cells from each diseased tissue sample relative to stem-like cells in normal samples in each tissue plotted against the malignancy continuum. Samples are colored based on if they are from different disease stage. |
Top |
Malignant transformation related pathway analysis |
| Find out the enriched GO biological processes and KEGG pathways involved in transition from healthy to precancer to cancer |
| Tissue | Disease Stage | Enriched GO biological Processes |
| Colorectum | AD |  |
| Colorectum | SER |  |
| Colorectum | MSS |  |
| Colorectum | MSI-H |  |
| Colorectum | FAP |  |
| ∗Top 15 enriched GO BP terms are showed in the bar plot of each disease state in each tissue. Each row represents a significant GO biological process which is colored according to the -log10(p.adjust). |
| Page: 1 2 3 4 5 6 7 8 9 |
| GO ID | Tissue | Disease Stage | Description | Gene Ratio | Bg Ratio | pvalue | p.adjust | Count |
| GO:19015503 | Esophagus | ESCC | regulation of endothelial cell development | 13/8552 | 17/18723 | 1.00e-02 | 3.42e-02 | 13 |
| GO:19031403 | Esophagus | ESCC | regulation of establishment of endothelial barrier | 13/8552 | 17/18723 | 1.00e-02 | 3.42e-02 | 13 |
| GO:004858810 | Esophagus | ESCC | developmental cell growth | 125/8552 | 234/18723 | 1.01e-02 | 3.46e-02 | 125 |
| GO:000315818 | Esophagus | ESCC | endothelium development | 76/8552 | 136/18723 | 1.05e-02 | 3.59e-02 | 76 |
| GO:190188810 | Esophagus | ESCC | regulation of cell junction assembly | 109/8552 | 204/18723 | 1.53e-02 | 4.96e-02 | 109 |
| GO:015011512 | Liver | Cirrhotic | cell-substrate junction organization | 51/4634 | 101/18723 | 2.08e-08 | 7.47e-07 | 51 |
| GO:004206012 | Liver | Cirrhotic | wound healing | 155/4634 | 422/18723 | 2.12e-08 | 7.56e-07 | 155 |
| GO:015011612 | Liver | Cirrhotic | regulation of cell-substrate junction organization | 38/4634 | 71/18723 | 1.84e-07 | 4.82e-06 | 38 |
| GO:001081012 | Liver | Cirrhotic | regulation of cell-substrate adhesion | 88/4634 | 221/18723 | 4.89e-07 | 1.10e-05 | 88 |
| GO:000704412 | Liver | Cirrhotic | cell-substrate junction assembly | 46/4634 | 95/18723 | 4.89e-07 | 1.10e-05 | 46 |
| GO:003158912 | Liver | Cirrhotic | cell-substrate adhesion | 128/4634 | 363/18723 | 4.10e-06 | 6.90e-05 | 128 |
| GO:000195211 | Liver | Cirrhotic | regulation of cell-matrix adhesion | 55/4634 | 128/18723 | 4.64e-06 | 7.65e-05 | 55 |
| GO:004804111 | Liver | Cirrhotic | focal adhesion assembly | 41/4634 | 87/18723 | 4.78e-06 | 7.86e-05 | 41 |
| GO:005189312 | Liver | Cirrhotic | regulation of focal adhesion assembly | 33/4634 | 66/18723 | 8.25e-06 | 1.23e-04 | 33 |
| GO:009010912 | Liver | Cirrhotic | regulation of cell-substrate junction assembly | 33/4634 | 66/18723 | 8.25e-06 | 1.23e-04 | 33 |
| GO:001604911 | Liver | Cirrhotic | cell growth | 160/4634 | 482/18723 | 1.50e-05 | 2.07e-04 | 160 |
| GO:009758111 | Liver | Cirrhotic | lamellipodium organization | 40/4634 | 90/18723 | 3.48e-05 | 4.26e-04 | 40 |
| GO:000716011 | Liver | Cirrhotic | cell-matrix adhesion | 85/4634 | 233/18723 | 4.06e-05 | 4.83e-04 | 85 |
| GO:000206412 | Liver | Cirrhotic | epithelial cell development | 80/4634 | 220/18723 | 7.63e-05 | 8.44e-04 | 80 |
| GO:000759611 | Liver | Cirrhotic | blood coagulation | 79/4634 | 217/18723 | 8.06e-05 | 8.81e-04 | 79 |
| Page: 1 2 3 4 5 6 7 8 9 10 11 12 13 14 15 16 17 18 19 20 21 22 23 24 25 26 27 28 29 30 31 32 33 34 35 36 37 38 39 40 41 42 43 44 45 46 |
| Pathway ID | Tissue | Disease Stage | Description | Gene Ratio | Bg Ratio | pvalue | p.adjust | qvalue | Count |
| hsa0513120 | Cervix | CC | Shigellosis | 69/1267 | 247/8465 | 7.64e-08 | 1.03e-06 | 6.10e-07 | 69 |
| hsa0451010 | Cervix | CC | Focal adhesion | 59/1267 | 203/8465 | 1.53e-07 | 1.84e-06 | 1.09e-06 | 59 |
| hsa0481016 | Cervix | CC | Regulation of actin cytoskeleton | 64/1267 | 229/8465 | 2.24e-07 | 2.59e-06 | 1.53e-06 | 64 |
| hsa0452020 | Cervix | CC | Adherens junction | 33/1267 | 93/8465 | 6.99e-07 | 7.31e-06 | 4.32e-06 | 33 |
| hsa0467020 | Cervix | CC | Leukocyte transendothelial migration | 36/1267 | 114/8465 | 5.22e-06 | 4.83e-05 | 2.86e-05 | 36 |
| hsa051465 | Cervix | CC | Amoebiasis | 29/1267 | 102/8465 | 3.31e-04 | 1.70e-03 | 1.01e-03 | 29 |
| hsa05131110 | Cervix | CC | Shigellosis | 69/1267 | 247/8465 | 7.64e-08 | 1.03e-06 | 6.10e-07 | 69 |
| hsa0451014 | Cervix | CC | Focal adhesion | 59/1267 | 203/8465 | 1.53e-07 | 1.84e-06 | 1.09e-06 | 59 |
| hsa0481017 | Cervix | CC | Regulation of actin cytoskeleton | 64/1267 | 229/8465 | 2.24e-07 | 2.59e-06 | 1.53e-06 | 64 |
| hsa04520110 | Cervix | CC | Adherens junction | 33/1267 | 93/8465 | 6.99e-07 | 7.31e-06 | 4.32e-06 | 33 |
| hsa04670110 | Cervix | CC | Leukocyte transendothelial migration | 36/1267 | 114/8465 | 5.22e-06 | 4.83e-05 | 2.86e-05 | 36 |
| hsa0514612 | Cervix | CC | Amoebiasis | 29/1267 | 102/8465 | 3.31e-04 | 1.70e-03 | 1.01e-03 | 29 |
| hsa05131 | Colorectum | AD | Shigellosis | 109/2092 | 247/8465 | 1.09e-11 | 2.44e-10 | 1.55e-10 | 109 |
| hsa05100 | Colorectum | AD | Bacterial invasion of epithelial cells | 44/2092 | 77/8465 | 1.13e-09 | 2.22e-08 | 1.42e-08 | 44 |
| hsa04520 | Colorectum | AD | Adherens junction | 50/2092 | 93/8465 | 1.52e-09 | 2.83e-08 | 1.81e-08 | 50 |
| hsa04810 | Colorectum | AD | Regulation of actin cytoskeleton | 75/2092 | 229/8465 | 3.36e-03 | 1.76e-02 | 1.12e-02 | 75 |
| hsa04510 | Colorectum | AD | Focal adhesion | 67/2092 | 203/8465 | 4.40e-03 | 2.17e-02 | 1.38e-02 | 67 |
| hsa04670 | Colorectum | AD | Leukocyte transendothelial migration | 41/2092 | 114/8465 | 4.60e-03 | 2.20e-02 | 1.40e-02 | 41 |
| hsa051311 | Colorectum | AD | Shigellosis | 109/2092 | 247/8465 | 1.09e-11 | 2.44e-10 | 1.55e-10 | 109 |
| hsa051001 | Colorectum | AD | Bacterial invasion of epithelial cells | 44/2092 | 77/8465 | 1.13e-09 | 2.22e-08 | 1.42e-08 | 44 |
| Page: 1 2 3 4 5 6 7 8 9 10 11 |
Top |
Cell-cell communication analysis |
| Identification of potential cell-cell interactions between two cell types and their ligand-receptor pairs for different disease states |
| Ligand | Receptor | LRpair | Pathway | Tissue | Disease Stage |
| Page: 1 |
Top |
Single-cell gene regulatory network inference analysis |
| Find out the significant the regulons (TFs) and the target genes of each regulon across cell types for different disease states |
| TF | Cell Type | Tissue | Disease Stage | Target Gene | RSS | Regulon Activity |
| ∗The dot plots of a searched regulon are shown for all cell subpopulations in each disease state of each tissue based on the regulon specific score inferred using pySCENIC and by calculating the average expression. |
| Page: 1 |
Top |
Somatic mutation of malignant transformation related genes |
| Annotation of somatic variants for genes involved in malignant transformation |
| Hugo Symbol | Variant Class | Variant Classification | dbSNP RS | HGVSc | HGVSp | HGVSp Short | SWISSPROT | BIOTYPE | SIFT | PolyPhen | Tumor Sample Barcode | Tissue | Histology | Sex | Age | Stage | Therapy Types | Drugs | Outcome |
| VCL | SNV | Missense_Mutation | c.2062N>G | p.Asn688Asp | p.N688D | P18206 | protein_coding | deleterious(0.01) | probably_damaging(0.982) | TCGA-A8-A09Z-01 | Breast | breast invasive carcinoma | Female | >=65 | I/II | Unknown | Unknown | SD | |
| VCL | SNV | Missense_Mutation | c.2339G>A | p.Arg780His | p.R780H | P18206 | protein_coding | tolerated(0.12) | probably_damaging(0.994) | TCGA-AO-A128-01 | Breast | breast invasive carcinoma | Female | <65 | I/II | Chemotherapy | doxorubicin | SD | |
| VCL | SNV | Missense_Mutation | c.692N>G | p.Asn231Ser | p.N231S | P18206 | protein_coding | deleterious(0.03) | possibly_damaging(0.887) | TCGA-AR-A24K-01 | Breast | breast invasive carcinoma | Female | <65 | I/II | Unspecific | Paclitaxel | SD | |
| VCL | SNV | Missense_Mutation | c.953N>T | p.Arg318Leu | p.R318L | P18206 | protein_coding | deleterious(0.04) | probably_damaging(0.982) | TCGA-BH-A0HQ-01 | Breast | breast invasive carcinoma | Female | <65 | I/II | Hormone Therapy | arimidex | SD | |
| VCL | insertion | Frame_Shift_Ins | novel | c.2394_2395insCCATCTGTAGGTA | p.Met799ProfsTer47 | p.M799Pfs*47 | P18206 | protein_coding | TCGA-BH-A0HU-01 | Breast | breast invasive carcinoma | Female | <65 | I/II | Chemotherapy | docetaxel | SD | ||
| VCL | deletion | Frame_Shift_Del | novel | c.3040delG | p.Ala1014HisfsTer16 | p.A1014Hfs*16 | P18206 | protein_coding | TCGA-D8-A27V-01 | Breast | breast invasive carcinoma | Female | <65 | I/II | Hormone Therapy | tamoxiphen | SD | ||
| VCL | SNV | Missense_Mutation | rs540039788 | c.2285G>A | p.Arg762Gln | p.R762Q | P18206 | protein_coding | deleterious(0) | probably_damaging(0.979) | TCGA-2W-A8YY-01 | Cervix | cervical & endocervical cancer | Female | <65 | I/II | Chemotherapy | cisplatin | CR |
| VCL | SNV | Missense_Mutation | c.2978G>A | p.Arg993His | p.R993H | P18206 | protein_coding | deleterious(0.01) | probably_damaging(0.985) | TCGA-2W-A8YY-01 | Cervix | cervical & endocervical cancer | Female | <65 | I/II | Chemotherapy | cisplatin | CR | |
| VCL | SNV | Missense_Mutation | rs878973480 | c.3164G>A | p.Arg1055Gln | p.R1055Q | P18206 | protein_coding | tolerated(0.08) | probably_damaging(0.978) | TCGA-2W-A8YY-01 | Cervix | cervical & endocervical cancer | Female | <65 | I/II | Chemotherapy | cisplatin | CR |
| VCL | SNV | Missense_Mutation | novel | c.1072N>G | p.Gln358Glu | p.Q358E | P18206 | protein_coding | tolerated(0.11) | benign(0.042) | TCGA-VS-A8EI-01 | Cervix | cervical & endocervical cancer | Female | <65 | I/II | Chemotherapy | cisplatin | CR |
| Page: 1 2 3 4 5 6 7 8 9 10 11 |
Top |
Related drugs of malignant transformation related genes |
| Identification of chemicals and drugs interact with genes involved in malignant transfromation |
| (DGIdb 4.0) |
| Entrez ID | Symbol | Category | Interaction Types | Drug Claim Name | Drug Name | PMIDs |
| Page: 1 |

Copyright 2023-Present -The University of Texas Health Science Center at Houston |