
|
|||||
|
 | |
| |
| |
| |
| |
| |
|
Gene: UBE2B |
Gene summary for UBE2B |
| Gene information | Species | Human | Gene symbol | UBE2B | Gene ID | 7320 |
| Gene name | ubiquitin conjugating enzyme E2 B | |
| Gene Alias | E2-17kDa | |
| Cytomap | 5q31.1 | |
| Gene Type | protein-coding | GO ID | GO:0000003 | UniProtAcc | P63146 |
Top |
Malignant transformation analysis |
| Identification of the aberrant gene expression in precancerous and cancerous lesions by comparing the gene expression of stem-like cells in diseased tissues with normal stem cells |
| Entrez ID | Symbol | Replicates | Species | Organ | Tissue | Adj P-value | Log2FC | Malignancy |
| 7320 | UBE2B | GSM4909285 | Human | Breast | IDC | 3.74e-02 | -2.71e-02 | 0.21 |
| 7320 | UBE2B | GSM4909286 | Human | Breast | IDC | 1.58e-03 | -2.42e-01 | 0.1081 |
| 7320 | UBE2B | GSM4909287 | Human | Breast | IDC | 6.05e-05 | -2.88e-01 | 0.2057 |
| 7320 | UBE2B | GSM4909296 | Human | Breast | IDC | 2.42e-22 | -4.58e-01 | 0.1524 |
| 7320 | UBE2B | GSM4909297 | Human | Breast | IDC | 2.43e-14 | -1.48e-01 | 0.1517 |
| 7320 | UBE2B | GSM4909302 | Human | Breast | IDC | 2.09e-03 | -2.35e-01 | 0.1545 |
| 7320 | UBE2B | GSM4909311 | Human | Breast | IDC | 9.17e-39 | -5.31e-01 | 0.1534 |
| 7320 | UBE2B | GSM4909312 | Human | Breast | IDC | 8.03e-13 | -2.53e-01 | 0.1552 |
| 7320 | UBE2B | GSM4909313 | Human | Breast | IDC | 1.19e-03 | -1.92e-01 | 0.0391 |
| 7320 | UBE2B | GSM4909319 | Human | Breast | IDC | 2.89e-40 | -4.88e-01 | 0.1563 |
| 7320 | UBE2B | GSM4909320 | Human | Breast | IDC | 2.07e-09 | -4.62e-01 | 0.1575 |
| 7320 | UBE2B | GSM4909321 | Human | Breast | IDC | 8.98e-17 | -3.50e-01 | 0.1559 |
| 7320 | UBE2B | NCCBC14 | Human | Breast | DCIS | 1.50e-14 | -3.10e-01 | 0.2021 |
| 7320 | UBE2B | NCCBC3 | Human | Breast | DCIS | 4.75e-02 | -1.93e-01 | 0.1198 |
| 7320 | UBE2B | NCCBC5 | Human | Breast | DCIS | 5.51e-12 | -1.52e-01 | 0.2046 |
| 7320 | UBE2B | P1 | Human | Breast | IDC | 3.54e-22 | -3.75e-01 | 0.1527 |
| 7320 | UBE2B | DCIS2 | Human | Breast | DCIS | 2.62e-45 | 3.23e-01 | 0.0085 |
| 7320 | UBE2B | HTA11_347_2000001011 | Human | Colorectum | AD | 1.60e-12 | 6.37e-01 | -0.1954 |
| 7320 | UBE2B | HTA11_99999965104_69814 | Human | Colorectum | MSS | 2.48e-04 | 5.37e-01 | 0.281 |
| 7320 | UBE2B | A015-C-203 | Human | Colorectum | FAP | 1.12e-07 | -1.88e-01 | -0.1294 |
| Page: 1 2 3 4 5 6 7 8 9 10 |
| Tissue | Expression Dynamics | Abbreviation |
| Breast |  | IDC: Invasive ductal carcinoma |
| DCIS: Ductal carcinoma in situ | ||
| Precancer(BRCA1-mut): Precancerous lesion from BRCA1 mutation carriers | ||
| Colorectum (GSE201348) |  | FAP: Familial adenomatous polyposis |
| CRC: Colorectal cancer | ||
| Colorectum (HTA11) | 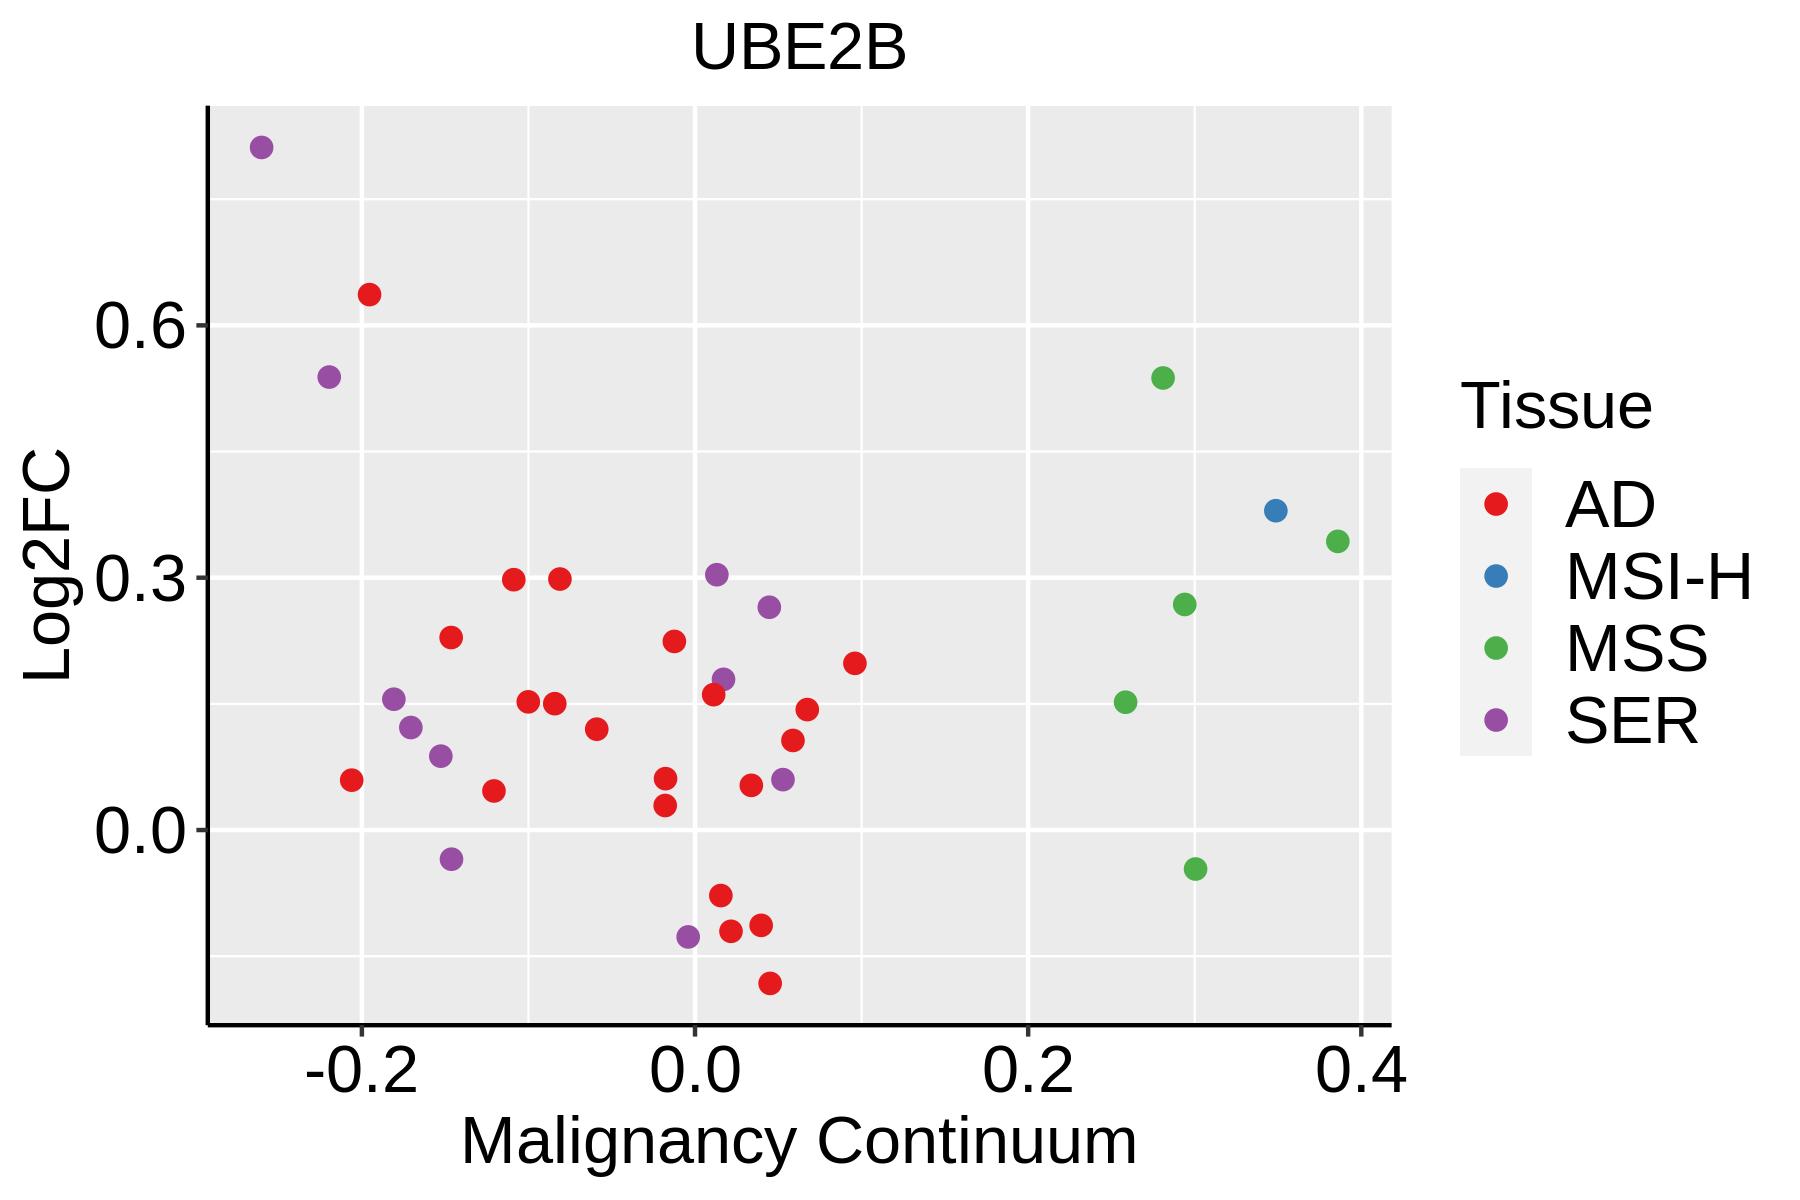 | AD: Adenomas |
| SER: Sessile serrated lesions | ||
| MSI-H: Microsatellite-high colorectal cancer | ||
| MSS: Microsatellite stable colorectal cancer | ||
| Esophagus | 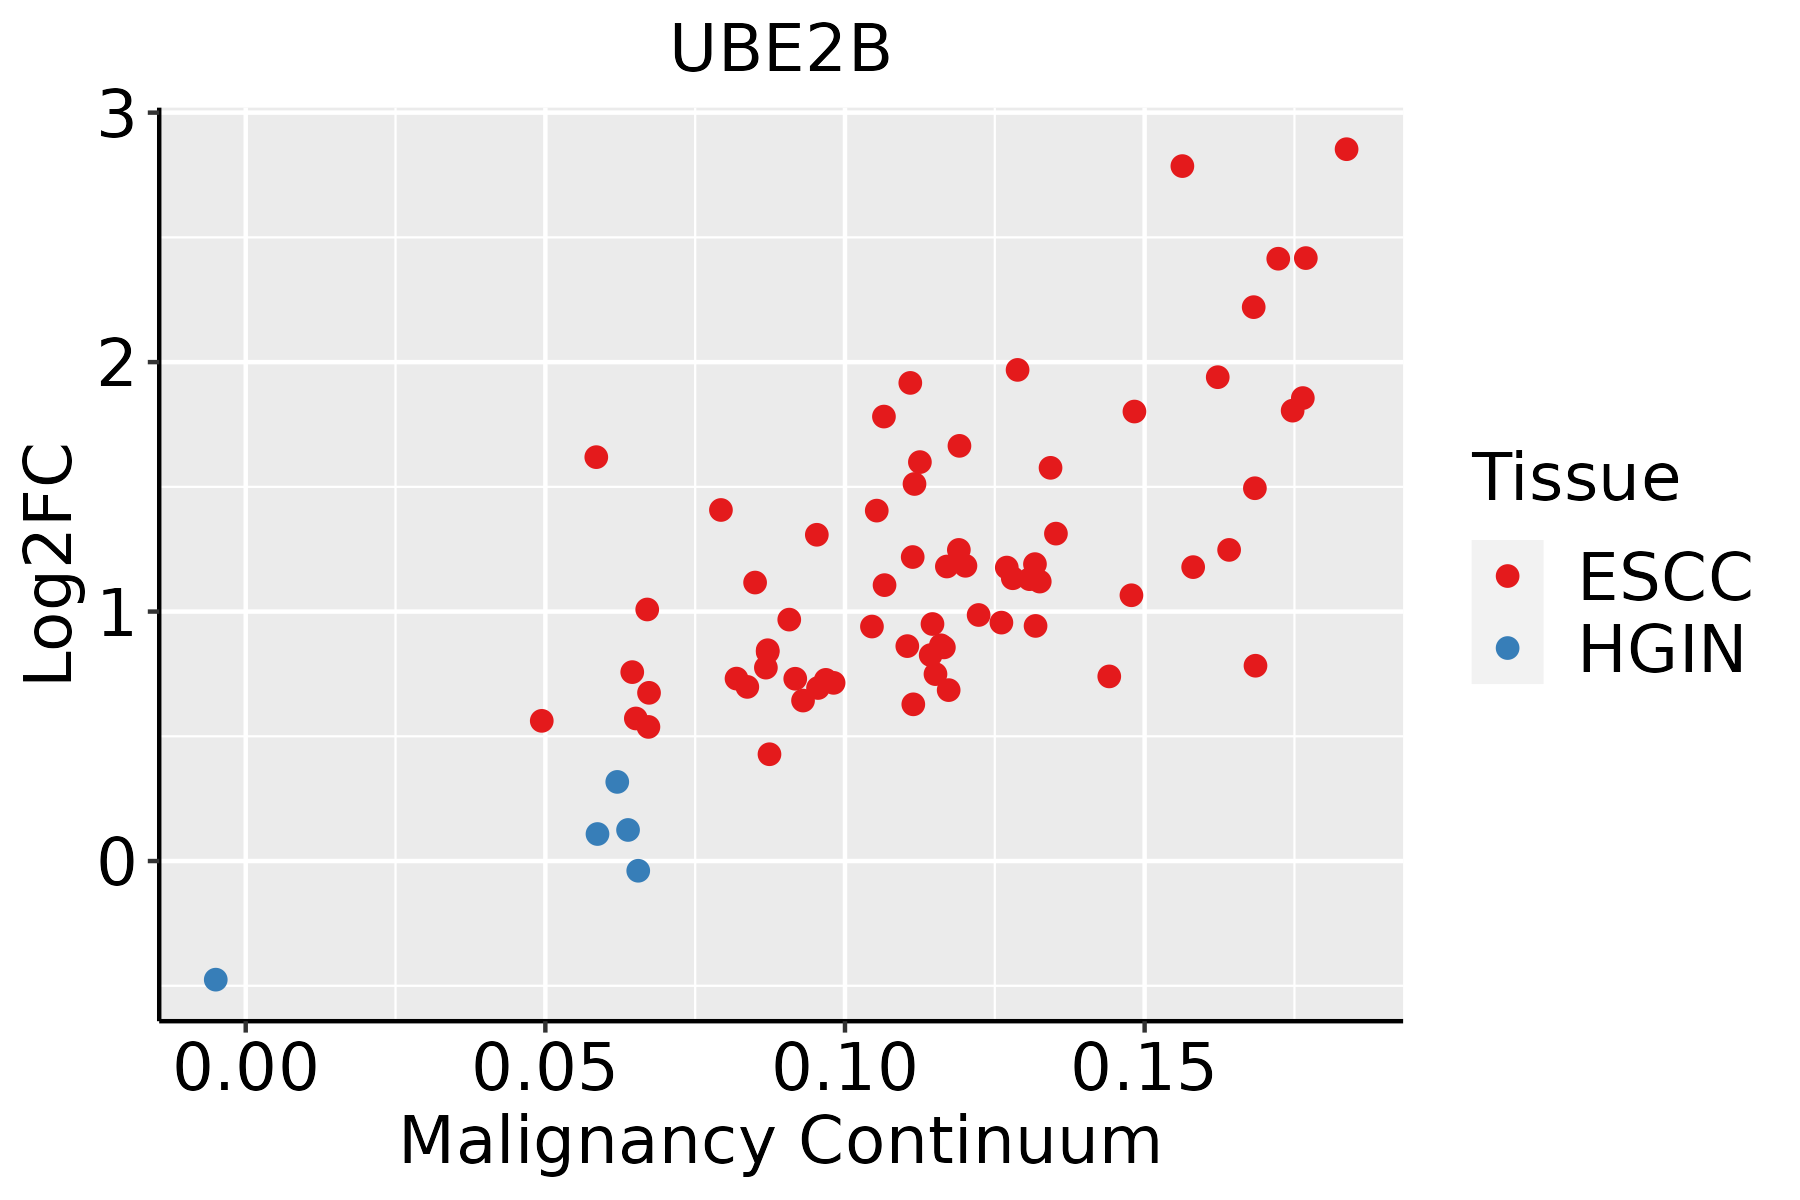 | ESCC: Esophageal squamous cell carcinoma |
| HGIN: High-grade intraepithelial neoplasias | ||
| LGIN: Low-grade intraepithelial neoplasias | ||
| Liver | 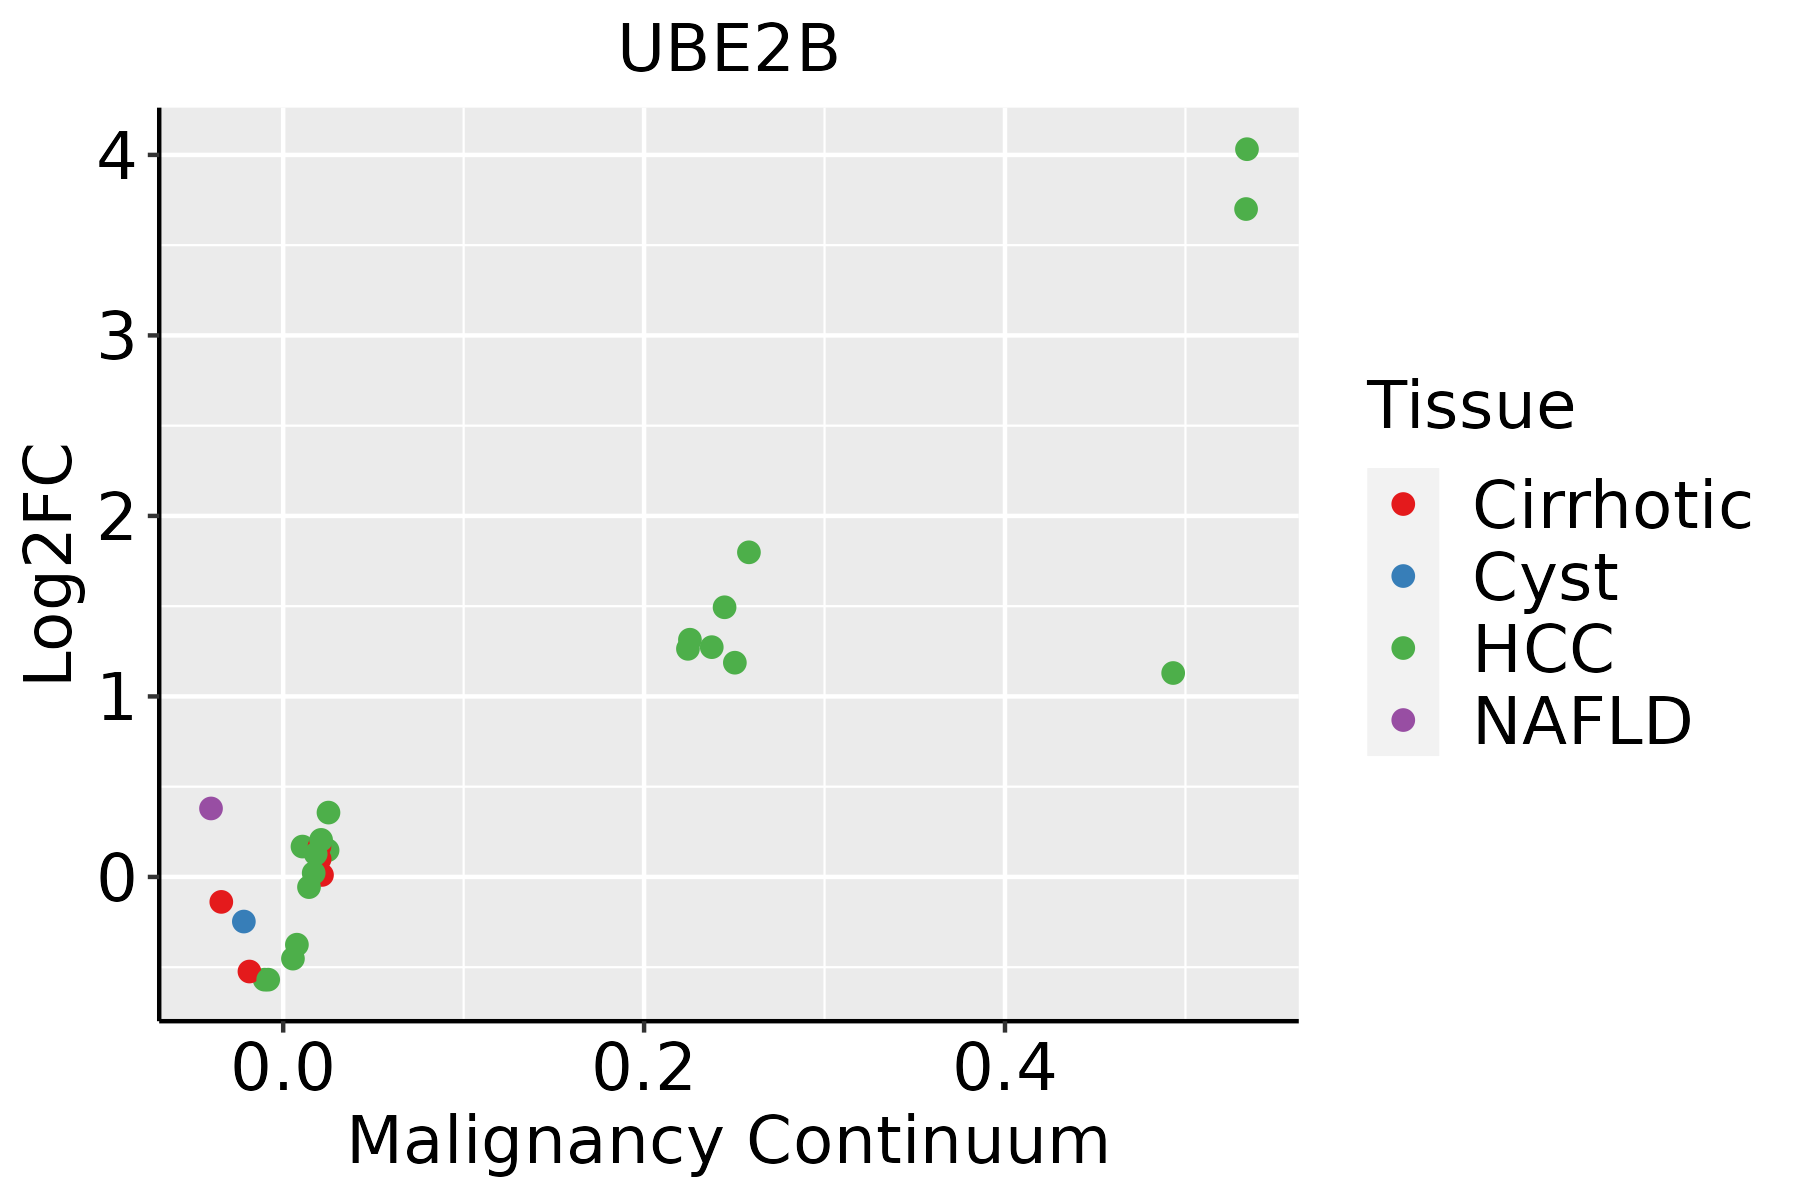 | HCC: Hepatocellular carcinoma |
| NAFLD: Non-alcoholic fatty liver disease | ||
| Lung | 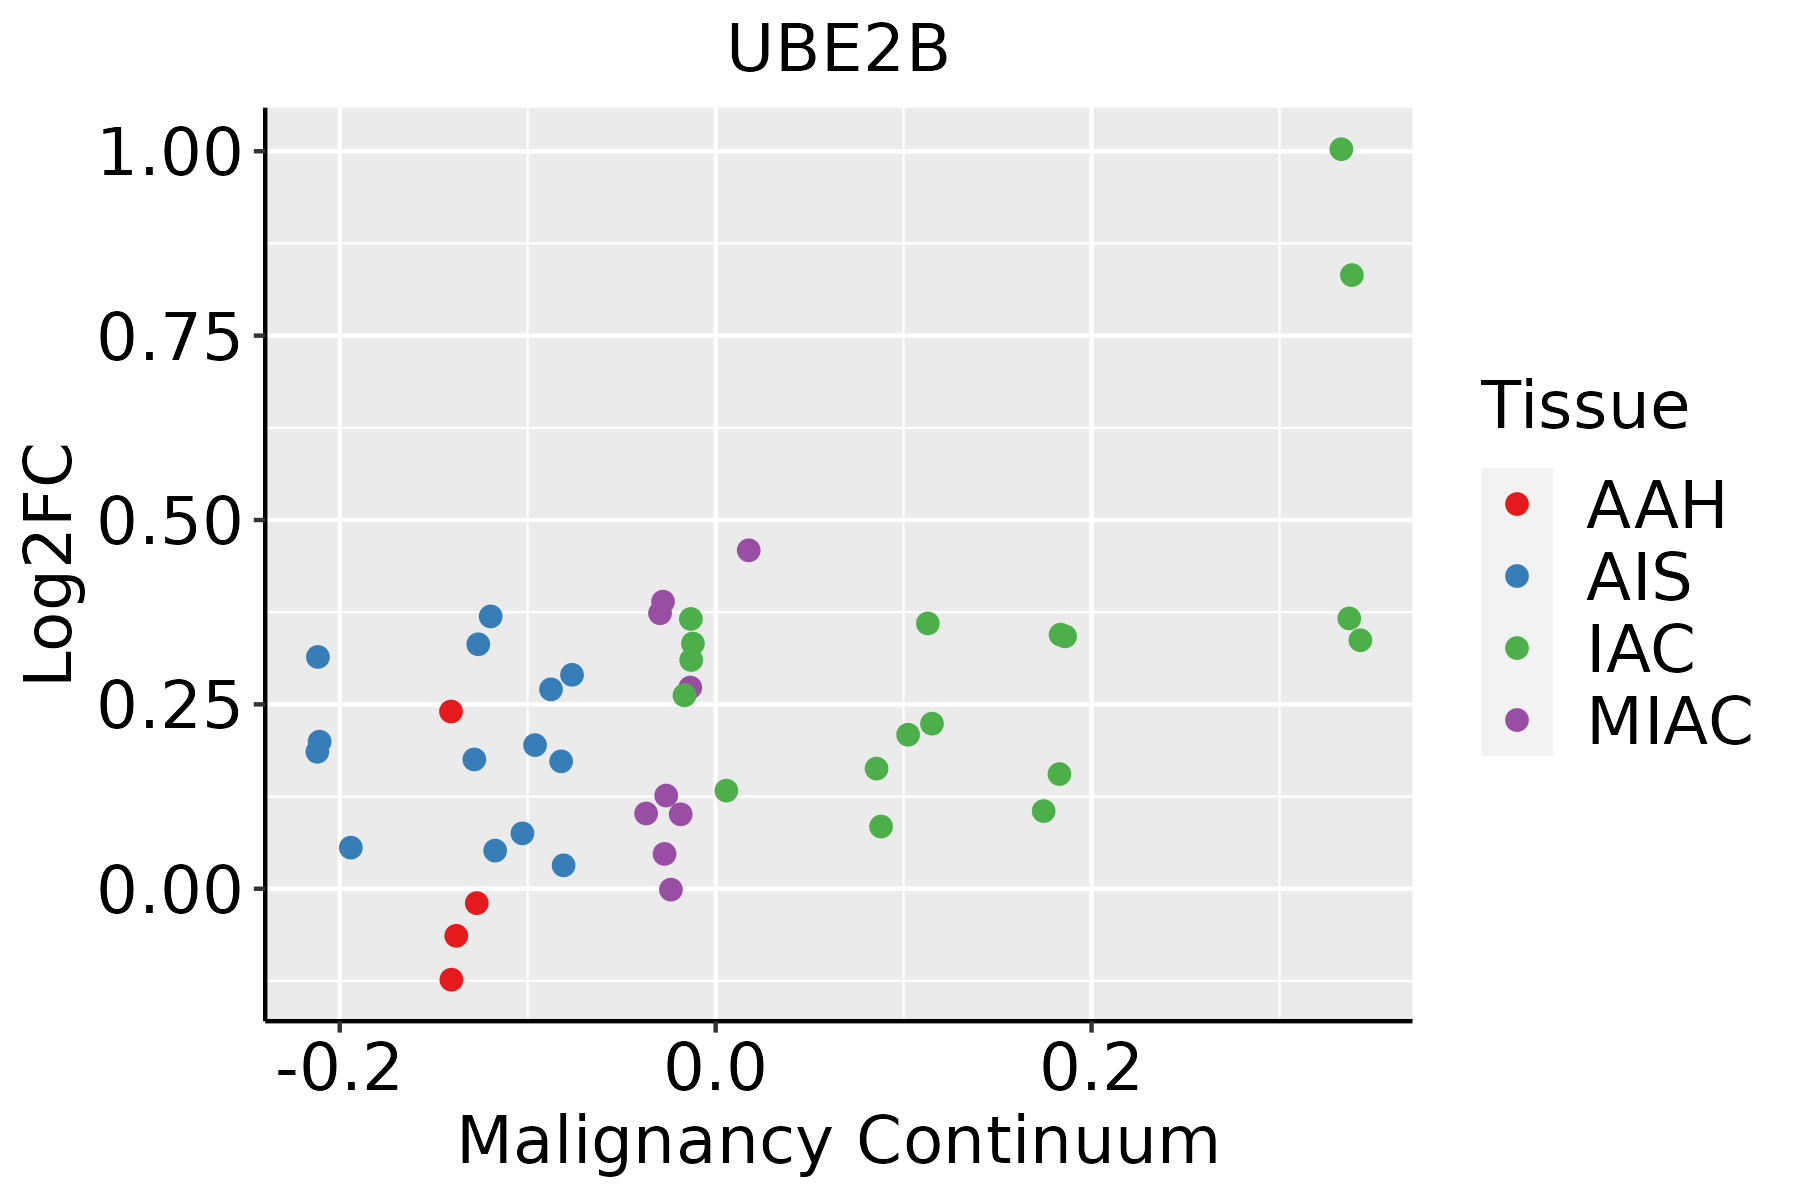 | AAH: Atypical adenomatous hyperplasia |
| AIS: Adenocarcinoma in situ | ||
| IAC: Invasive lung adenocarcinoma | ||
| MIA: Minimally invasive adenocarcinoma | ||
| Oral Cavity | 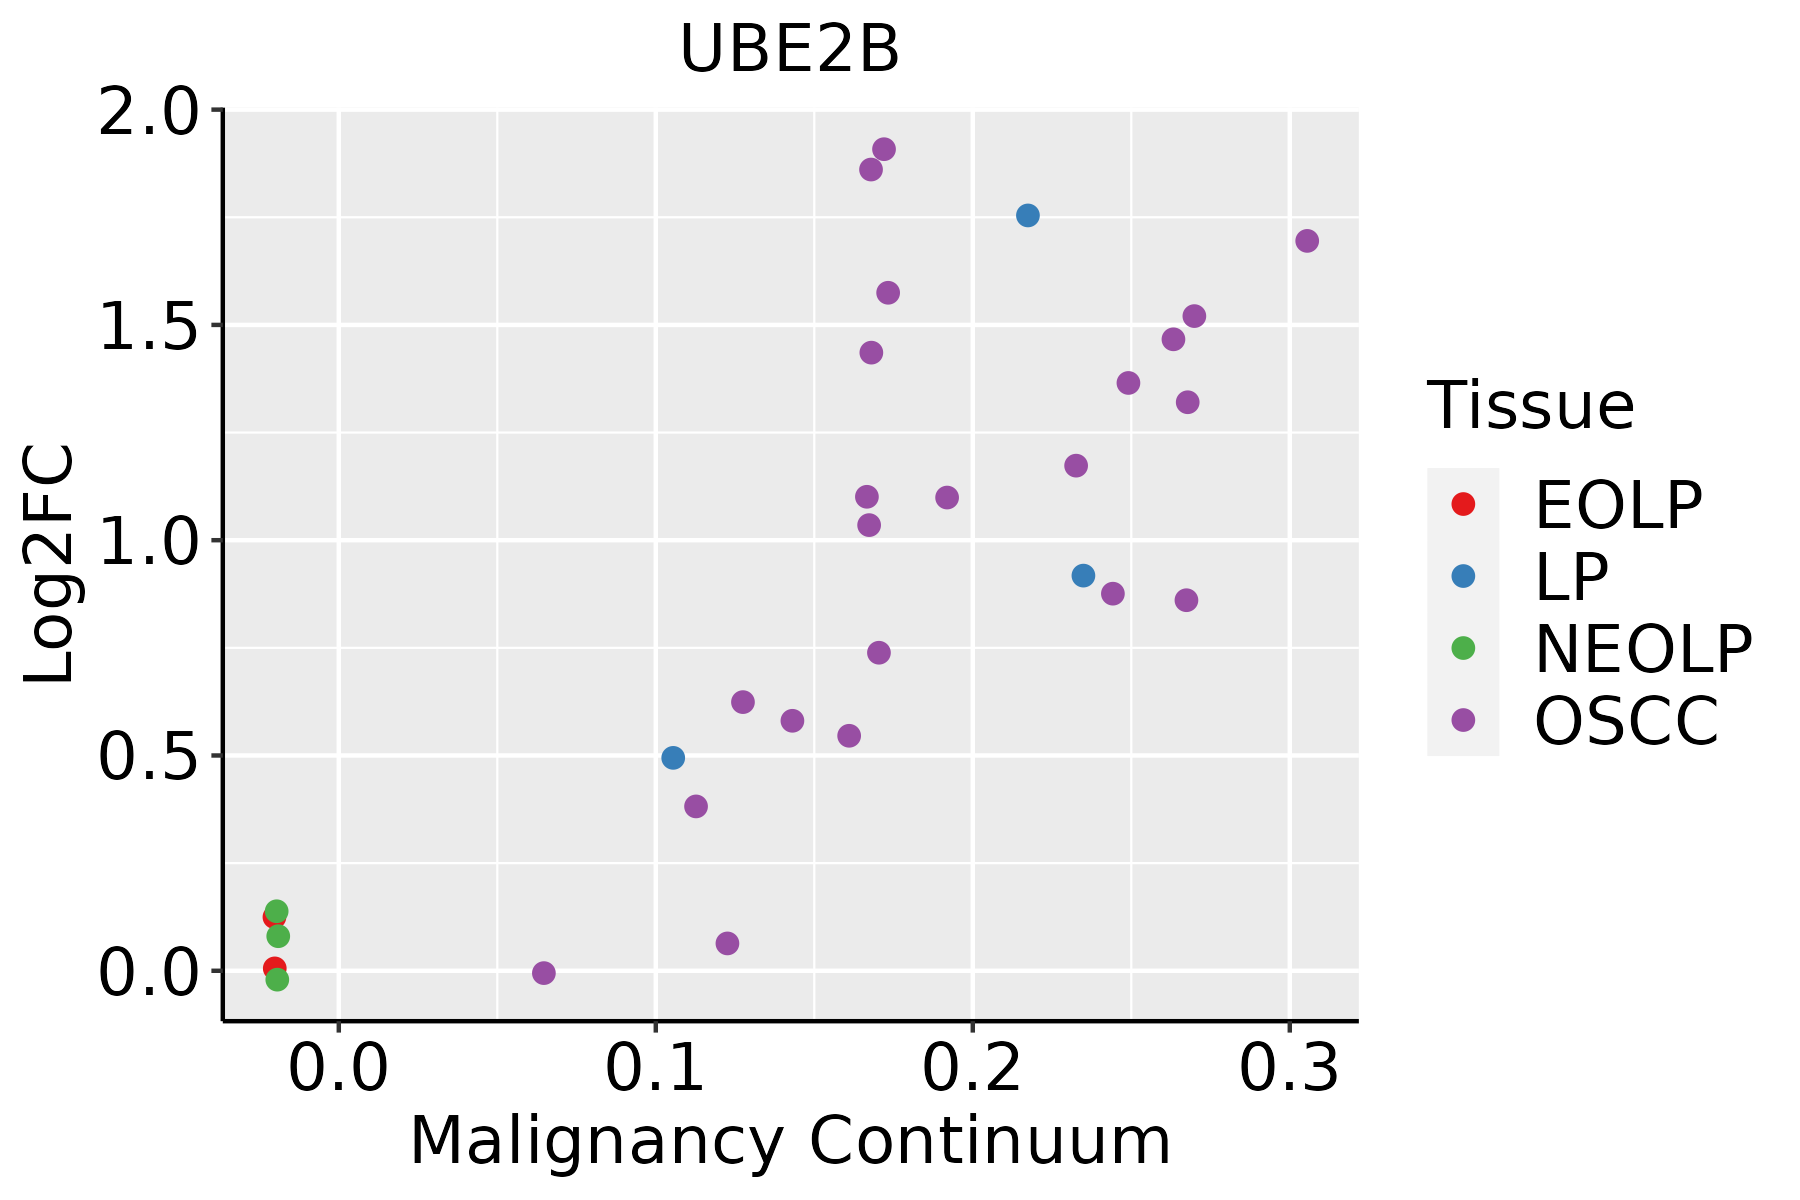 | EOLP: Erosive Oral lichen planus |
| LP: leukoplakia | ||
| NEOLP: Non-erosive oral lichen planus | ||
| OSCC: Oral squamous cell carcinoma | ||
| Prostate |  | BPH: Benign Prostatic Hyperplasia |
| Skin | 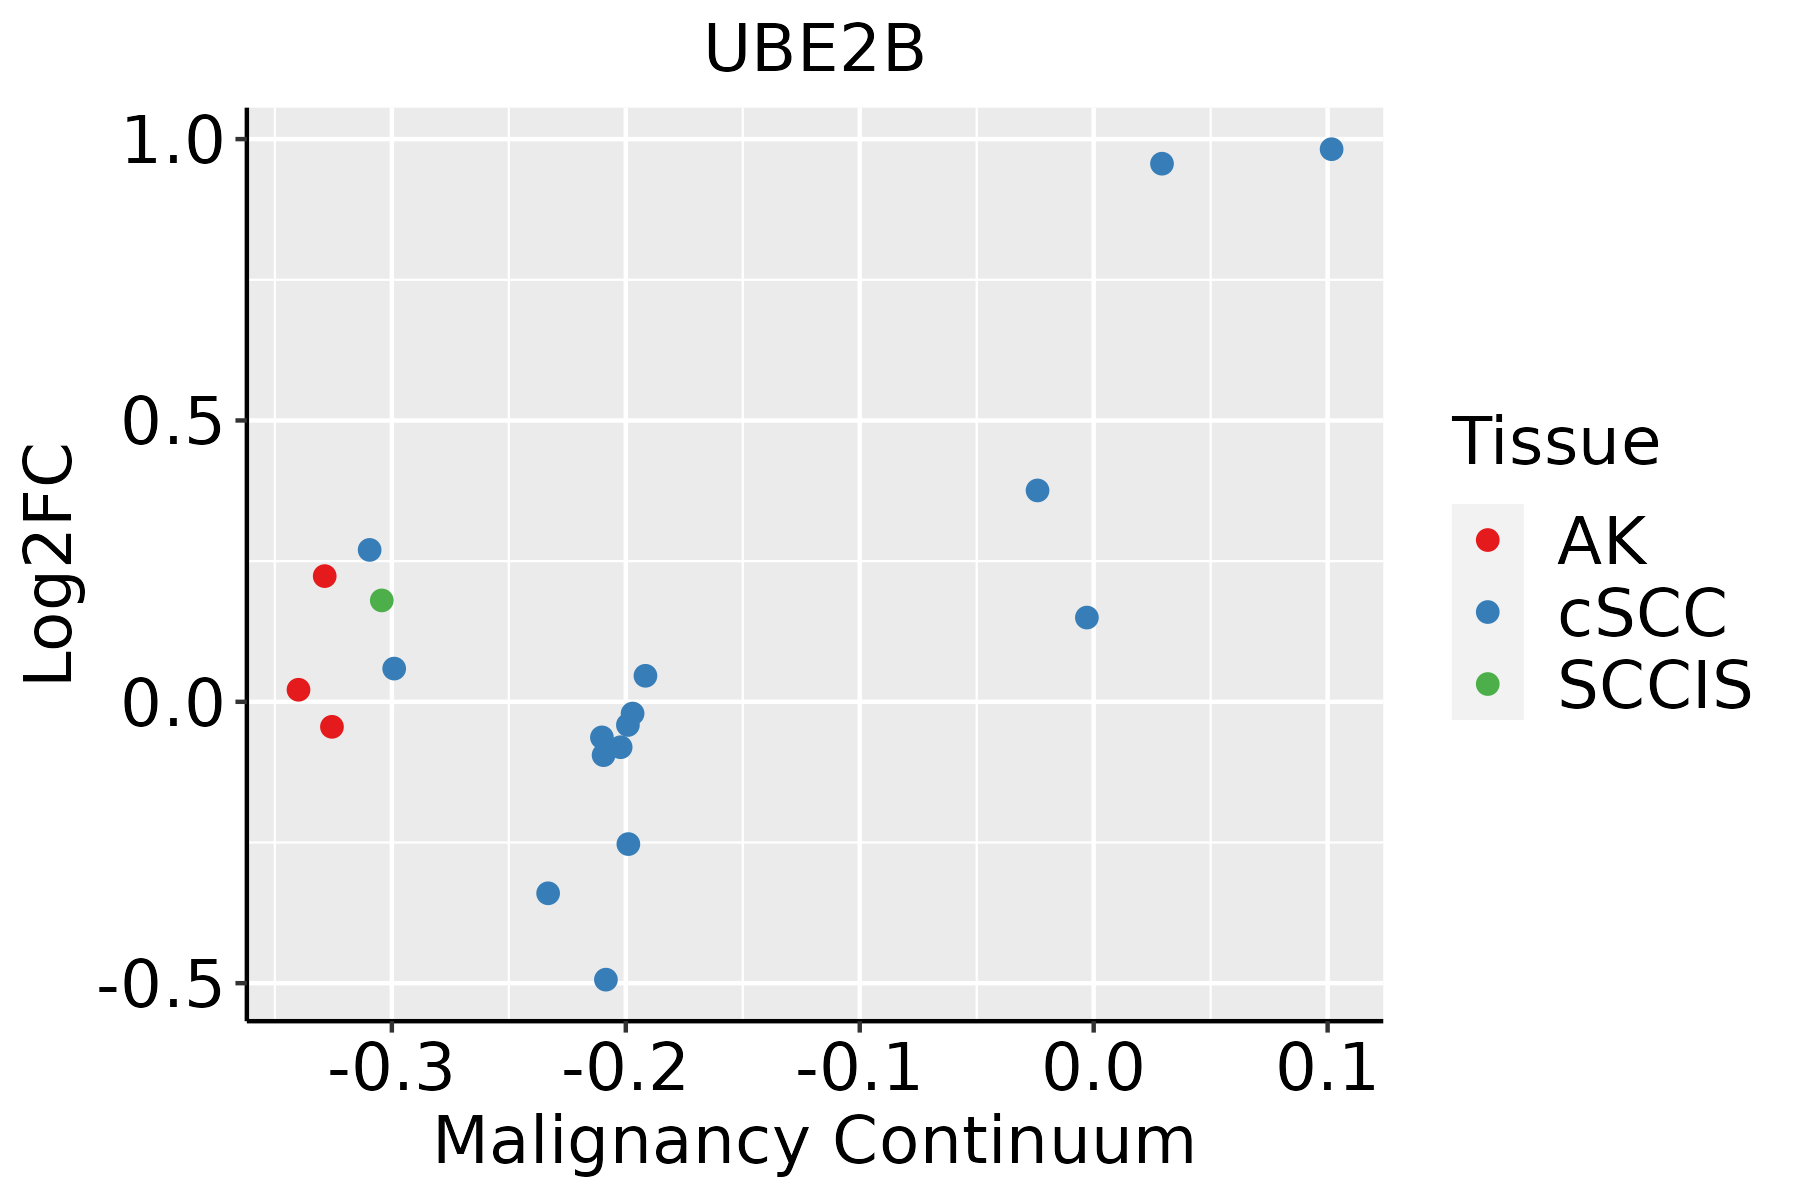 | AK: Actinic keratosis |
| cSCC: Cutaneous squamous cell carcinoma | ||
| SCCIS:squamous cell carcinoma in situ | ||
| Thyroid | 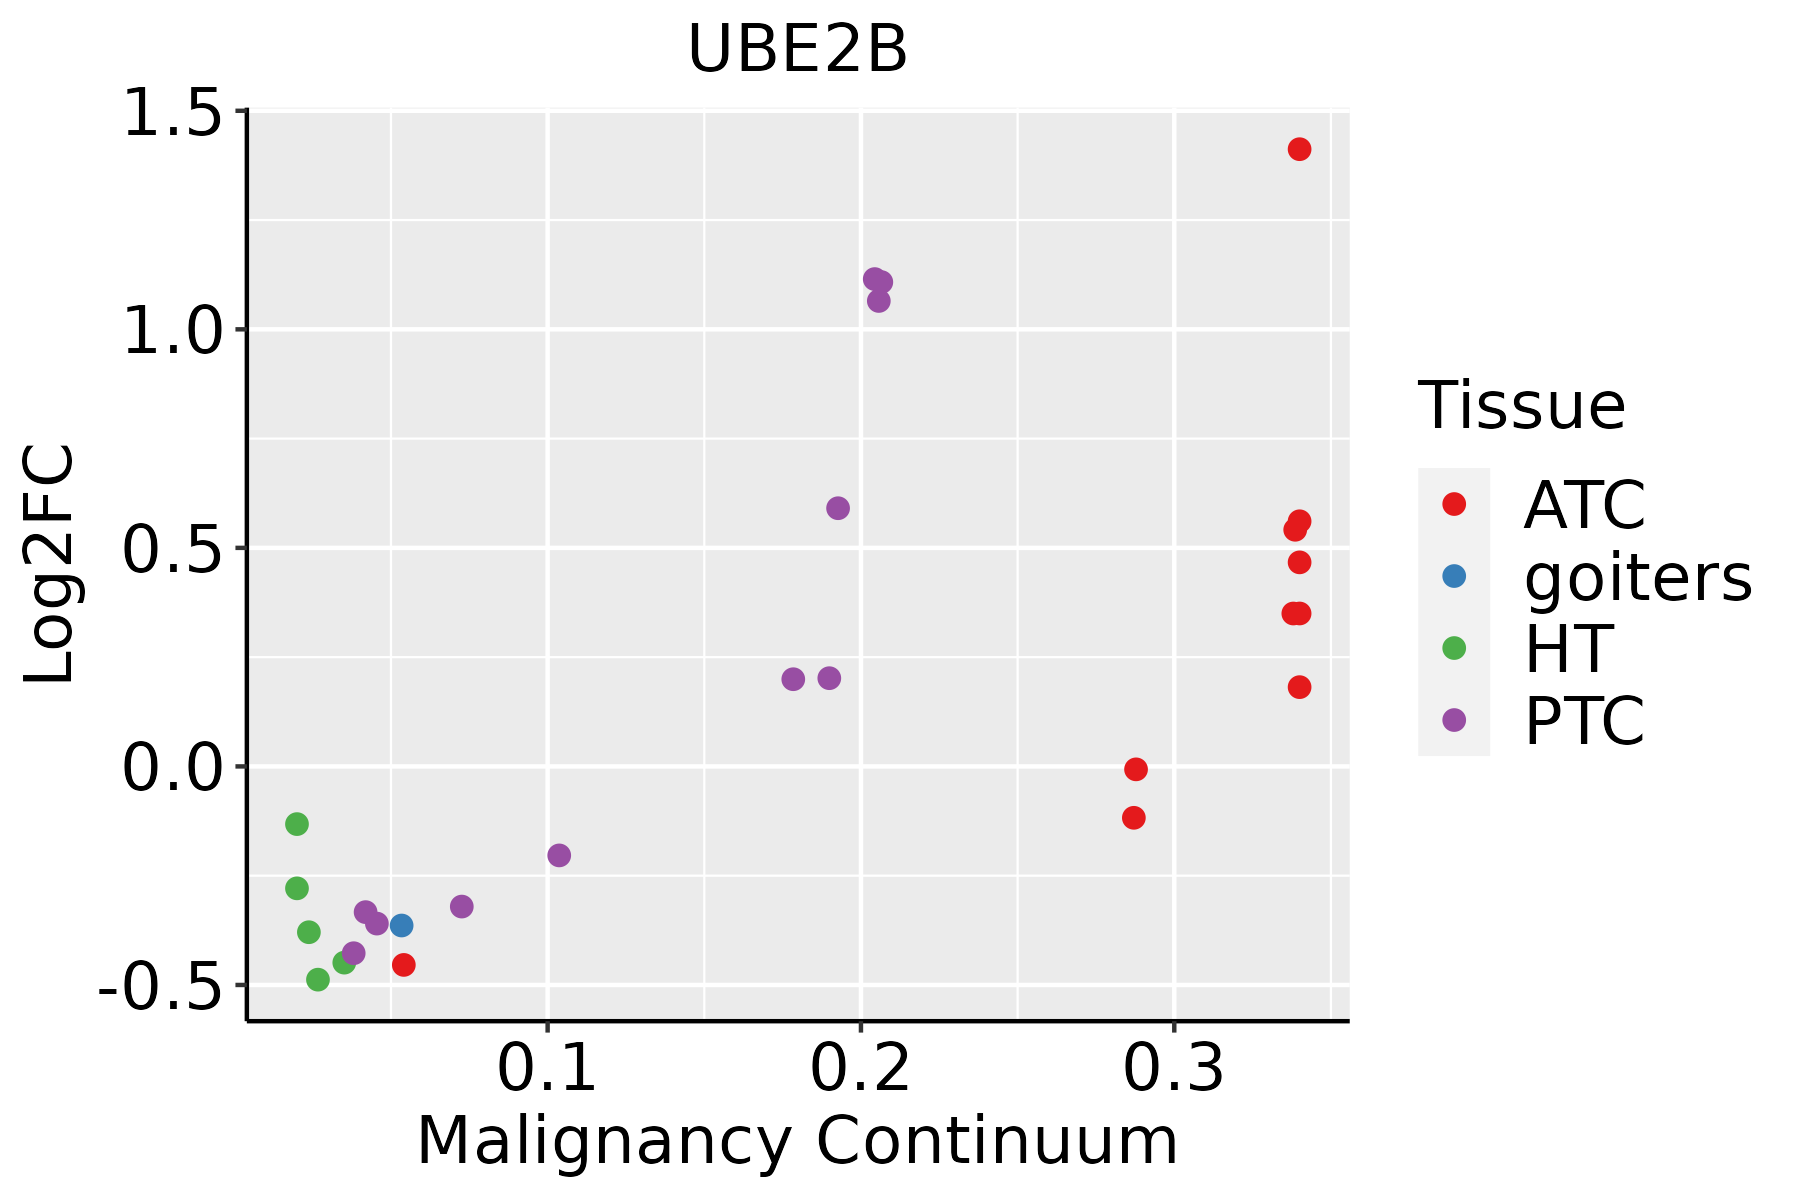 | ATC: Anaplastic thyroid cancer |
| HT: Hashimoto's thyroiditis | ||
| PTC: Papillary thyroid cancer |
| ∗log2FC in expression of this searched gene in stem-like cells from each diseased tissue sample relative to stem-like cells in normal samples in each tissue plotted against the malignancy continuum. Samples are colored based on if they are from different disease stage. |
Top |
Malignant transformation related pathway analysis |
| Find out the enriched GO biological processes and KEGG pathways involved in transition from healthy to precancer to cancer |
| Tissue | Disease Stage | Enriched GO biological Processes |
| Colorectum | AD |  |
| Colorectum | SER |  |
| Colorectum | MSS |  |
| Colorectum | MSI-H |  |
| Colorectum | FAP |  |
| ∗Top 15 enriched GO BP terms are showed in the bar plot of each disease state in each tissue. Each row represents a significant GO biological process which is colored according to the -log10(p.adjust). |
| Page: 1 2 3 4 5 6 7 8 9 |
| GO ID | Tissue | Disease Stage | Description | Gene Ratio | Bg Ratio | pvalue | p.adjust | Count |
| GO:0060271 | Lung | IAC | cilium assembly | 55/2061 | 337/18723 | 1.84e-03 | 1.88e-02 | 55 |
| GO:00518655 | Lung | IAC | protein autoubiquitination | 17/2061 | 73/18723 | 2.05e-03 | 2.05e-02 | 17 |
| GO:0044782 | Lung | IAC | cilium organization | 58/2061 | 368/18723 | 3.15e-03 | 2.75e-02 | 58 |
| GO:00508218 | Lung | IAC | protein stabilization | 34/2061 | 191/18723 | 3.21e-03 | 2.78e-02 | 34 |
| GO:00165744 | Lung | IAC | histone ubiquitination | 12/2061 | 47/18723 | 4.05e-03 | 3.31e-02 | 12 |
| GO:00510547 | Lung | IAC | positive regulation of DNA metabolic process | 35/2061 | 201/18723 | 4.07e-03 | 3.32e-02 | 35 |
| GO:00510527 | Lung | IAC | regulation of DNA metabolic process | 55/2061 | 359/18723 | 7.12e-03 | 4.87e-02 | 55 |
| GO:001605512 | Lung | AIS | Wnt signaling pathway | 91/1849 | 444/18723 | 9.38e-12 | 5.47e-09 | 91 |
| GO:019873812 | Lung | AIS | cell-cell signaling by wnt | 91/1849 | 446/18723 | 1.22e-11 | 6.13e-09 | 91 |
| GO:003011112 | Lung | AIS | regulation of Wnt signaling pathway | 70/1849 | 328/18723 | 3.81e-10 | 8.87e-08 | 70 |
| GO:003164713 | Lung | AIS | regulation of protein stability | 62/1849 | 298/18723 | 1.06e-08 | 1.63e-06 | 62 |
| GO:004316113 | Lung | AIS | proteasome-mediated ubiquitin-dependent protein catabolic process | 77/1849 | 412/18723 | 2.74e-08 | 3.47e-06 | 77 |
| GO:001049813 | Lung | AIS | proteasomal protein catabolic process | 87/1849 | 490/18723 | 4.15e-08 | 5.03e-06 | 87 |
| GO:001657012 | Lung | AIS | histone modification | 81/1849 | 463/18723 | 2.30e-07 | 2.16e-05 | 81 |
| GO:006082812 | Lung | AIS | regulation of canonical Wnt signaling pathway | 52/1849 | 253/18723 | 2.40e-07 | 2.22e-05 | 52 |
| GO:006007012 | Lung | AIS | canonical Wnt signaling pathway | 59/1849 | 303/18723 | 2.73e-07 | 2.37e-05 | 59 |
| GO:000020912 | Lung | AIS | protein polyubiquitination | 49/1849 | 236/18723 | 3.85e-07 | 3.16e-05 | 49 |
| GO:004593613 | Lung | AIS | negative regulation of phosphate metabolic process | 75/1849 | 441/18723 | 1.93e-06 | 1.12e-04 | 75 |
| GO:001056313 | Lung | AIS | negative regulation of phosphorus metabolic process | 75/1849 | 442/18723 | 2.11e-06 | 1.20e-04 | 75 |
| GO:004232613 | Lung | AIS | negative regulation of phosphorylation | 65/1849 | 385/18723 | 1.17e-05 | 4.69e-04 | 65 |
| Page: 1 2 3 4 5 6 7 8 9 10 11 12 13 14 15 16 17 18 19 20 21 22 23 24 25 26 27 28 29 30 31 32 33 34 35 36 37 38 |
| Pathway ID | Tissue | Disease Stage | Description | Gene Ratio | Bg Ratio | pvalue | p.adjust | qvalue | Count |
| hsa04120 | Colorectum | AD | Ubiquitin mediated proteolysis | 58/2092 | 142/8465 | 1.46e-05 | 1.53e-04 | 9.76e-05 | 58 |
| hsa041201 | Colorectum | AD | Ubiquitin mediated proteolysis | 58/2092 | 142/8465 | 1.46e-05 | 1.53e-04 | 9.76e-05 | 58 |
| hsa041204 | Colorectum | MSS | Ubiquitin mediated proteolysis | 55/1875 | 142/8465 | 5.02e-06 | 6.00e-05 | 3.68e-05 | 55 |
| hsa041205 | Colorectum | MSS | Ubiquitin mediated proteolysis | 55/1875 | 142/8465 | 5.02e-06 | 6.00e-05 | 3.68e-05 | 55 |
| hsa041206 | Colorectum | FAP | Ubiquitin mediated proteolysis | 51/1404 | 142/8465 | 1.55e-08 | 5.84e-07 | 3.55e-07 | 51 |
| hsa041207 | Colorectum | FAP | Ubiquitin mediated proteolysis | 51/1404 | 142/8465 | 1.55e-08 | 5.84e-07 | 3.55e-07 | 51 |
| hsa0412026 | Esophagus | HGIN | Ubiquitin mediated proteolysis | 49/1383 | 142/8465 | 7.78e-08 | 1.33e-06 | 1.06e-06 | 49 |
| hsa04120111 | Esophagus | HGIN | Ubiquitin mediated proteolysis | 49/1383 | 142/8465 | 7.78e-08 | 1.33e-06 | 1.06e-06 | 49 |
| hsa0412027 | Esophagus | ESCC | Ubiquitin mediated proteolysis | 122/4205 | 142/8465 | 6.53e-20 | 7.29e-18 | 3.74e-18 | 122 |
| hsa0412036 | Esophagus | ESCC | Ubiquitin mediated proteolysis | 122/4205 | 142/8465 | 6.53e-20 | 7.29e-18 | 3.74e-18 | 122 |
| hsa0412010 | Liver | NAFLD | Ubiquitin mediated proteolysis | 44/1043 | 142/8465 | 2.59e-09 | 1.70e-07 | 1.37e-07 | 44 |
| hsa0412011 | Liver | NAFLD | Ubiquitin mediated proteolysis | 44/1043 | 142/8465 | 2.59e-09 | 1.70e-07 | 1.37e-07 | 44 |
| hsa0412021 | Liver | Cirrhotic | Ubiquitin mediated proteolysis | 72/2530 | 142/8465 | 1.32e-07 | 1.97e-06 | 1.21e-06 | 72 |
| hsa0412031 | Liver | Cirrhotic | Ubiquitin mediated proteolysis | 72/2530 | 142/8465 | 1.32e-07 | 1.97e-06 | 1.21e-06 | 72 |
| hsa0412041 | Liver | HCC | Ubiquitin mediated proteolysis | 110/4020 | 142/8465 | 1.67e-13 | 3.74e-12 | 2.08e-12 | 110 |
| hsa0412051 | Liver | HCC | Ubiquitin mediated proteolysis | 110/4020 | 142/8465 | 1.67e-13 | 3.74e-12 | 2.08e-12 | 110 |
| hsa0412012 | Lung | IAC | Ubiquitin mediated proteolysis | 40/1053 | 142/8465 | 3.24e-07 | 1.76e-05 | 1.17e-05 | 40 |
| hsa0412013 | Lung | IAC | Ubiquitin mediated proteolysis | 40/1053 | 142/8465 | 3.24e-07 | 1.76e-05 | 1.17e-05 | 40 |
| hsa0412022 | Lung | AIS | Ubiquitin mediated proteolysis | 41/961 | 142/8465 | 8.01e-09 | 4.33e-07 | 2.77e-07 | 41 |
| hsa0412032 | Lung | AIS | Ubiquitin mediated proteolysis | 41/961 | 142/8465 | 8.01e-09 | 4.33e-07 | 2.77e-07 | 41 |
| Page: 1 2 |
Top |
Cell-cell communication analysis |
| Identification of potential cell-cell interactions between two cell types and their ligand-receptor pairs for different disease states |
| Ligand | Receptor | LRpair | Pathway | Tissue | Disease Stage |
| Page: 1 |
Top |
Single-cell gene regulatory network inference analysis |
| Find out the significant the regulons (TFs) and the target genes of each regulon across cell types for different disease states |
| TF | Cell Type | Tissue | Disease Stage | Target Gene | RSS | Regulon Activity |
| ∗The dot plots of a searched regulon are shown for all cell subpopulations in each disease state of each tissue based on the regulon specific score inferred using pySCENIC and by calculating the average expression. |
| Page: 1 |
Top |
Somatic mutation of malignant transformation related genes |
| Annotation of somatic variants for genes involved in malignant transformation |
| Hugo Symbol | Variant Class | Variant Classification | dbSNP RS | HGVSc | HGVSp | HGVSp Short | SWISSPROT | BIOTYPE | SIFT | PolyPhen | Tumor Sample Barcode | Tissue | Histology | Sex | Age | Stage | Therapy Types | Drugs | Outcome |
| UBE2B | SNV | Missense_Mutation | novel | c.88N>A | p.Glu30Lys | p.E30K | P63146 | protein_coding | tolerated(0.27) | benign(0.441) | TCGA-PE-A5DE-01 | Breast | breast invasive carcinoma | Female | <65 | I/II | Chemotherapy | taxotere | CR |
| UBE2B | SNV | Missense_Mutation | rs754366298 | c.425N>T | p.Ser142Leu | p.S142L | P63146 | protein_coding | tolerated(0.15) | benign(0.018) | TCGA-AA-A00N-01 | Colorectum | colon adenocarcinoma | Male | >=65 | I/II | Unknown | Unknown | PD |
| UBE2B | SNV | Missense_Mutation | novel | c.187T>C | p.Tyr63His | p.Y63H | P63146 | protein_coding | deleterious(0) | probably_damaging(0.999) | TCGA-AJ-A3EK-01 | Endometrium | uterine corpus endometrioid carcinoma | Female | <65 | I/II | Chemotherapy | carboplatin | CR |
| UBE2B | SNV | Missense_Mutation | rs754366298 | c.425C>T | p.Ser142Leu | p.S142L | P63146 | protein_coding | tolerated(0.15) | benign(0.018) | TCGA-AP-A0LM-01 | Endometrium | uterine corpus endometrioid carcinoma | Female | <65 | III/IV | Chemotherapy | cisplatin | SD |
| UBE2B | SNV | Missense_Mutation | novel | c.55G>T | p.Asp19Tyr | p.D19Y | P63146 | protein_coding | deleterious(0) | probably_damaging(0.975) | TCGA-D1-A1NS-01 | Endometrium | uterine corpus endometrioid carcinoma | Female | <65 | I/II | Unknown | Unknown | SD |
| UBE2B | SNV | Missense_Mutation | novel | c.154N>T | p.Thr52Ser | p.T52S | P63146 | protein_coding | deleterious(0.04) | possibly_damaging(0.514) | TCGA-DI-A1BU-01 | Endometrium | uterine corpus endometrioid carcinoma | Female | <65 | I/II | Chemotherapy | paclitaxel | SD |
| UBE2B | SNV | Missense_Mutation | novel | c.37N>G | p.Phe13Val | p.F13V | P63146 | protein_coding | deleterious(0.02) | benign(0.193) | TCGA-EO-A22X-01 | Endometrium | uterine corpus endometrioid carcinoma | Female | <65 | III/IV | Unspecific | Carboplatin | Complete Response |
| UBE2B | SNV | Missense_Mutation | novel | c.263N>A | p.Cys88Tyr | p.C88Y | P63146 | protein_coding | deleterious(0) | probably_damaging(0.999) | TCGA-97-A4M2-01 | Lung | lung adenocarcinoma | Male | >=65 | I/II | Unknown | Unknown | SD |
| UBE2B | insertion | Frame_Shift_Ins | novel | c.305_306insC | p.Ser103IlefsTer13 | p.S103Ifs*13 | P63146 | protein_coding | TCGA-21-1081-01 | Lung | lung squamous cell carcinoma | Male | >=65 | I/II | Unknown | Unknown | PD |
| Page: 1 |
Top |
Related drugs of malignant transformation related genes |
| Identification of chemicals and drugs interact with genes involved in malignant transfromation |
| (DGIdb 4.0) |
| Entrez ID | Symbol | Category | Interaction Types | Drug Claim Name | Drug Name | PMIDs |
| Page: 1 |

Copyright 2023-Present -The University of Texas Health Science Center at Houston |