
|
|||||
|
 | |
| |
| |
| |
| |
| |
|
Gene: TBC1D5 |
Gene summary for TBC1D5 |
| Gene information | Species | Human | Gene symbol | TBC1D5 | Gene ID | 9779 |
| Gene name | TBC1 domain family member 5 | |
| Gene Alias | TBC1D5 | |
| Cytomap | 3p24.3 | |
| Gene Type | protein-coding | GO ID | GO:0002090 | UniProtAcc | Q92609 |
Top |
Malignant transformation analysis |
| Identification of the aberrant gene expression in precancerous and cancerous lesions by comparing the gene expression of stem-like cells in diseased tissues with normal stem cells |
| Entrez ID | Symbol | Replicates | Species | Organ | Tissue | Adj P-value | Log2FC | Malignancy |
| 9779 | TBC1D5 | CCI_1 | Human | Cervix | CC | 7.31e-04 | 8.11e-01 | 0.528 |
| 9779 | TBC1D5 | CCI_3 | Human | Cervix | CC | 1.29e-11 | 1.49e+00 | 0.516 |
| 9779 | TBC1D5 | sample3 | Human | Cervix | CC | 2.20e-02 | -1.99e-01 | 0.1387 |
| 9779 | TBC1D5 | T3 | Human | Cervix | CC | 3.48e-04 | -1.94e-01 | 0.1389 |
| 9779 | TBC1D5 | HTA11_2487_2000001011 | Human | Colorectum | SER | 1.07e-02 | -4.68e-01 | -0.1808 |
| 9779 | TBC1D5 | HTA11_347_2000001011 | Human | Colorectum | AD | 4.77e-07 | 5.33e-01 | -0.1954 |
| 9779 | TBC1D5 | HTA11_2112_2000001011 | Human | Colorectum | SER | 4.21e-02 | -5.84e-01 | -0.2196 |
| 9779 | TBC1D5 | HTA11_5212_2000001011 | Human | Colorectum | AD | 4.81e-03 | -6.42e-01 | -0.2061 |
| 9779 | TBC1D5 | HTA11_5216_2000001011 | Human | Colorectum | SER | 1.95e-08 | -6.21e-01 | -0.1462 |
| 9779 | TBC1D5 | HTA11_866_3004761011 | Human | Colorectum | AD | 5.53e-03 | -3.74e-01 | 0.096 |
| 9779 | TBC1D5 | HTA11_99999965062_69753 | Human | Colorectum | MSI-H | 9.04e-13 | 1.10e+00 | 0.3487 |
| 9779 | TBC1D5 | HTA11_99999965104_69814 | Human | Colorectum | MSS | 1.53e-06 | 6.19e-01 | 0.281 |
| 9779 | TBC1D5 | HTA11_99999973899_84307 | Human | Colorectum | MSS | 2.02e-06 | -5.32e-01 | 0.2585 |
| 9779 | TBC1D5 | HTA11_99999974143_84620 | Human | Colorectum | MSS | 4.41e-15 | -5.15e-01 | 0.3005 |
| 9779 | TBC1D5 | A015-C-203 | Human | Colorectum | FAP | 5.06e-38 | -5.20e-01 | -0.1294 |
| 9779 | TBC1D5 | A015-C-204 | Human | Colorectum | FAP | 3.78e-05 | -1.79e-01 | -0.0228 |
| 9779 | TBC1D5 | A014-C-040 | Human | Colorectum | FAP | 1.58e-03 | -3.11e-01 | -0.1184 |
| 9779 | TBC1D5 | A002-C-201 | Human | Colorectum | FAP | 1.54e-14 | -4.16e-01 | 0.0324 |
| 9779 | TBC1D5 | A001-C-119 | Human | Colorectum | FAP | 5.59e-11 | -5.49e-01 | -0.1557 |
| 9779 | TBC1D5 | A001-C-108 | Human | Colorectum | FAP | 2.33e-15 | -2.56e-01 | -0.0272 |
| Page: 1 2 3 4 5 6 7 8 9 10 11 12 13 |
| Tissue | Expression Dynamics | Abbreviation |
| Cervix |  | CC: Cervix cancer |
| HSIL_HPV: HPV-infected high-grade squamous intraepithelial lesions | ||
| N_HPV: HPV-infected normal cervix | ||
| Colorectum (GSE201348) |  | FAP: Familial adenomatous polyposis |
| CRC: Colorectal cancer | ||
| Colorectum (HTA11) |  | AD: Adenomas |
| SER: Sessile serrated lesions | ||
| MSI-H: Microsatellite-high colorectal cancer | ||
| MSS: Microsatellite stable colorectal cancer | ||
| Endometrium | 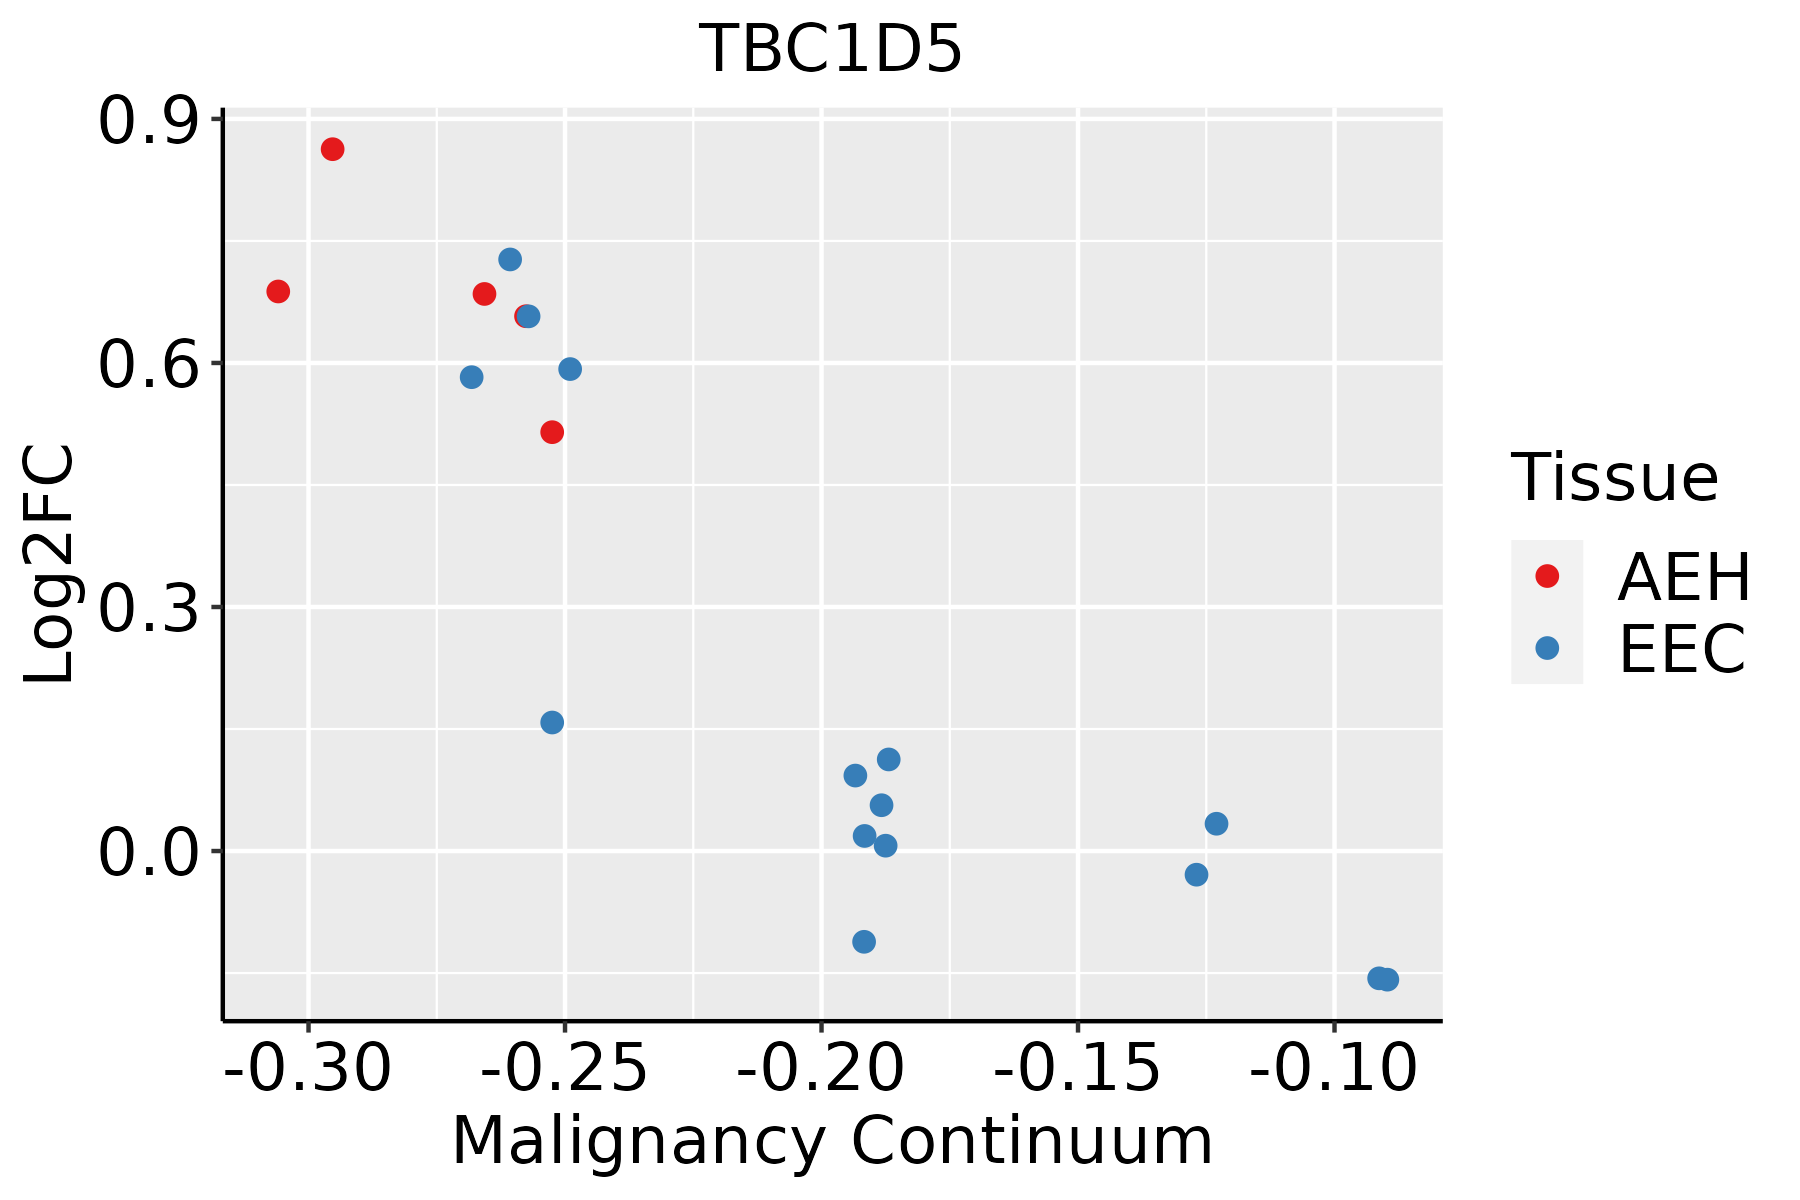 | AEH: Atypical endometrial hyperplasia |
| EEC: Endometrioid Cancer | ||
| Esophagus |  | ESCC: Esophageal squamous cell carcinoma |
| HGIN: High-grade intraepithelial neoplasias | ||
| LGIN: Low-grade intraepithelial neoplasias | ||
| GC |  | CAG: Chronic atrophic gastritis |
| CAG with IM: Chronic atrophic gastritis with intestinal metaplasia | ||
| CSG: Chronic superficial gastritis | ||
| GC: Gastric cancer | ||
| SIM: Severe intestinal metaplasia | ||
| WIM: Wild intestinal metaplasia | ||
| Liver | 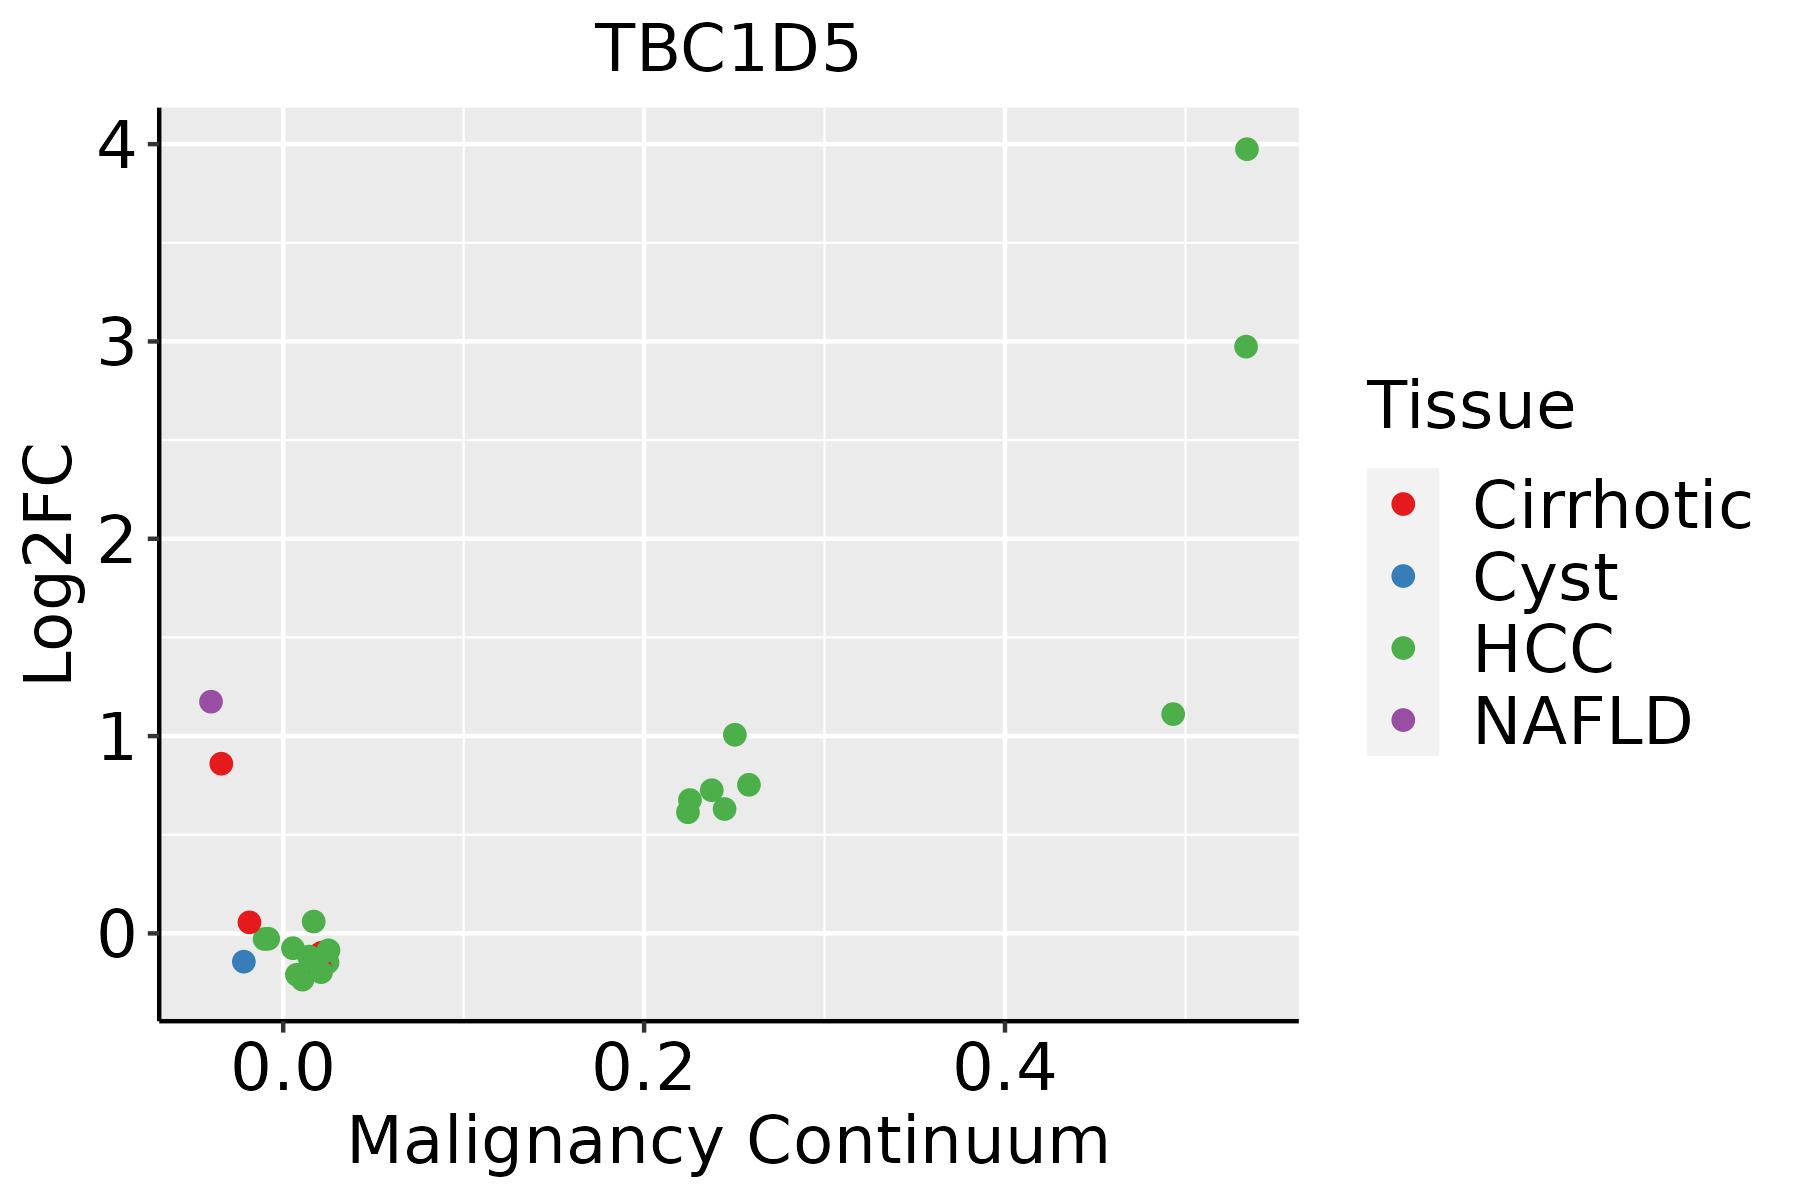 | HCC: Hepatocellular carcinoma |
| NAFLD: Non-alcoholic fatty liver disease | ||
| Lung |  | AAH: Atypical adenomatous hyperplasia |
| AIS: Adenocarcinoma in situ | ||
| IAC: Invasive lung adenocarcinoma | ||
| MIA: Minimally invasive adenocarcinoma | ||
| Oral Cavity | 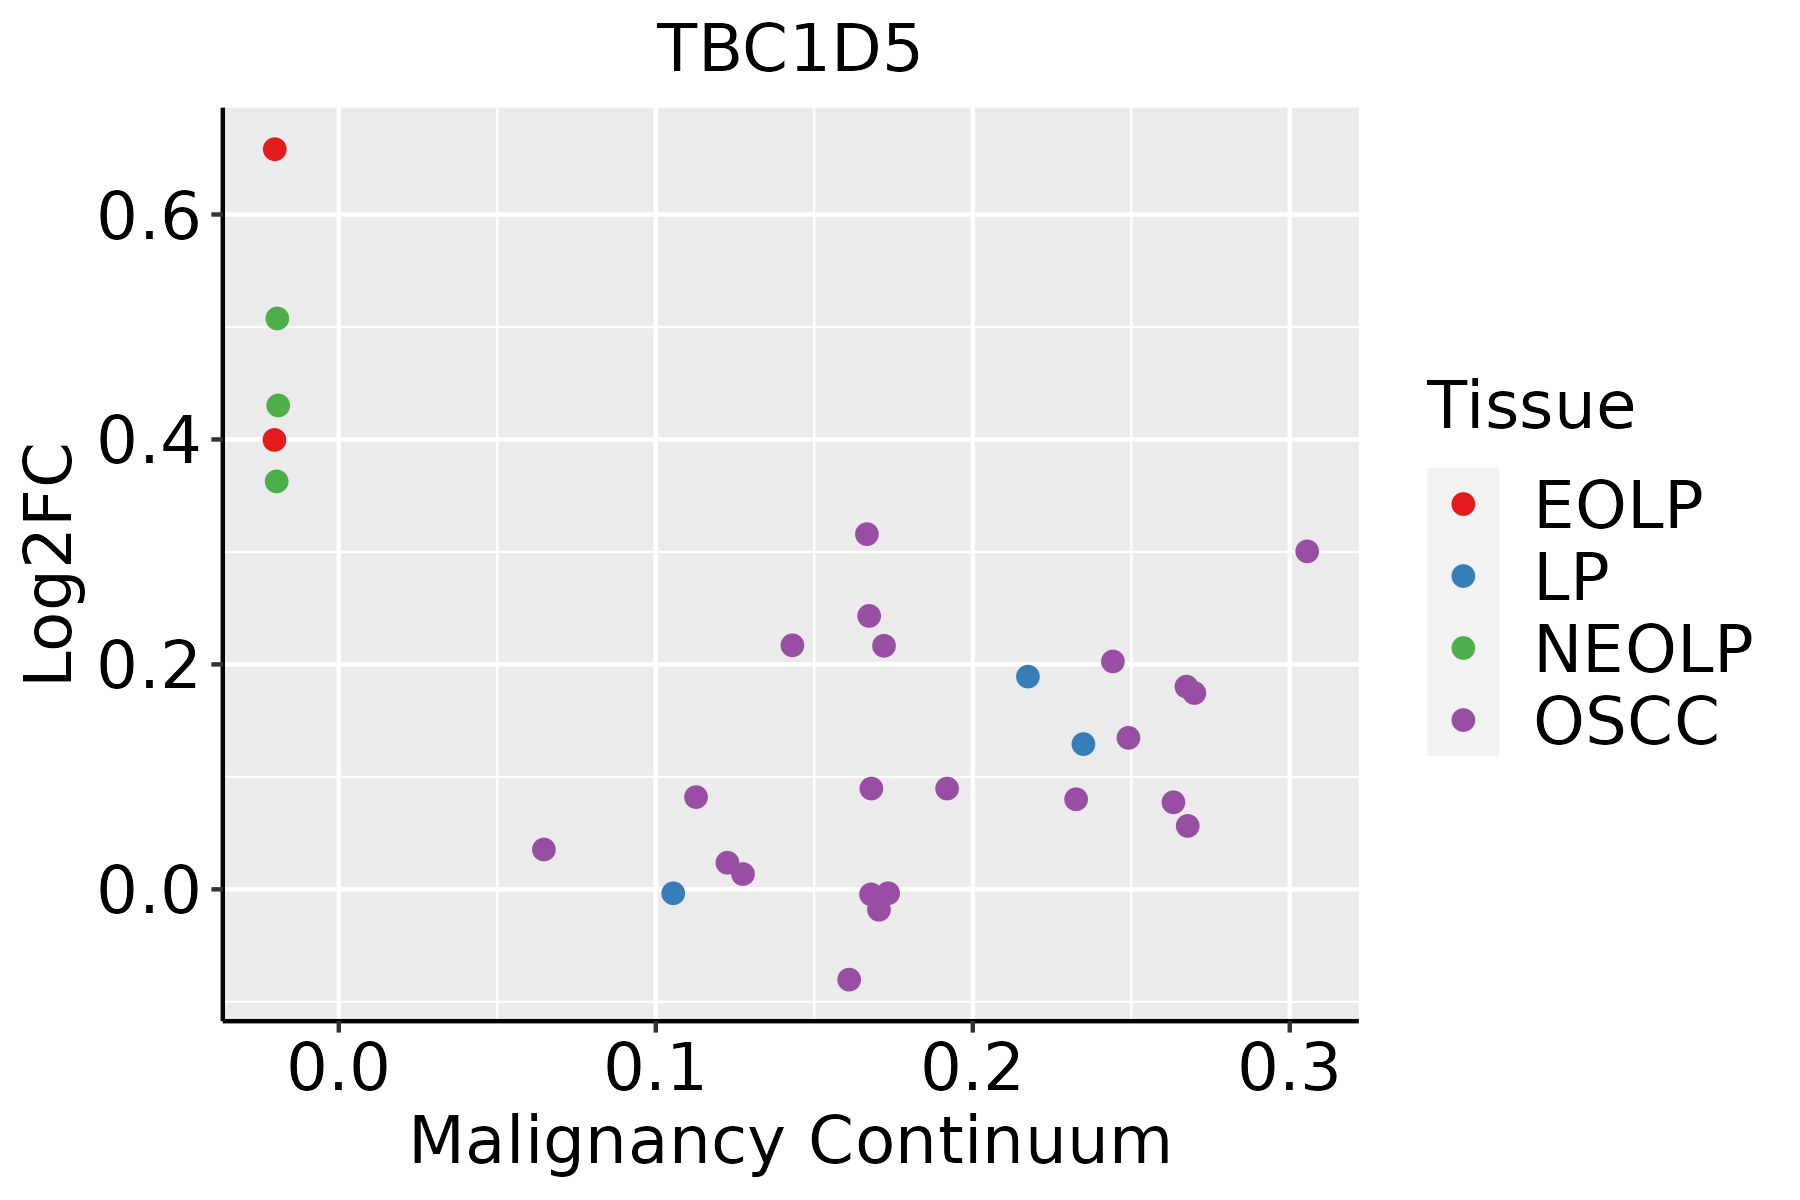 | EOLP: Erosive Oral lichen planus |
| LP: leukoplakia | ||
| NEOLP: Non-erosive oral lichen planus | ||
| OSCC: Oral squamous cell carcinoma | ||
| Prostate | 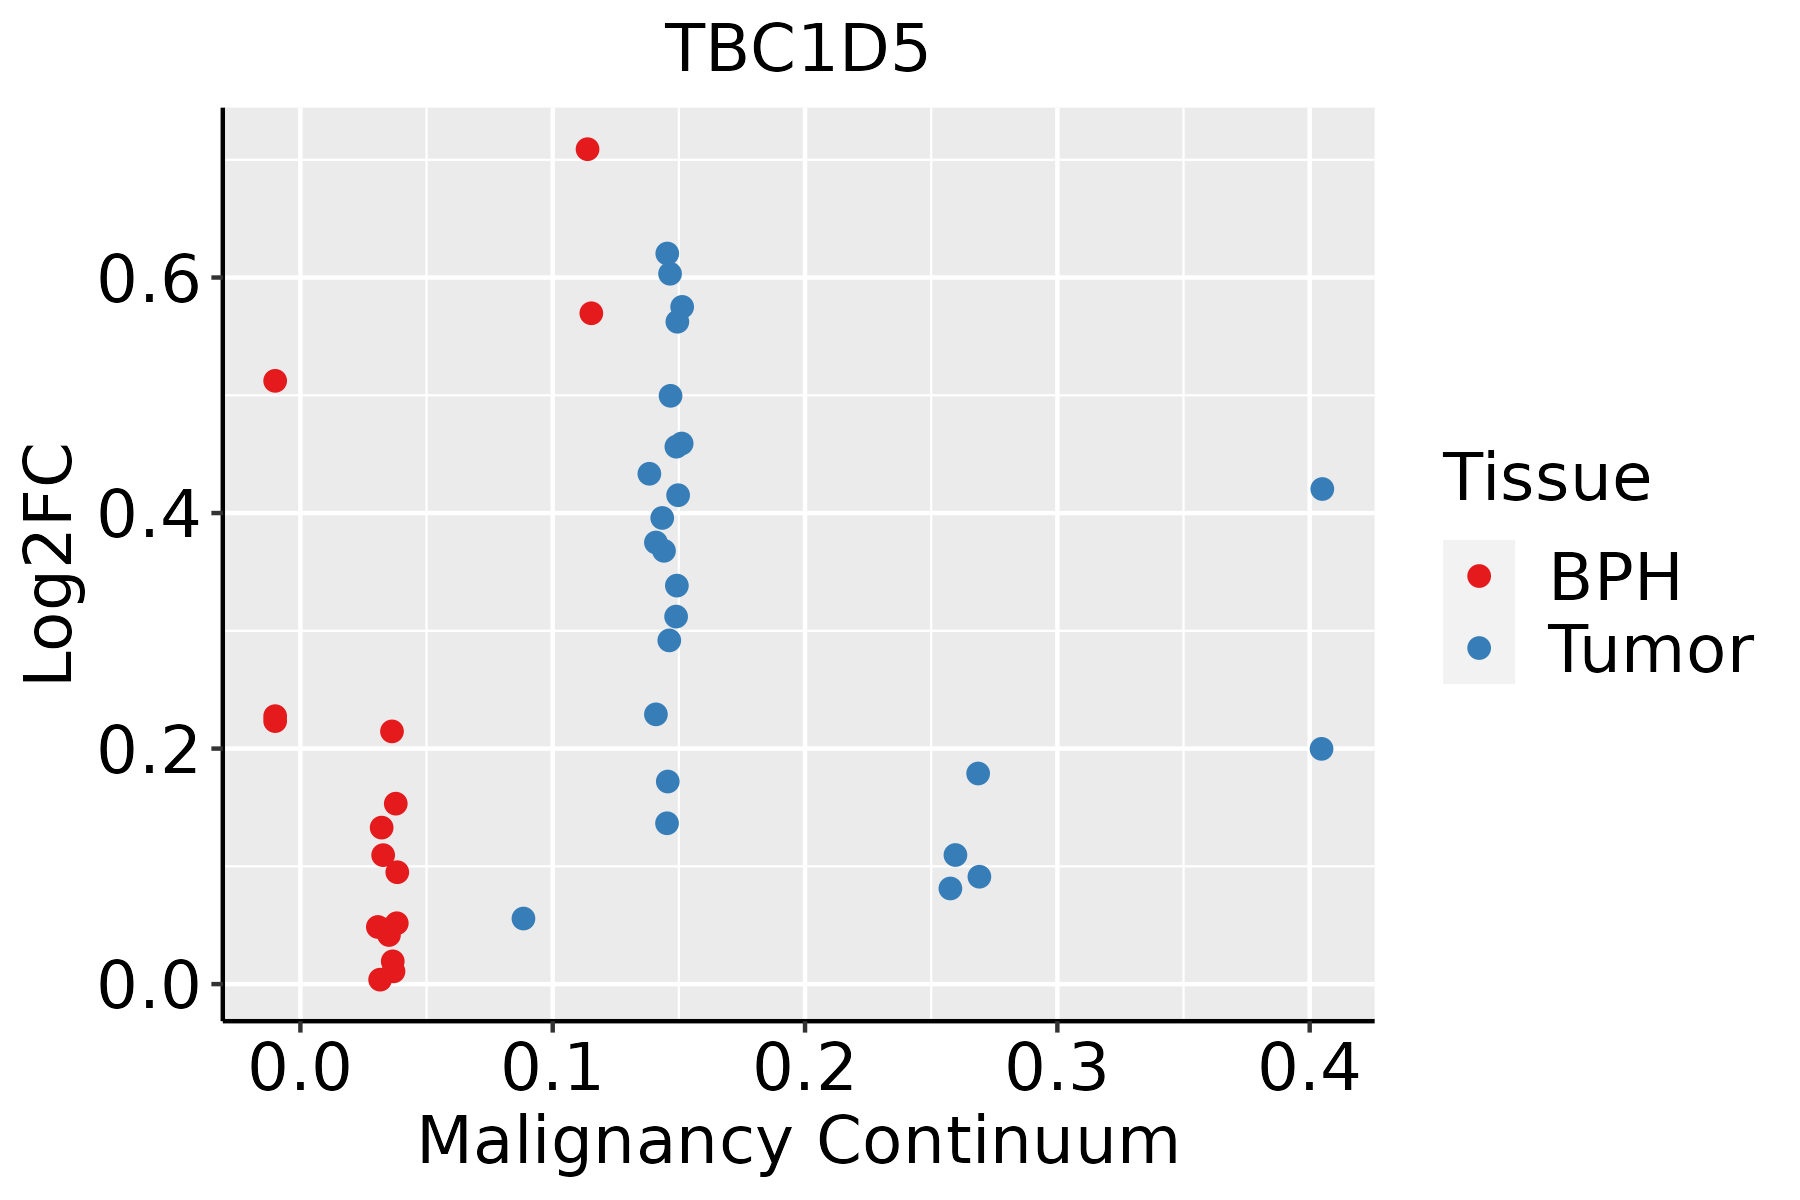 | BPH: Benign Prostatic Hyperplasia |
| Skin | 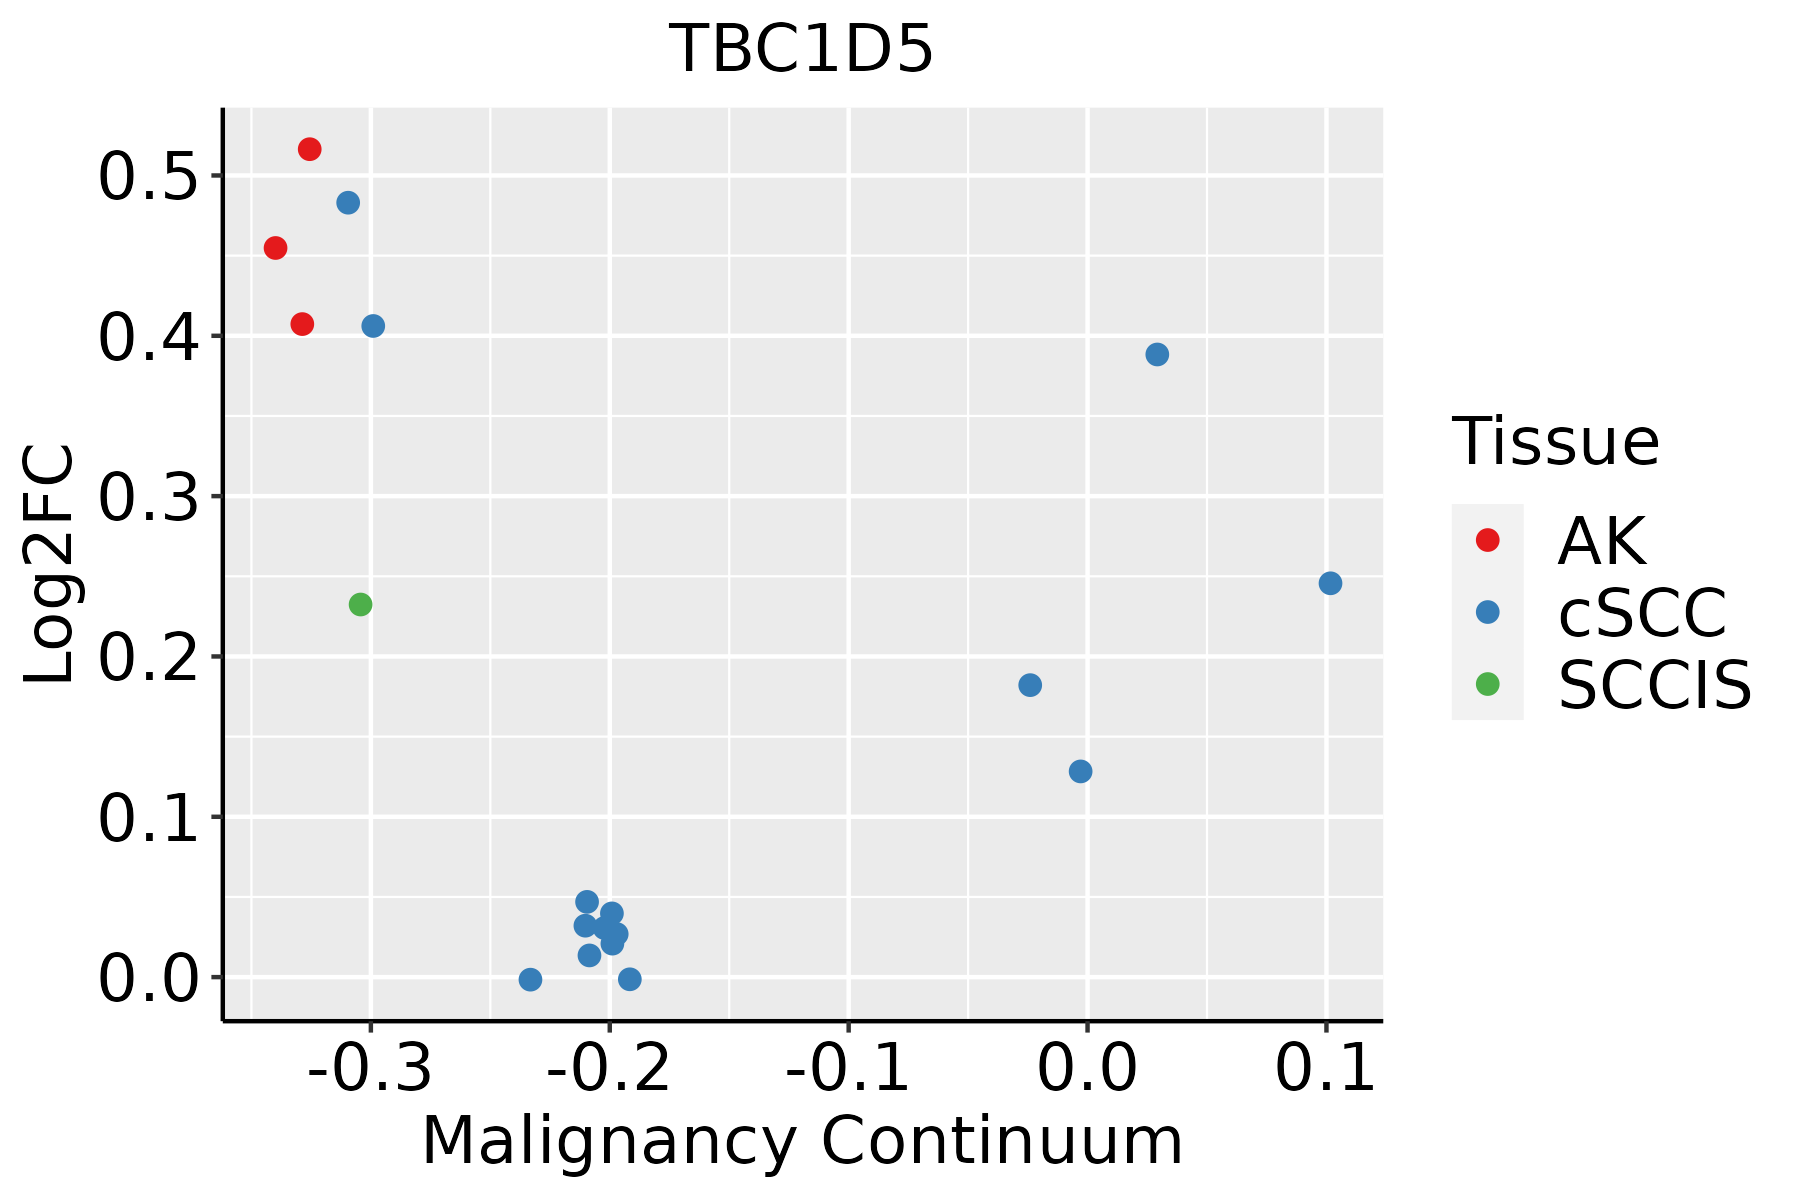 | AK: Actinic keratosis |
| cSCC: Cutaneous squamous cell carcinoma | ||
| SCCIS:squamous cell carcinoma in situ | ||
| Thyroid |  | ATC: Anaplastic thyroid cancer |
| HT: Hashimoto's thyroiditis | ||
| PTC: Papillary thyroid cancer |
| ∗log2FC in expression of this searched gene in stem-like cells from each diseased tissue sample relative to stem-like cells in normal samples in each tissue plotted against the malignancy continuum. Samples are colored based on if they are from different disease stage. |
Top |
Malignant transformation related pathway analysis |
| Find out the enriched GO biological processes and KEGG pathways involved in transition from healthy to precancer to cancer |
| Tissue | Disease Stage | Enriched GO biological Processes |
| Colorectum | AD |  |
| Colorectum | SER |  |
| Colorectum | MSS |  |
| Colorectum | MSI-H |  |
| Colorectum | FAP |  |
| ∗Top 15 enriched GO BP terms are showed in the bar plot of each disease state in each tissue. Each row represents a significant GO biological process which is colored according to the -log10(p.adjust). |
| Page: 1 2 3 4 5 6 7 8 9 |
| GO ID | Tissue | Disease Stage | Description | Gene Ratio | Bg Ratio | pvalue | p.adjust | Count |
| GO:003162310 | Thyroid | ATC | receptor internalization | 52/6293 | 113/18723 | 4.05e-03 | 1.74e-02 | 52 |
| GO:004354715 | Thyroid | ATC | positive regulation of GTPase activity | 106/6293 | 255/18723 | 4.58e-03 | 1.89e-02 | 106 |
| GO:00020904 | Thyroid | ATC | regulation of receptor internalization | 28/6293 | 56/18723 | 8.12e-03 | 3.13e-02 | 28 |
| Page: 1 2 3 4 5 6 7 8 9 10 11 12 13 14 15 16 17 |
| Pathway ID | Tissue | Disease Stage | Description | Gene Ratio | Bg Ratio | pvalue | p.adjust | qvalue | Count |
| Page: 1 |
Top |
Cell-cell communication analysis |
| Identification of potential cell-cell interactions between two cell types and their ligand-receptor pairs for different disease states |
| Ligand | Receptor | LRpair | Pathway | Tissue | Disease Stage |
| Page: 1 |
Top |
Single-cell gene regulatory network inference analysis |
| Find out the significant the regulons (TFs) and the target genes of each regulon across cell types for different disease states |
| TF | Cell Type | Tissue | Disease Stage | Target Gene | RSS | Regulon Activity |
| ∗The dot plots of a searched regulon are shown for all cell subpopulations in each disease state of each tissue based on the regulon specific score inferred using pySCENIC and by calculating the average expression. |
| Page: 1 |
Top |
Somatic mutation of malignant transformation related genes |
| Annotation of somatic variants for genes involved in malignant transformation |
| Hugo Symbol | Variant Class | Variant Classification | dbSNP RS | HGVSc | HGVSp | HGVSp Short | SWISSPROT | BIOTYPE | SIFT | PolyPhen | Tumor Sample Barcode | Tissue | Histology | Sex | Age | Stage | Therapy Types | Drugs | Outcome |
| TBC1D5 | SNV | Missense_Mutation | c.2287C>A | p.Leu763Ile | p.L763I | Q92609 | protein_coding | tolerated_low_confidence(0.41) | benign(0) | TCGA-A8-A07W-01 | Breast | breast invasive carcinoma | Female | >=65 | III/IV | Hormone Therapy | exemestane | SD | |
| TBC1D5 | SNV | Missense_Mutation | c.2047G>C | p.Glu683Gln | p.E683Q | Q92609 | protein_coding | deleterious(0) | probably_damaging(0.981) | TCGA-C8-A12T-01 | Breast | breast invasive carcinoma | Female | <65 | I/II | Unknown | Unknown | SD | |
| TBC1D5 | SNV | Missense_Mutation | c.819N>C | p.Gln273His | p.Q273H | Q92609 | protein_coding | tolerated(0.1) | possibly_damaging(0.747) | TCGA-D8-A1JA-01 | Breast | breast invasive carcinoma | Female | <65 | III/IV | Chemotherapy | adriamycin | PD | |
| TBC1D5 | SNV | Missense_Mutation | c.2021C>T | p.Ser674Phe | p.S674F | Q92609 | protein_coding | deleterious(0) | possibly_damaging(0.656) | TCGA-2W-A8YY-01 | Cervix | cervical & endocervical cancer | Female | <65 | I/II | Chemotherapy | cisplatin | CR | |
| TBC1D5 | SNV | Missense_Mutation | novel | c.1423C>T | p.Pro475Ser | p.P475S | Q92609 | protein_coding | tolerated(0.99) | benign(0.001) | TCGA-2W-A8YY-01 | Cervix | cervical & endocervical cancer | Female | <65 | I/II | Chemotherapy | cisplatin | CR |
| TBC1D5 | SNV | Missense_Mutation | c.100N>C | p.Asp34His | p.D34H | Q92609 | protein_coding | deleterious_low_confidence(0.05) | benign(0.215) | TCGA-4J-AA1J-01 | Cervix | cervical & endocervical cancer | Female | <65 | I/II | Unknown | Unknown | SD | |
| TBC1D5 | SNV | Missense_Mutation | c.1376N>G | p.Asn459Ser | p.N459S | Q92609 | protein_coding | tolerated(1) | benign(0.003) | TCGA-C5-A1BN-01 | Cervix | cervical & endocervical cancer | Female | <65 | I/II | Chemotherapy | cisplatin | PD | |
| TBC1D5 | SNV | Missense_Mutation | c.2291N>A | p.Arg764Lys | p.R764K | Q92609 | protein_coding | tolerated_low_confidence(0.36) | benign(0) | TCGA-C5-A1BQ-01 | Cervix | cervical & endocervical cancer | Female | >=65 | III/IV | Chemotherapy | cisplatin | CR | |
| TBC1D5 | SNV | Missense_Mutation | c.34N>G | p.Leu12Val | p.L12V | Q92609 | protein_coding | deleterious_low_confidence(0.01) | probably_damaging(0.994) | TCGA-C5-A1BQ-01 | Cervix | cervical & endocervical cancer | Female | >=65 | III/IV | Chemotherapy | cisplatin | CR | |
| TBC1D5 | SNV | Missense_Mutation | c.2291N>A | p.Arg764Lys | p.R764K | Q92609 | protein_coding | tolerated_low_confidence(0.36) | benign(0) | TCGA-C5-A3HL-01 | Cervix | cervical & endocervical cancer | Female | >=65 | I/II | Unknown | Unknown | SD |
| Page: 1 2 3 4 5 6 7 8 9 |
Top |
Related drugs of malignant transformation related genes |
| Identification of chemicals and drugs interact with genes involved in malignant transfromation |
| (DGIdb 4.0) |
| Entrez ID | Symbol | Category | Interaction Types | Drug Claim Name | Drug Name | PMIDs |
| Page: 1 |

Copyright 2023-Present -The University of Texas Health Science Center at Houston |