
|
|||||
|
 | |
| |
| |
| |
| |
| |
|
Gene: SP2 |
Gene summary for SP2 |
| Gene information | Species | Human | Gene symbol | SP2 | Gene ID | 6668 |
| Gene name | Sp2 transcription factor | |
| Gene Alias | SP2 | |
| Cytomap | 17q21.32 | |
| Gene Type | protein-coding | GO ID | GO:0000122 | UniProtAcc | Q02086 |
Top |
Malignant transformation analysis |
| Identification of the aberrant gene expression in precancerous and cancerous lesions by comparing the gene expression of stem-like cells in diseased tissues with normal stem cells |
| Entrez ID | Symbol | Replicates | Species | Organ | Tissue | Adj P-value | Log2FC | Malignancy |
| 6668 | SP2 | LZE4T | Human | Esophagus | ESCC | 8.55e-09 | 1.70e-01 | 0.0811 |
| 6668 | SP2 | LZE8T | Human | Esophagus | ESCC | 3.33e-02 | 8.88e-02 | 0.067 |
| 6668 | SP2 | LZE24T | Human | Esophagus | ESCC | 1.83e-09 | 2.13e-01 | 0.0596 |
| 6668 | SP2 | LZE21T | Human | Esophagus | ESCC | 2.46e-05 | 2.67e-01 | 0.0655 |
| 6668 | SP2 | P1T-E | Human | Esophagus | ESCC | 1.11e-05 | 3.33e-01 | 0.0875 |
| 6668 | SP2 | P2T-E | Human | Esophagus | ESCC | 5.79e-19 | 2.59e-01 | 0.1177 |
| 6668 | SP2 | P4T-E | Human | Esophagus | ESCC | 5.86e-08 | 1.77e-01 | 0.1323 |
| 6668 | SP2 | P5T-E | Human | Esophagus | ESCC | 7.06e-09 | 6.78e-02 | 0.1327 |
| 6668 | SP2 | P8T-E | Human | Esophagus | ESCC | 1.21e-15 | 3.35e-01 | 0.0889 |
| 6668 | SP2 | P9T-E | Human | Esophagus | ESCC | 1.76e-04 | 1.10e-01 | 0.1131 |
| 6668 | SP2 | P10T-E | Human | Esophagus | ESCC | 2.19e-18 | 2.01e-01 | 0.116 |
| 6668 | SP2 | P11T-E | Human | Esophagus | ESCC | 2.16e-06 | 3.30e-01 | 0.1426 |
| 6668 | SP2 | P12T-E | Human | Esophagus | ESCC | 1.08e-18 | 2.80e-01 | 0.1122 |
| 6668 | SP2 | P15T-E | Human | Esophagus | ESCC | 3.46e-10 | 2.25e-01 | 0.1149 |
| 6668 | SP2 | P16T-E | Human | Esophagus | ESCC | 4.54e-16 | 2.13e-01 | 0.1153 |
| 6668 | SP2 | P17T-E | Human | Esophagus | ESCC | 1.65e-05 | 2.06e-01 | 0.1278 |
| 6668 | SP2 | P19T-E | Human | Esophagus | ESCC | 3.63e-04 | 2.50e-01 | 0.1662 |
| 6668 | SP2 | P20T-E | Human | Esophagus | ESCC | 8.04e-15 | 2.29e-01 | 0.1124 |
| 6668 | SP2 | P21T-E | Human | Esophagus | ESCC | 3.45e-11 | 2.12e-01 | 0.1617 |
| 6668 | SP2 | P22T-E | Human | Esophagus | ESCC | 5.57e-10 | 1.33e-01 | 0.1236 |
| Page: 1 2 3 |
| Tissue | Expression Dynamics | Abbreviation |
| Esophagus | 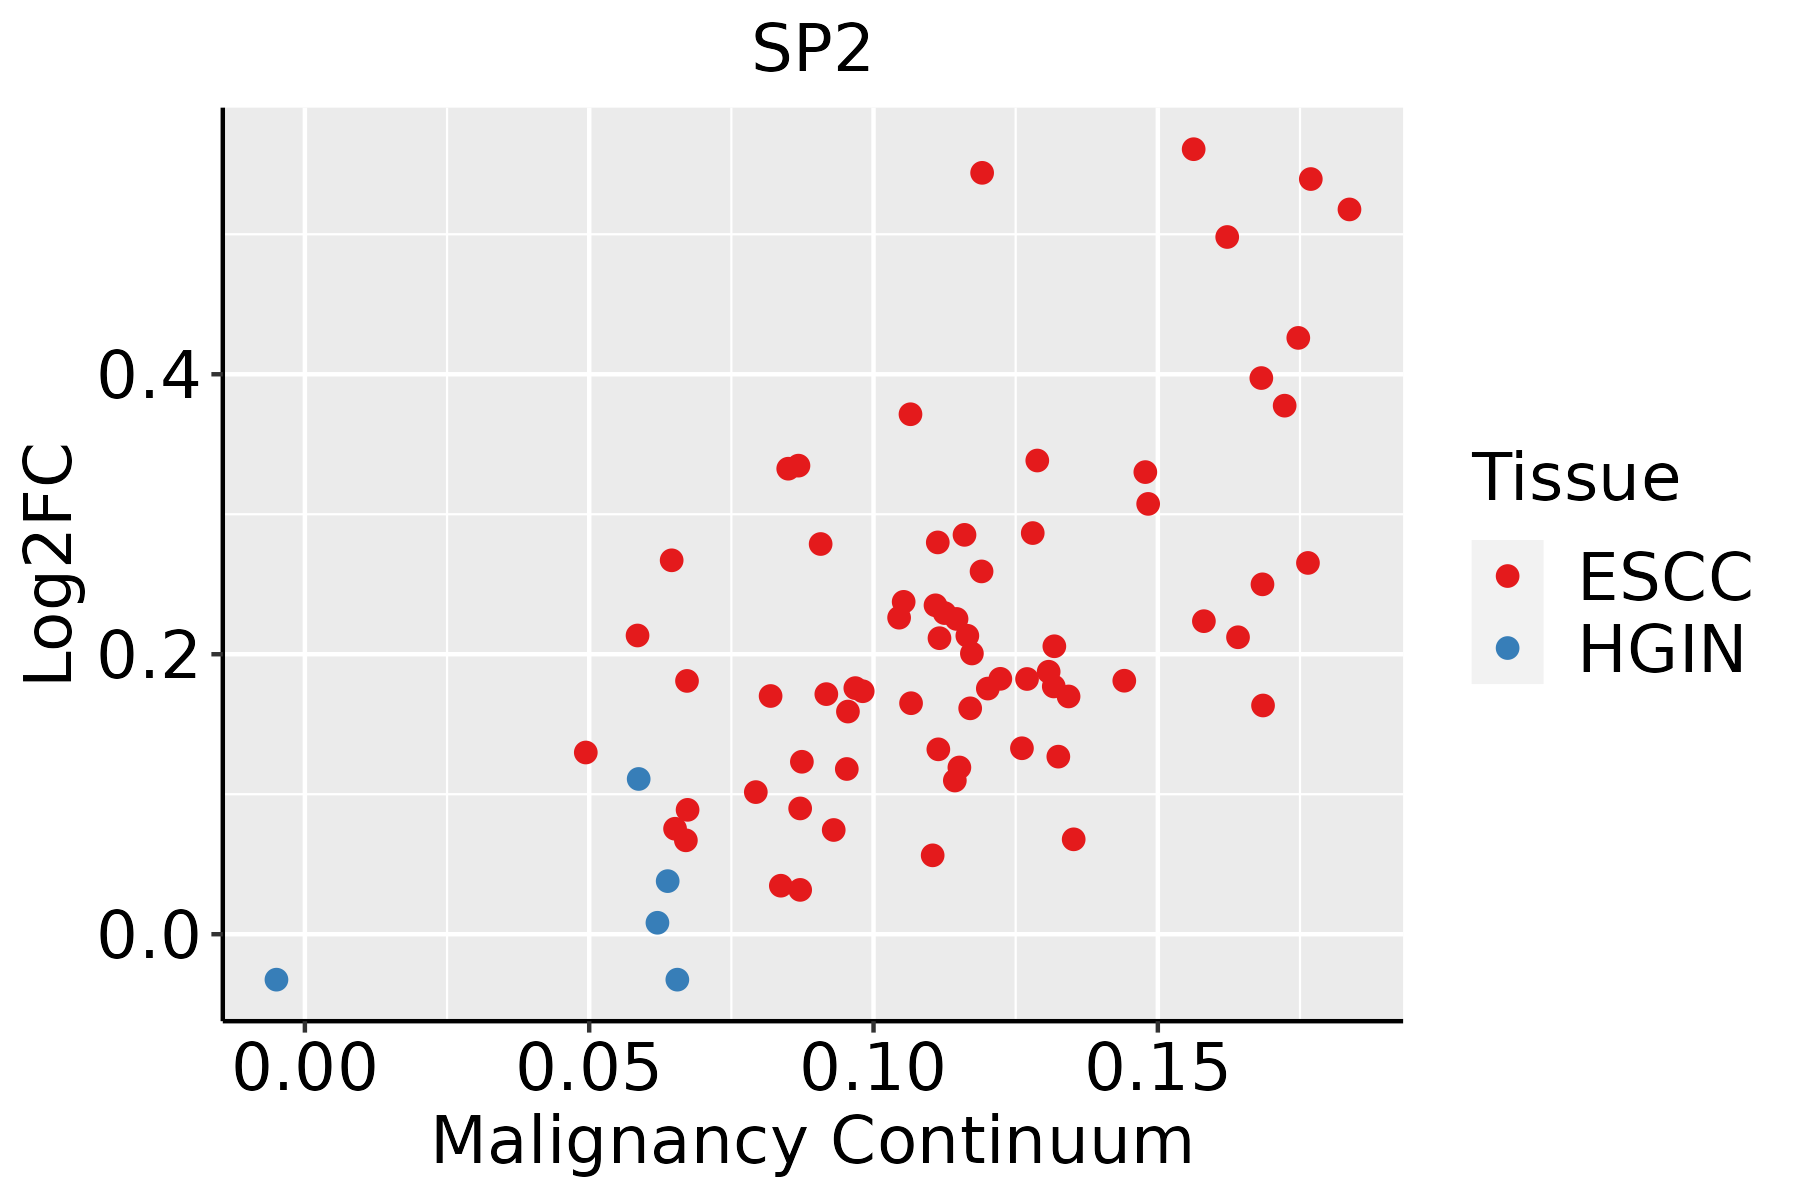 | ESCC: Esophageal squamous cell carcinoma |
| HGIN: High-grade intraepithelial neoplasias | ||
| LGIN: Low-grade intraepithelial neoplasias |
| ∗log2FC in expression of this searched gene in stem-like cells from each diseased tissue sample relative to stem-like cells in normal samples in each tissue plotted against the malignancy continuum. Samples are colored based on if they are from different disease stage. |
Top |
Malignant transformation related pathway analysis |
| Find out the enriched GO biological processes and KEGG pathways involved in transition from healthy to precancer to cancer |
| Tissue | Disease Stage | Enriched GO biological Processes |
| Colorectum | AD |  |
| Colorectum | SER |  |
| Colorectum | MSS |  |
| Colorectum | MSI-H |  |
| Colorectum | FAP |  |
| ∗Top 15 enriched GO BP terms are showed in the bar plot of each disease state in each tissue. Each row represents a significant GO biological process which is colored according to the -log10(p.adjust). |
| Page: 1 2 3 4 5 6 7 8 9 |
| GO ID | Tissue | Disease Stage | Description | Gene Ratio | Bg Ratio | pvalue | p.adjust | Count |
| GO:19029043 | Colorectum | FAP | negative regulation of supramolecular fiber organization | 38/2622 | 167/18723 | 1.47e-03 | 1.31e-02 | 38 |
| GO:00070512 | Colorectum | FAP | spindle organization | 41/2622 | 184/18723 | 1.50e-03 | 1.34e-02 | 41 |
| GO:0001837 | Colorectum | FAP | epithelial to mesenchymal transition | 36/2622 | 157/18723 | 1.67e-03 | 1.47e-02 | 36 |
| GO:00514943 | Colorectum | FAP | negative regulation of cytoskeleton organization | 37/2622 | 163/18723 | 1.76e-03 | 1.53e-02 | 37 |
| GO:0060485 | Colorectum | FAP | mesenchyme development | 59/2622 | 291/18723 | 1.94e-03 | 1.64e-02 | 59 |
| GO:00071621 | Colorectum | FAP | negative regulation of cell adhesion | 61/2622 | 303/18723 | 1.96e-03 | 1.65e-02 | 61 |
| GO:00069033 | Colorectum | FAP | vesicle targeting | 14/2622 | 45/18723 | 2.53e-03 | 1.99e-02 | 14 |
| GO:00458614 | Colorectum | FAP | negative regulation of proteolysis | 68/2622 | 351/18723 | 3.07e-03 | 2.31e-02 | 68 |
| GO:00459213 | Colorectum | FAP | positive regulation of exocytosis | 22/2622 | 86/18723 | 3.11e-03 | 2.33e-02 | 22 |
| GO:00073462 | Colorectum | FAP | regulation of mitotic cell cycle | 85/2622 | 457/18723 | 3.41e-03 | 2.48e-02 | 85 |
| GO:00611364 | Colorectum | FAP | regulation of proteasomal protein catabolic process | 40/2622 | 187/18723 | 3.69e-03 | 2.62e-02 | 40 |
| GO:00165741 | Colorectum | FAP | histone ubiquitination | 14/2622 | 47/18723 | 3.95e-03 | 2.75e-02 | 14 |
| GO:00432442 | Colorectum | FAP | regulation of protein-containing complex disassembly | 28/2622 | 121/18723 | 4.50e-03 | 3.06e-02 | 28 |
| GO:00512612 | Colorectum | FAP | protein depolymerization | 26/2622 | 114/18723 | 7.36e-03 | 4.40e-02 | 26 |
| GO:00432421 | Colorectum | FAP | negative regulation of protein-containing complex disassembly | 20/2622 | 82/18723 | 8.23e-03 | 4.82e-02 | 20 |
| GO:00171572 | Colorectum | FAP | regulation of exocytosis | 41/2622 | 202/18723 | 8.51e-03 | 4.95e-02 | 41 |
| GO:00459311 | Colorectum | FAP | positive regulation of mitotic cell cycle | 27/2622 | 121/18723 | 8.64e-03 | 4.98e-02 | 27 |
| GO:00726595 | Colorectum | CRC | protein localization to plasma membrane | 80/2078 | 284/18723 | 1.36e-15 | 4.07e-12 | 80 |
| GO:00070155 | Colorectum | CRC | actin filament organization | 104/2078 | 442/18723 | 4.75e-14 | 7.12e-11 | 104 |
| GO:19907785 | Colorectum | CRC | protein localization to cell periphery | 85/2078 | 333/18723 | 8.75e-14 | 1.05e-10 | 85 |
| Page: 1 2 3 4 5 6 7 8 9 10 11 12 13 14 15 16 17 18 19 20 21 22 23 24 25 26 27 28 29 30 31 32 33 34 35 36 37 38 39 40 41 42 43 44 45 46 47 48 49 50 51 52 53 54 55 56 57 58 59 60 61 62 63 64 65 66 67 68 69 70 71 72 73 74 75 76 77 78 79 80 81 82 83 84 85 86 87 88 89 90 91 |
| Pathway ID | Tissue | Disease Stage | Description | Gene Ratio | Bg Ratio | pvalue | p.adjust | qvalue | Count |
| Page: 1 |
Top |
Cell-cell communication analysis |
| Identification of potential cell-cell interactions between two cell types and their ligand-receptor pairs for different disease states |
| Ligand | Receptor | LRpair | Pathway | Tissue | Disease Stage |
| Page: 1 |
Top |
Single-cell gene regulatory network inference analysis |
| Find out the significant the regulons (TFs) and the target genes of each regulon across cell types for different disease states |
| TF | Cell Type | Tissue | Disease Stage | Target Gene | RSS | Regulon Activity |
| SP2 | DIF | Skin | cSCC | MT1M,NOS1AP,TBC1D31, etc. | 3.96e-01 |  |
| SP2 | GC | Stomach | CAG | ZNRD1,AC010642.1,RAB3IP, etc. | 1.76e-02 |  |
| SP2 | BMEM | Stomach | Healthy | ZNRD1,AC010642.1,RAB3IP, etc. | 1.22e-02 |  |
| SP2 | TREG | Stomach | SIM | ZNRD1,AC010642.1,RAB3IP, etc. | 6.08e-02 |  |
| SP2 | BN | Stomach | SIM | ZNRD1,AC010642.1,RAB3IP, etc. | 2.22e-02 | |
| ∗The dot plots of a searched regulon are shown for all cell subpopulations in each disease state of each tissue based on the regulon specific score inferred using pySCENIC and by calculating the average expression. |
| Page: 1 |
Top |
Somatic mutation of malignant transformation related genes |
| Annotation of somatic variants for genes involved in malignant transformation |
| Hugo Symbol | Variant Class | Variant Classification | dbSNP RS | HGVSc | HGVSp | HGVSp Short | SWISSPROT | BIOTYPE | SIFT | PolyPhen | Tumor Sample Barcode | Tissue | Histology | Sex | Age | Stage | Therapy Types | Drugs | Outcome |
| SP2 | SNV | Missense_Mutation | c.1657C>T | p.Arg553Trp | p.R553W | Q02086 | protein_coding | deleterious(0) | probably_damaging(1) | TCGA-A1-A0SO-01 | Breast | breast invasive carcinoma | Female | >=65 | I/II | Chemotherapy | SD | ||
| SP2 | SNV | Missense_Mutation | novel | c.1277N>T | p.Ala426Val | p.A426V | Q02086 | protein_coding | deleterious(0.03) | benign(0.039) | TCGA-AN-A046-01 | Breast | breast invasive carcinoma | Female | >=65 | I/II | Unknown | Unknown | SD |
| SP2 | SNV | Missense_Mutation | novel | c.1249N>T | p.Pro417Ser | p.P417S | Q02086 | protein_coding | deleterious(0.02) | benign(0.355) | TCGA-BH-A0HF-01 | Breast | breast invasive carcinoma | Female | >=65 | I/II | Hormone Therapy | arimidex | SD |
| SP2 | deletion | Frame_Shift_Del | novel | c.831delN | p.Ile278SerfsTer117 | p.I278Sfs*117 | Q02086 | protein_coding | TCGA-D8-A27V-01 | Breast | breast invasive carcinoma | Female | <65 | I/II | Hormone Therapy | tamoxiphen | SD | ||
| SP2 | deletion | Frame_Shift_Del | c.1113delN | p.Pro373GlnfsTer22 | p.P373Qfs*22 | Q02086 | protein_coding | TCGA-D8-A27V-01 | Breast | breast invasive carcinoma | Female | <65 | I/II | Hormone Therapy | tamoxiphen | SD | |||
| SP2 | SNV | Missense_Mutation | c.787G>A | p.Glu263Lys | p.E263K | Q02086 | protein_coding | deleterious(0.05) | possibly_damaging(0.551) | TCGA-EK-A3GJ-01 | Cervix | cervical & endocervical cancer | Female | <65 | I/II | Unknown | Unknown | SD | |
| SP2 | SNV | Missense_Mutation | c.1504N>T | p.Arg502Cys | p.R502C | Q02086 | protein_coding | deleterious(0) | probably_damaging(0.996) | TCGA-A6-3809-01 | Colorectum | colon adenocarcinoma | Female | >=65 | I/II | Unknown | Unknown | SD | |
| SP2 | SNV | Missense_Mutation | novel | c.1738N>G | p.Thr580Ala | p.T580A | Q02086 | protein_coding | deleterious(0) | possibly_damaging(0.602) | TCGA-A6-5665-01 | Colorectum | colon adenocarcinoma | Female | >=65 | I/II | Unknown | Unknown | PD |
| SP2 | SNV | Missense_Mutation | c.529G>A | p.Val177Ile | p.V177I | Q02086 | protein_coding | tolerated(0.06) | possibly_damaging(0.69) | TCGA-CK-4951-01 | Colorectum | colon adenocarcinoma | Female | >=65 | I/II | Unknown | Unknown | PD | |
| SP2 | SNV | Missense_Mutation | c.401C>T | p.Ala134Val | p.A134V | Q02086 | protein_coding | tolerated(1) | benign(0.001) | TCGA-D5-6540-01 | Colorectum | colon adenocarcinoma | Male | >=65 | I/II | Unknown | Unknown | SD |
| Page: 1 2 3 4 |
Top |
Related drugs of malignant transformation related genes |
| Identification of chemicals and drugs interact with genes involved in malignant transfromation |
| (DGIdb 4.0) |
| Entrez ID | Symbol | Category | Interaction Types | Drug Claim Name | Drug Name | PMIDs |
| Page: 1 |

Copyright 2023-Present -The University of Texas Health Science Center at Houston |