
|
|||||
|
 | |
| |
| |
| |
| |
| |
|
Gene: RP2 |
Gene summary for RP2 |
| Gene information | Species | Human | Gene symbol | RP2 | Gene ID | 6102 |
| Gene name | RP2 activator of ARL3 GTPase | |
| Gene Alias | DELXp11.3 | |
| Cytomap | Xp11.3 | |
| Gene Type | protein-coding | GO ID | GO:0000902 | UniProtAcc | A0A1B2JLU2 |
Top |
Malignant transformation analysis |
| Identification of the aberrant gene expression in precancerous and cancerous lesions by comparing the gene expression of stem-like cells in diseased tissues with normal stem cells |
| Entrez ID | Symbol | Replicates | Species | Organ | Tissue | Adj P-value | Log2FC | Malignancy |
| 6102 | RP2 | HCC1_Meng | Human | Liver | HCC | 3.70e-16 | -1.45e-02 | 0.0246 |
| 6102 | RP2 | HCC2_Meng | Human | Liver | HCC | 2.51e-10 | 3.31e-02 | 0.0107 |
| 6102 | RP2 | HCC1 | Human | Liver | HCC | 8.75e-20 | 4.36e+00 | 0.5336 |
| 6102 | RP2 | S027 | Human | Liver | HCC | 4.76e-05 | 6.01e-01 | 0.2446 |
| 6102 | RP2 | S028 | Human | Liver | HCC | 3.73e-10 | 5.30e-01 | 0.2503 |
| 6102 | RP2 | S029 | Human | Liver | HCC | 1.76e-16 | 7.54e-01 | 0.2581 |
| 6102 | RP2 | male-WTA | Human | Thyroid | PTC | 4.35e-04 | -1.97e-02 | 0.1037 |
| 6102 | RP2 | PTC04 | Human | Thyroid | PTC | 1.81e-02 | 1.34e-02 | 0.1927 |
| 6102 | RP2 | PTC07 | Human | Thyroid | PTC | 1.52e-06 | 1.42e-02 | 0.2044 |
| 6102 | RP2 | ATC12 | Human | Thyroid | ATC | 2.64e-02 | -4.87e-03 | 0.34 |
| 6102 | RP2 | ATC13 | Human | Thyroid | ATC | 4.65e-23 | 9.51e-02 | 0.34 |
| 6102 | RP2 | ATC2 | Human | Thyroid | ATC | 5.54e-15 | 1.02e+00 | 0.34 |
| 6102 | RP2 | ATC5 | Human | Thyroid | ATC | 3.28e-12 | 1.14e-01 | 0.34 |
| Page: 1 |
| Tissue | Expression Dynamics | Abbreviation |
| Liver | 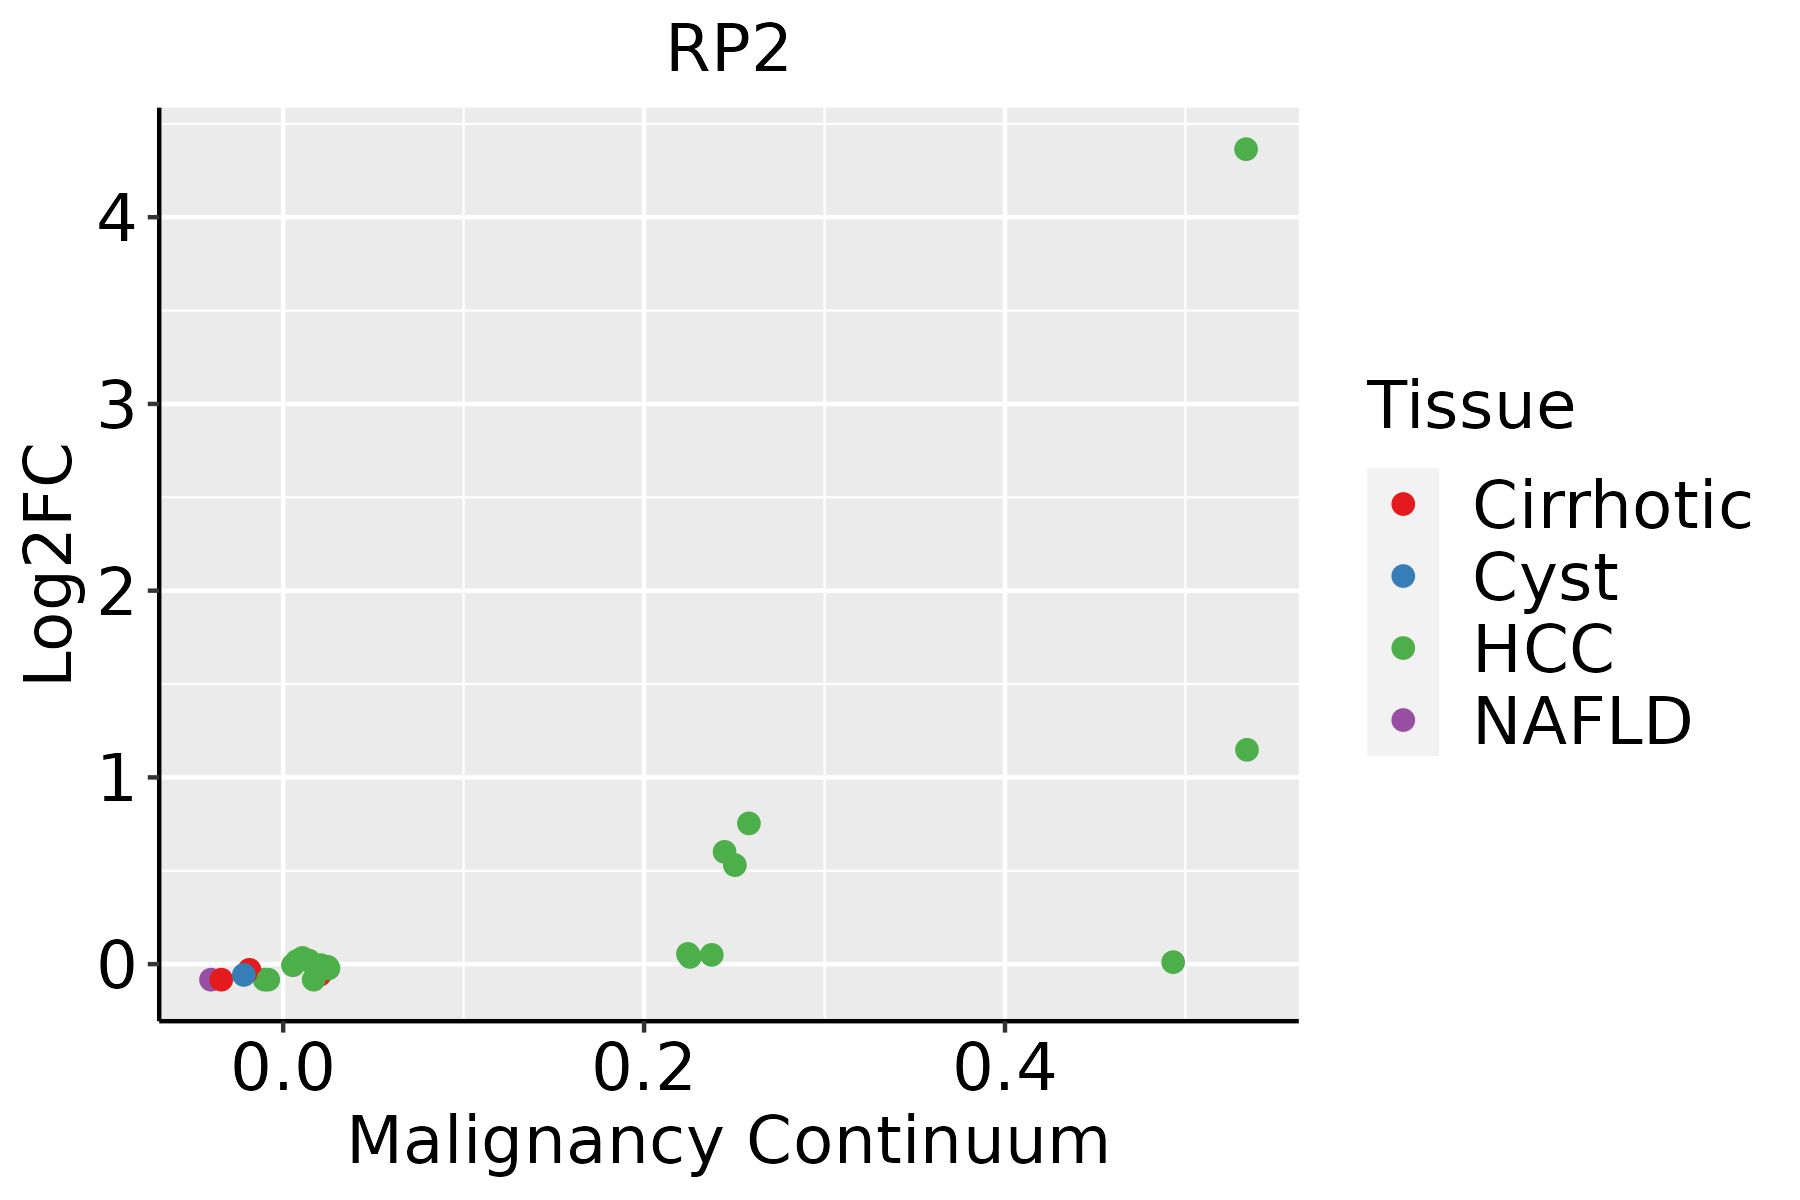 | HCC: Hepatocellular carcinoma |
| NAFLD: Non-alcoholic fatty liver disease | ||
| Thyroid | 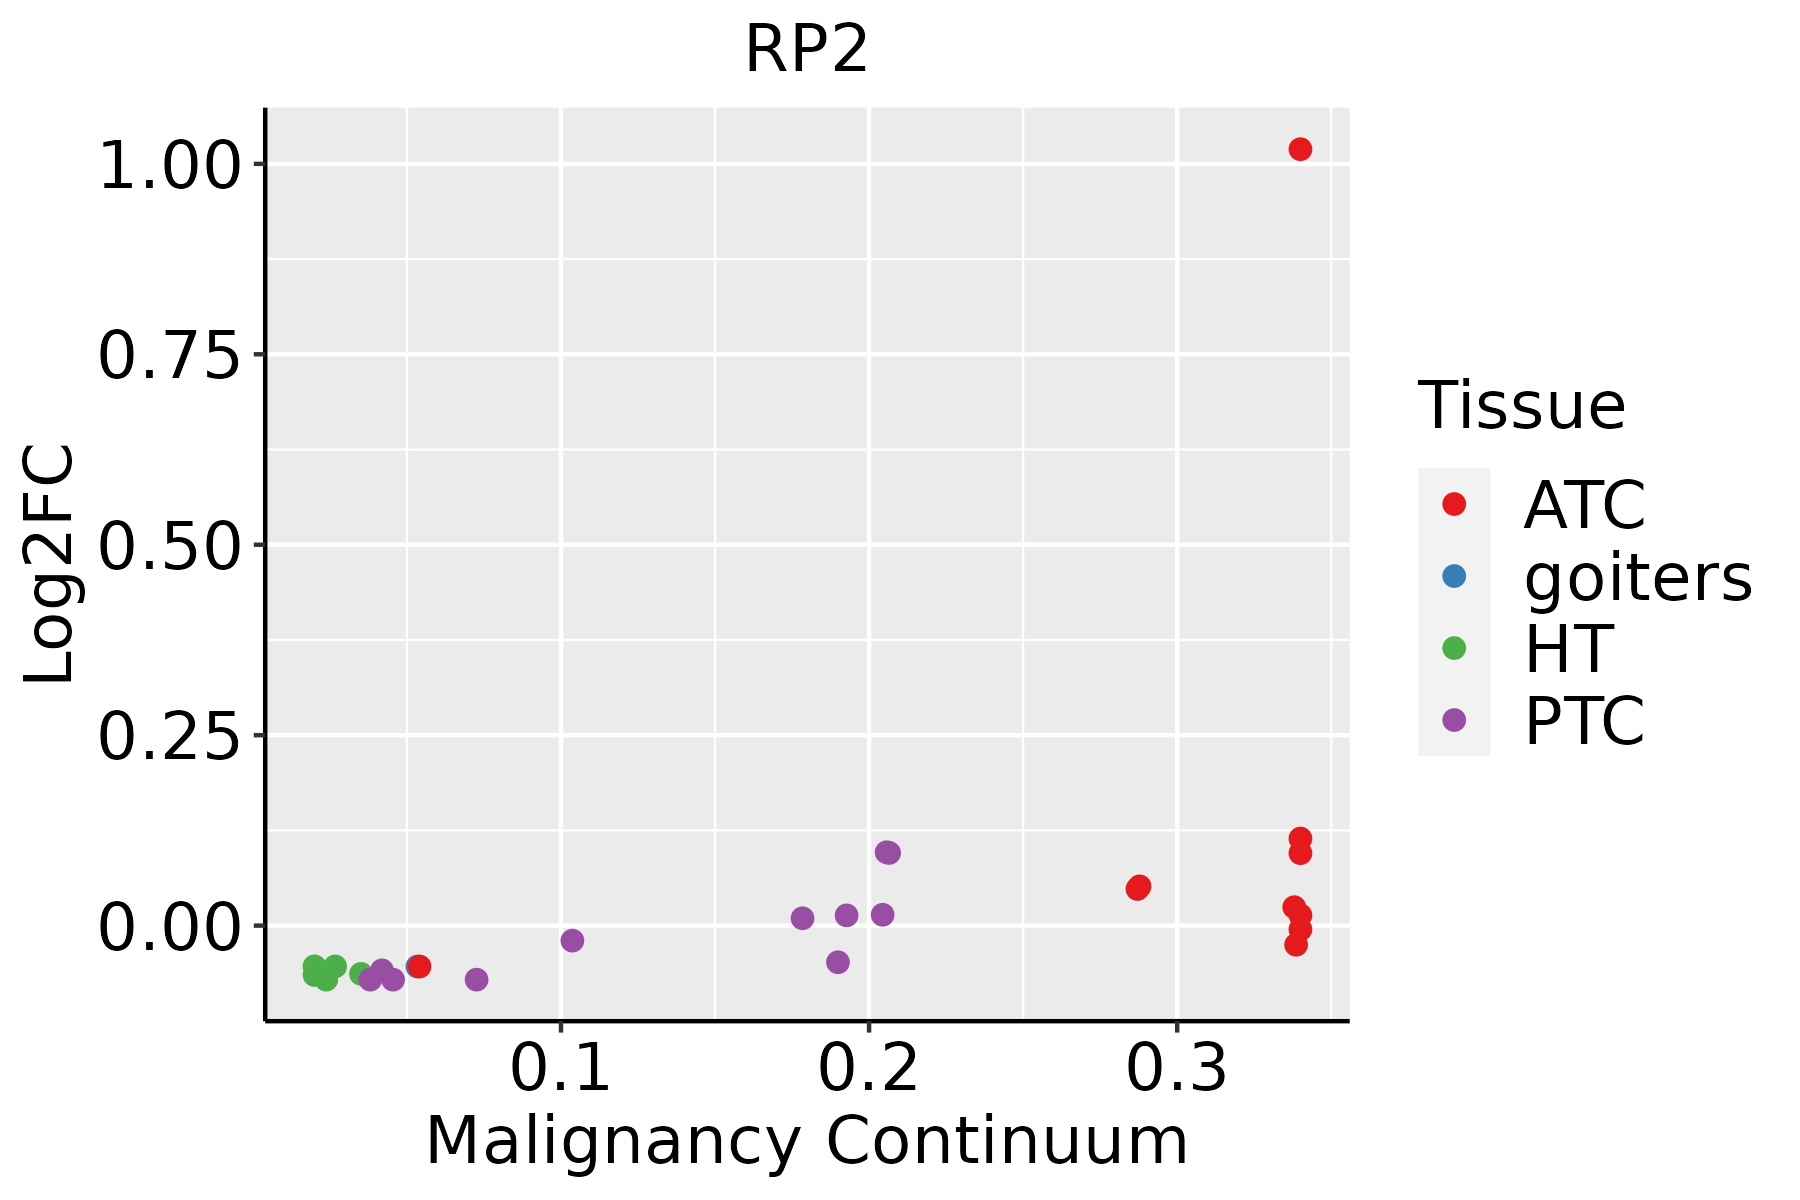 | ATC: Anaplastic thyroid cancer |
| HT: Hashimoto's thyroiditis | ||
| PTC: Papillary thyroid cancer |
| ∗log2FC in expression of this searched gene in stem-like cells from each diseased tissue sample relative to stem-like cells in normal samples in each tissue plotted against the malignancy continuum. Samples are colored based on if they are from different disease stage. |
Top |
Malignant transformation related pathway analysis |
| Find out the enriched GO biological processes and KEGG pathways involved in transition from healthy to precancer to cancer |
| Tissue | Disease Stage | Enriched GO biological Processes |
| Colorectum | AD |  |
| Colorectum | SER |  |
| Colorectum | MSS |  |
| Colorectum | MSI-H |  |
| Colorectum | FAP |  |
| ∗Top 15 enriched GO BP terms are showed in the bar plot of each disease state in each tissue. Each row represents a significant GO biological process which is colored according to the -log10(p.adjust). |
| Page: 1 2 3 4 5 6 7 8 9 |
| GO ID | Tissue | Disease Stage | Description | Gene Ratio | Bg Ratio | pvalue | p.adjust | Count |
| GO:190121516 | Esophagus | ESCC | negative regulation of neuron death | 115/8552 | 208/18723 | 3.24e-03 | 1.34e-02 | 115 |
| GO:00604856 | Esophagus | ESCC | mesenchyme development | 156/8552 | 291/18723 | 3.76e-03 | 1.53e-02 | 156 |
| GO:003559217 | Esophagus | ESCC | establishment of protein localization to extracellular region | 190/8552 | 360/18723 | 3.77e-03 | 1.53e-02 | 190 |
| GO:006053716 | Esophagus | ESCC | muscle tissue development | 211/8552 | 403/18723 | 3.84e-03 | 1.56e-02 | 211 |
| GO:00463294 | Esophagus | ESCC | negative regulation of JNK cascade | 26/8552 | 38/18723 | 3.89e-03 | 1.58e-02 | 26 |
| GO:00456695 | Esophagus | ESCC | positive regulation of osteoblast differentiation | 43/8552 | 69/18723 | 3.93e-03 | 1.59e-02 | 43 |
| GO:003103219 | Esophagus | ESCC | actomyosin structure organization | 108/8552 | 196/18723 | 4.86e-03 | 1.88e-02 | 108 |
| GO:00487052 | Esophagus | ESCC | skeletal system morphogenesis | 120/8552 | 220/18723 | 4.90e-03 | 1.89e-02 | 120 |
| GO:007169210 | Esophagus | ESCC | protein localization to extracellular region | 193/8552 | 368/18723 | 5.01e-03 | 1.92e-02 | 193 |
| GO:00900905 | Esophagus | ESCC | negative regulation of canonical Wnt signaling pathway | 78/8552 | 137/18723 | 5.17e-03 | 1.95e-02 | 78 |
| GO:00455984 | Esophagus | ESCC | regulation of fat cell differentiation | 79/8552 | 139/18723 | 5.23e-03 | 1.97e-02 | 79 |
| GO:0006471 | Esophagus | ESCC | protein ADP-ribosylation | 24/8552 | 35/18723 | 5.25e-03 | 1.97e-02 | 24 |
| GO:001063120 | Esophagus | ESCC | epithelial cell migration | 187/8552 | 357/18723 | 6.05e-03 | 2.23e-02 | 187 |
| GO:00336281 | Esophagus | ESCC | regulation of cell adhesion mediated by integrin | 31/8552 | 48/18723 | 6.41e-03 | 2.35e-02 | 31 |
| GO:001046620 | Esophagus | ESCC | negative regulation of peptidase activity | 140/8552 | 262/18723 | 6.73e-03 | 2.46e-02 | 140 |
| GO:00331355 | Esophagus | ESCC | regulation of peptidyl-serine phosphorylation | 81/8552 | 144/18723 | 6.79e-03 | 2.48e-02 | 81 |
| GO:001095119 | Esophagus | ESCC | negative regulation of endopeptidase activity | 135/8552 | 252/18723 | 6.86e-03 | 2.51e-02 | 135 |
| GO:009013220 | Esophagus | ESCC | epithelium migration | 188/8552 | 360/18723 | 6.96e-03 | 2.54e-02 | 188 |
| GO:0042249 | Esophagus | ESCC | establishment of planar polarity of embryonic epithelium | 12/8552 | 15/18723 | 7.31e-03 | 2.63e-02 | 12 |
| GO:009013020 | Esophagus | ESCC | tissue migration | 190/8552 | 365/18723 | 7.91e-03 | 2.82e-02 | 190 |
| Page: 1 2 3 4 5 6 7 8 9 10 11 12 13 14 15 16 17 18 19 20 21 22 23 24 25 26 27 28 29 30 31 32 33 34 35 36 37 38 39 40 41 42 43 44 45 46 47 48 49 50 51 52 53 54 55 56 57 58 59 60 61 62 63 64 65 66 67 68 69 70 71 72 73 74 75 76 77 78 |
| Pathway ID | Tissue | Disease Stage | Description | Gene Ratio | Bg Ratio | pvalue | p.adjust | qvalue | Count |
| Page: 1 |
Top |
Cell-cell communication analysis |
| Identification of potential cell-cell interactions between two cell types and their ligand-receptor pairs for different disease states |
| Ligand | Receptor | LRpair | Pathway | Tissue | Disease Stage |
| SEMA3D | NRP2_PLXNA2 | SEMA3D_NRP2_PLXNA2 | SEMA3 | Breast | ADJ |
| SEMA3C | NRP1_NRP2 | SEMA3C_NRP1_NRP2 | SEMA3 | Breast | DCIS |
| SEMA3C | NRP2_PLXNA2 | SEMA3C_NRP2_PLXNA2 | SEMA3 | Breast | Healthy |
| SEMA3D | NRP2_PLXNA2 | SEMA3D_NRP2_PLXNA2 | SEMA3 | Breast | Healthy |
| SEMA3C | NRP1_NRP2 | SEMA3C_NRP1_NRP2 | SEMA3 | Breast | Healthy |
| SEMA3C | NRP1_NRP2 | SEMA3C_NRP1_NRP2 | SEMA3 | Cervix | ADJ |
| SEMA3C | NRP2_PLXNA2 | SEMA3C_NRP2_PLXNA2 | SEMA3 | Cervix | CC |
| SEMA3F | NRP2_PLXNA2 | SEMA3F_NRP2_PLXNA2 | SEMA3 | Cervix | CC |
| SEMA3C | NRP1_NRP2 | SEMA3C_NRP1_NRP2 | SEMA3 | Cervix | CC |
| SEMA3C | NRP1_NRP2 | SEMA3C_NRP1_NRP2 | SEMA3 | Cervix | Precancer |
| SEMA3C | NRP2_PLXNA2 | SEMA3C_NRP2_PLXNA2 | SEMA3 | CRC | AD |
| SEMA3F | NRP2_PLXNA2 | SEMA3F_NRP2_PLXNA2 | SEMA3 | CRC | AD |
| SEMA3C | NRP1_NRP2 | SEMA3C_NRP1_NRP2 | SEMA3 | CRC | AD |
| SEMA3B | NRP2_PLXNA2 | SEMA3B_NRP2_PLXNA2 | SEMA3 | CRC | ADJ |
| SEMA3C | NRP2_PLXNA2 | SEMA3C_NRP2_PLXNA2 | SEMA3 | CRC | ADJ |
| SEMA3B | NRP2_PLXNA2 | SEMA3B_NRP2_PLXNA2 | SEMA3 | CRC | FAP |
| SEMA3C | NRP2_PLXNA2 | SEMA3C_NRP2_PLXNA2 | SEMA3 | CRC | FAP |
| SEMA3B | NRP2_PLXNA2 | SEMA3B_NRP2_PLXNA2 | SEMA3 | CRC | MSI-H |
| SEMA3C | NRP2_PLXNA2 | SEMA3C_NRP2_PLXNA2 | SEMA3 | CRC | MSI-H |
| SEMA3F | NRP2_PLXNA2 | SEMA3F_NRP2_PLXNA2 | SEMA3 | CRC | MSI-H |
| Page: 1 |
Top |
Single-cell gene regulatory network inference analysis |
| Find out the significant the regulons (TFs) and the target genes of each regulon across cell types for different disease states |
| TF | Cell Type | Tissue | Disease Stage | Target Gene | RSS | Regulon Activity |
| ∗The dot plots of a searched regulon are shown for all cell subpopulations in each disease state of each tissue based on the regulon specific score inferred using pySCENIC and by calculating the average expression. |
| Page: 1 |
Top |
Somatic mutation of malignant transformation related genes |
| Annotation of somatic variants for genes involved in malignant transformation |
| Hugo Symbol | Variant Class | Variant Classification | dbSNP RS | HGVSc | HGVSp | HGVSp Short | SWISSPROT | BIOTYPE | SIFT | PolyPhen | Tumor Sample Barcode | Tissue | Histology | Sex | Age | Stage | Therapy Types | Drugs | Outcome |
| RP2 | SNV | Missense_Mutation | c.44C>G | p.Ser15Trp | p.S15W | O75695 | protein_coding | deleterious(0.01) | benign(0.176) | TCGA-BH-A208-01 | Breast | breast invasive carcinoma | Female | <65 | I/II | Unknown | Unknown | SD | |
| RP2 | SNV | Missense_Mutation | c.884G>A | p.Gly295Asp | p.G295D | O75695 | protein_coding | deleterious(0) | probably_damaging(0.973) | TCGA-GM-A2DK-01 | Breast | breast invasive carcinoma | Female | <65 | I/II | Hormone Therapy | arimidex | CR | |
| RP2 | SNV | Missense_Mutation | c.874C>A | p.Leu292Met | p.L292M | O75695 | protein_coding | deleterious(0.05) | possibly_damaging(0.468) | TCGA-UC-A7PF-01 | Cervix | cervical & endocervical cancer | Female | <65 | I/II | Unknown | Unknown | SD | |
| RP2 | SNV | Missense_Mutation | novel | c.176N>A | p.Gly59Glu | p.G59E | O75695 | protein_coding | deleterious(0) | probably_damaging(0.998) | TCGA-AA-3984-01 | Colorectum | colon adenocarcinoma | Female | <65 | I/II | Unknown | Unknown | SD |
| RP2 | SNV | Missense_Mutation | c.301N>C | p.Phe101Leu | p.F101L | O75695 | protein_coding | deleterious(0) | possibly_damaging(0.893) | TCGA-AA-A010-01 | Colorectum | colon adenocarcinoma | Female | <65 | I/II | Chemotherapy | folinic | CR | |
| RP2 | SNV | Missense_Mutation | c.628G>A | p.Val210Ile | p.V210I | O75695 | protein_coding | tolerated(0.24) | benign(0) | TCGA-NH-A5IV-01 | Colorectum | colon adenocarcinoma | Female | >=65 | I/II | Unknown | Unknown | SD | |
| RP2 | SNV | Missense_Mutation | c.467N>A | p.Ala156Asp | p.A156D | O75695 | protein_coding | tolerated(0.44) | benign(0.045) | TCGA-AG-4015-01 | Colorectum | rectum adenocarcinoma | Female | >=65 | I/II | Unknown | Unknown | SD | |
| RP2 | SNV | Missense_Mutation | novel | c.521N>C | p.Ile174Thr | p.I174T | O75695 | protein_coding | deleterious(0) | possibly_damaging(0.889) | TCGA-F5-6814-01 | Colorectum | rectum adenocarcinoma | Male | <65 | I/II | Unknown | Unknown | SD |
| RP2 | SNV | Missense_Mutation | novel | c.721T>G | p.Phe241Val | p.F241V | O75695 | protein_coding | deleterious(0) | possibly_damaging(0.854) | TCGA-A5-A0G1-01 | Endometrium | uterine corpus endometrioid carcinoma | Female | >=65 | I/II | Unknown | Unknown | SD |
| RP2 | SNV | Missense_Mutation | novel | c.536N>A | p.Pro179His | p.P179H | O75695 | protein_coding | deleterious(0) | probably_damaging(0.975) | TCGA-AJ-A3BH-01 | Endometrium | uterine corpus endometrioid carcinoma | Female | Unknown | I/II | Unknown | Unknown | SD |
| Page: 1 2 3 4 |
Top |
Related drugs of malignant transformation related genes |
| Identification of chemicals and drugs interact with genes involved in malignant transfromation |
| (DGIdb 4.0) |
| Entrez ID | Symbol | Category | Interaction Types | Drug Claim Name | Drug Name | PMIDs |
| Page: 1 |

Copyright 2023-Present -The University of Texas Health Science Center at Houston |