| Tissue | Expression Dynamics | Abbreviation |
| Colorectum (GSE201348) |  | FAP: Familial adenomatous polyposis |
| CRC: Colorectal cancer |
| Colorectum (HTA11) |  | AD: Adenomas |
| SER: Sessile serrated lesions |
| MSI-H: Microsatellite-high colorectal cancer |
| MSS: Microsatellite stable colorectal cancer |
| Endometrium | 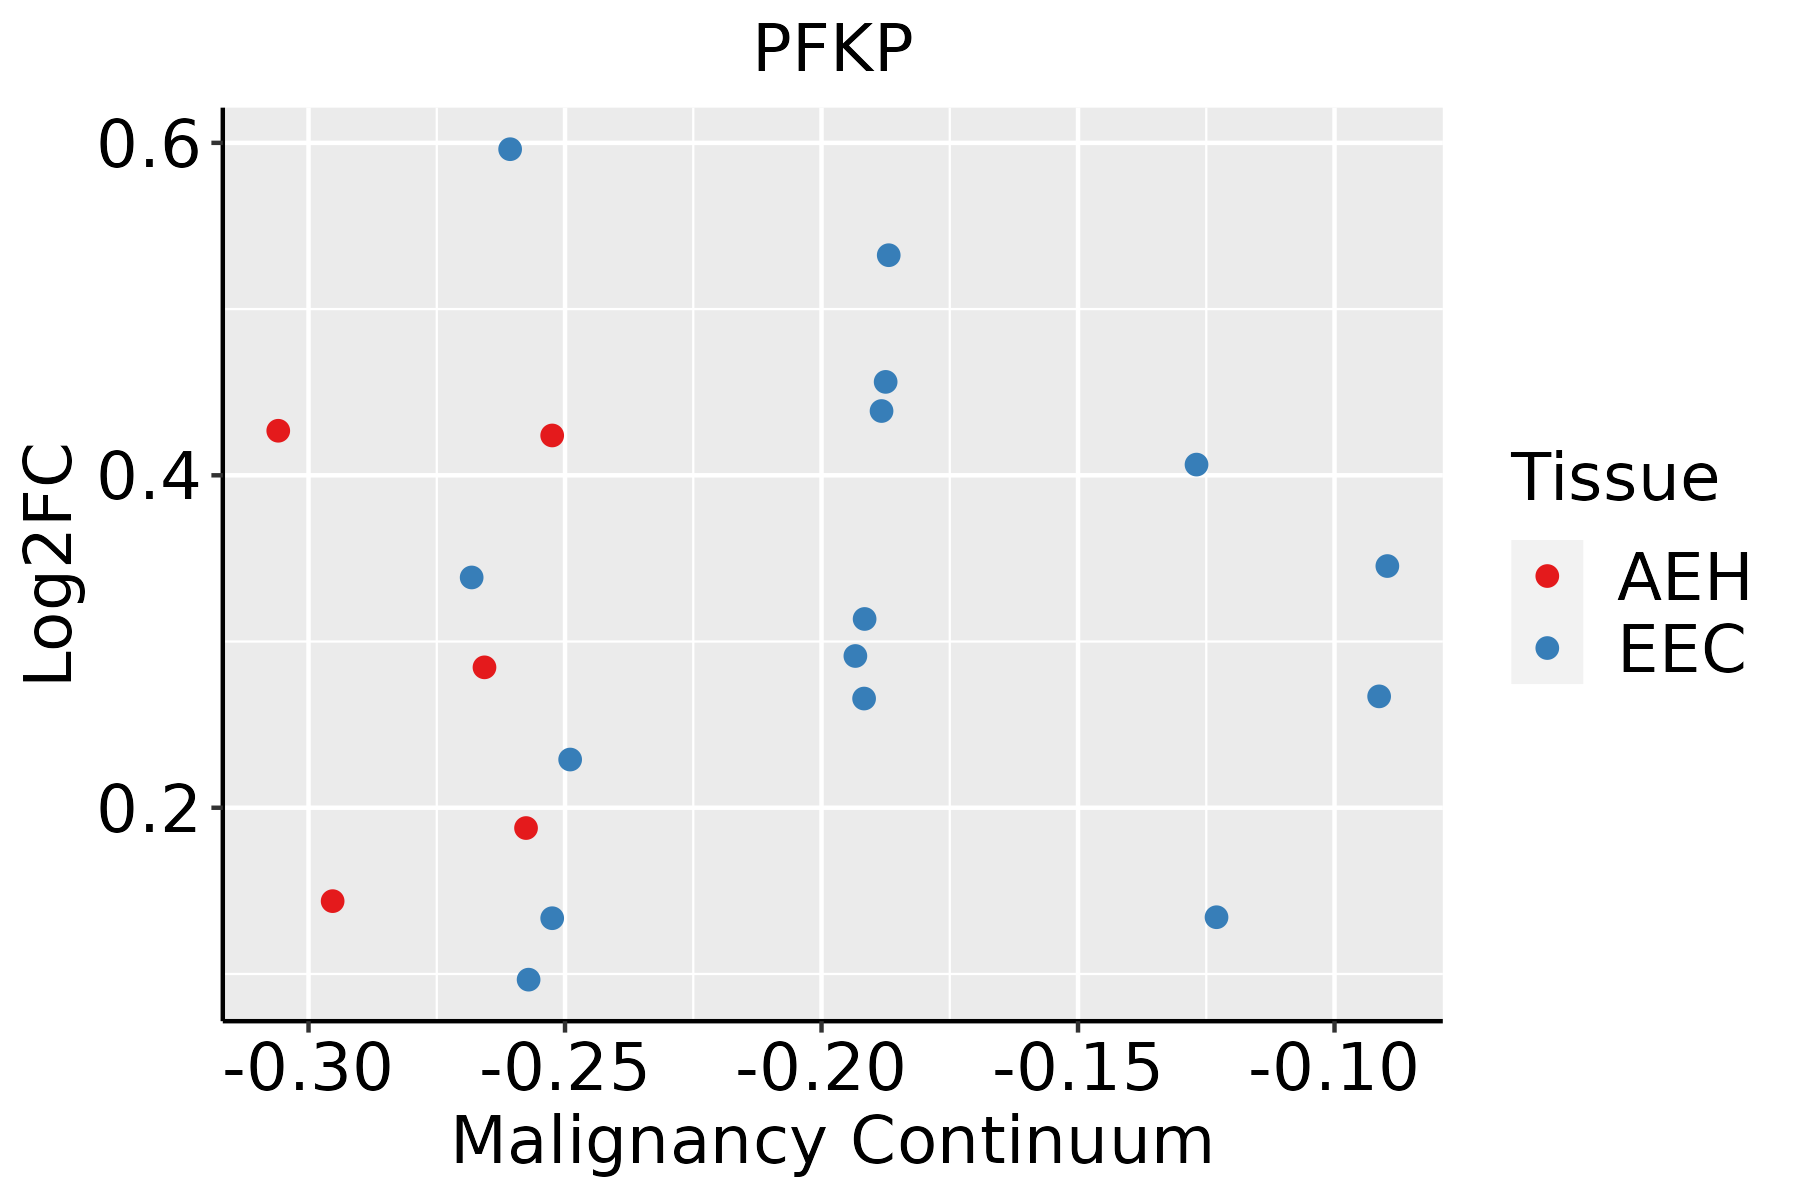 | AEH: Atypical endometrial hyperplasia |
| EEC: Endometrioid Cancer |
| Esophagus | 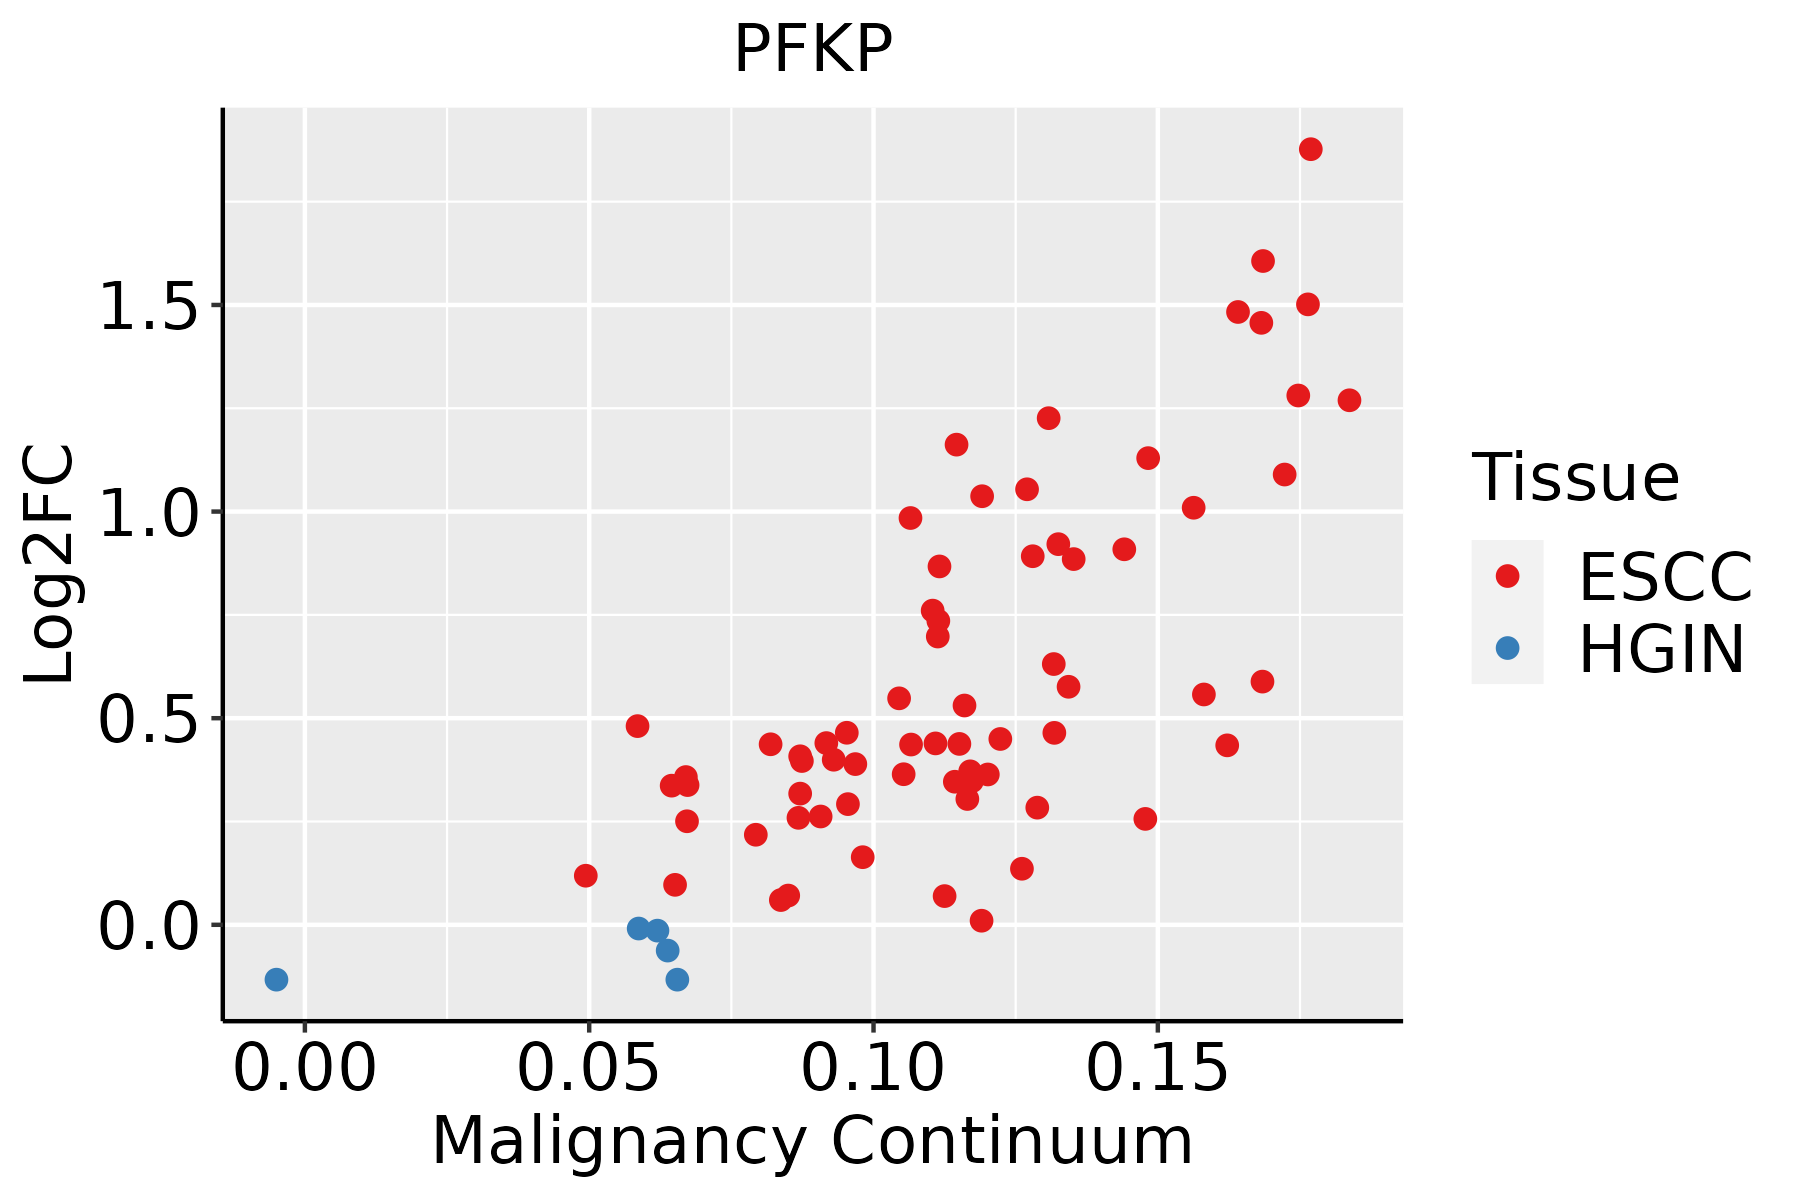 | ESCC: Esophageal squamous cell carcinoma |
| HGIN: High-grade intraepithelial neoplasias |
| LGIN: Low-grade intraepithelial neoplasias |
| Oral Cavity | 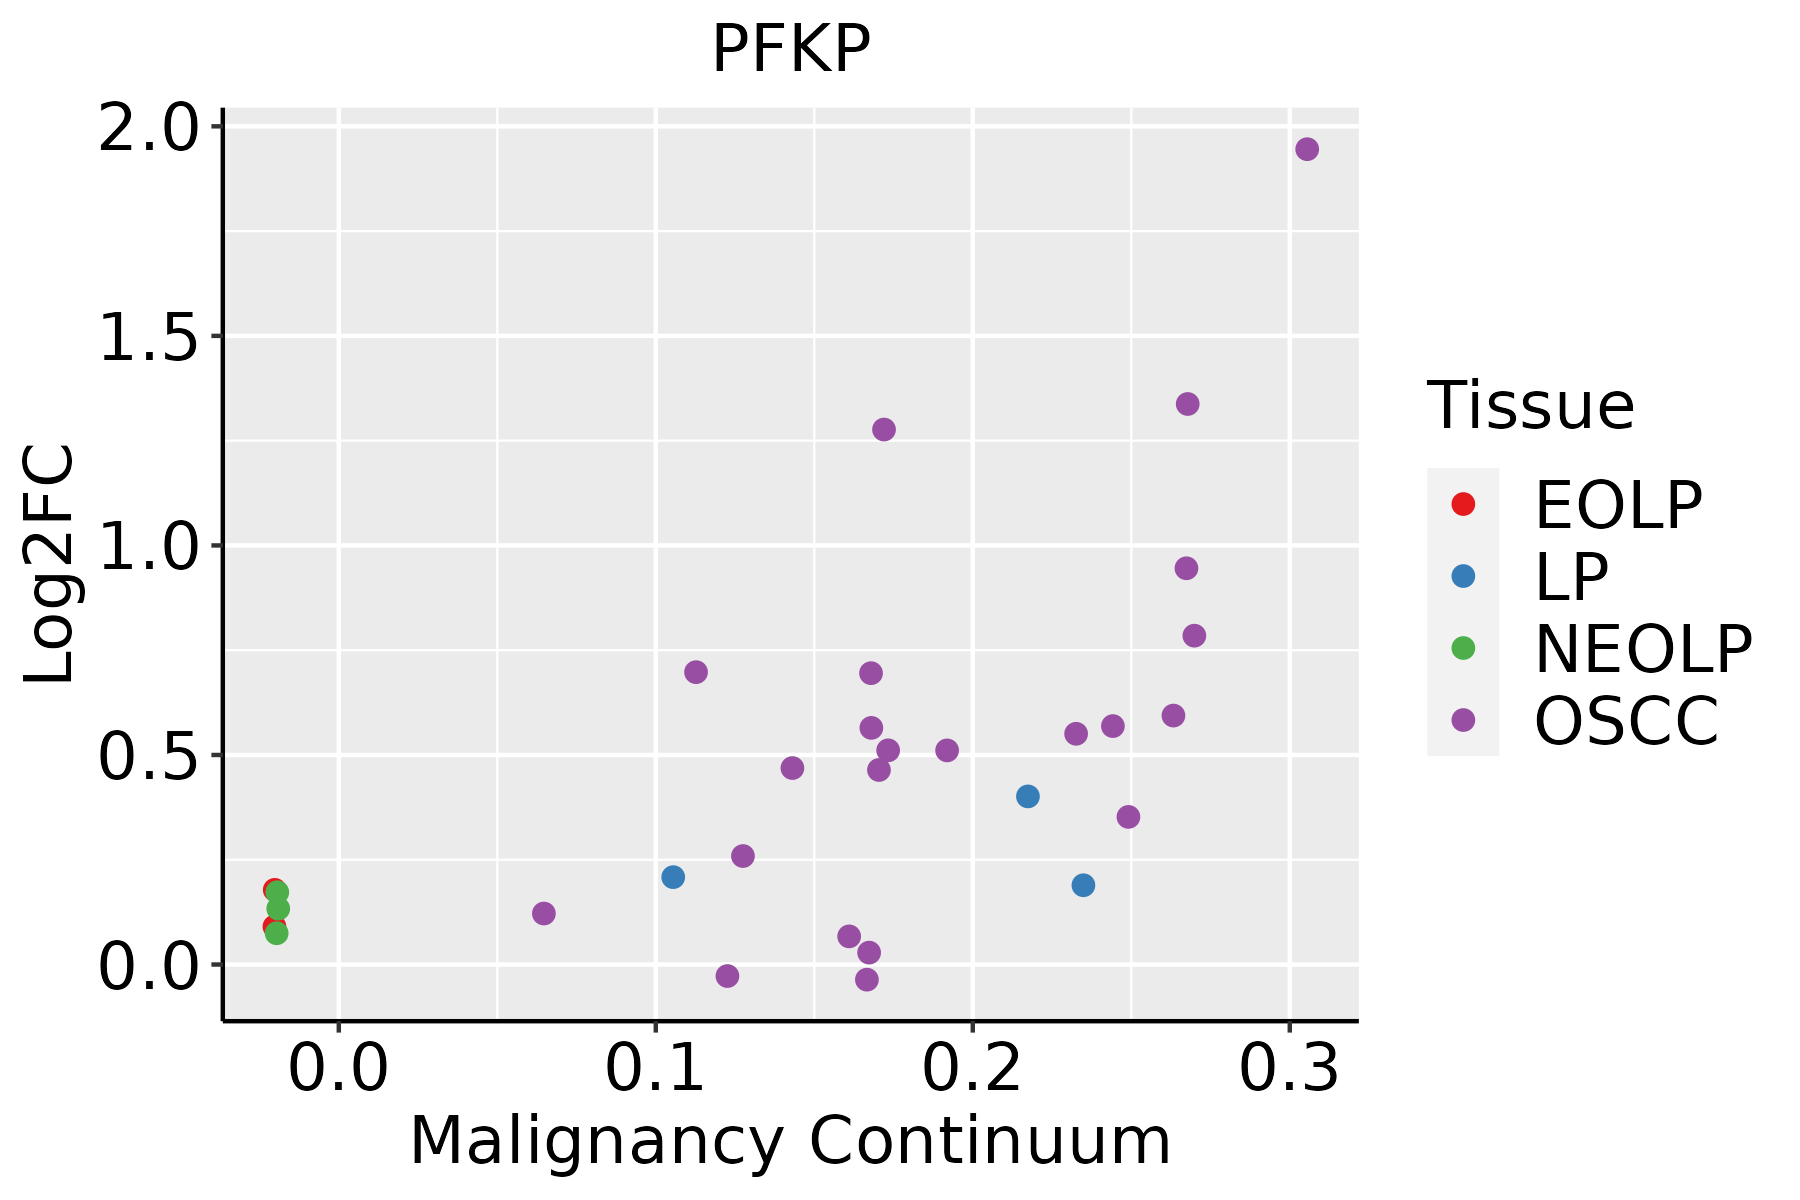 | EOLP: Erosive Oral lichen planus |
| LP: leukoplakia |
| NEOLP: Non-erosive oral lichen planus |
| OSCC: Oral squamous cell carcinoma |
| Prostate | 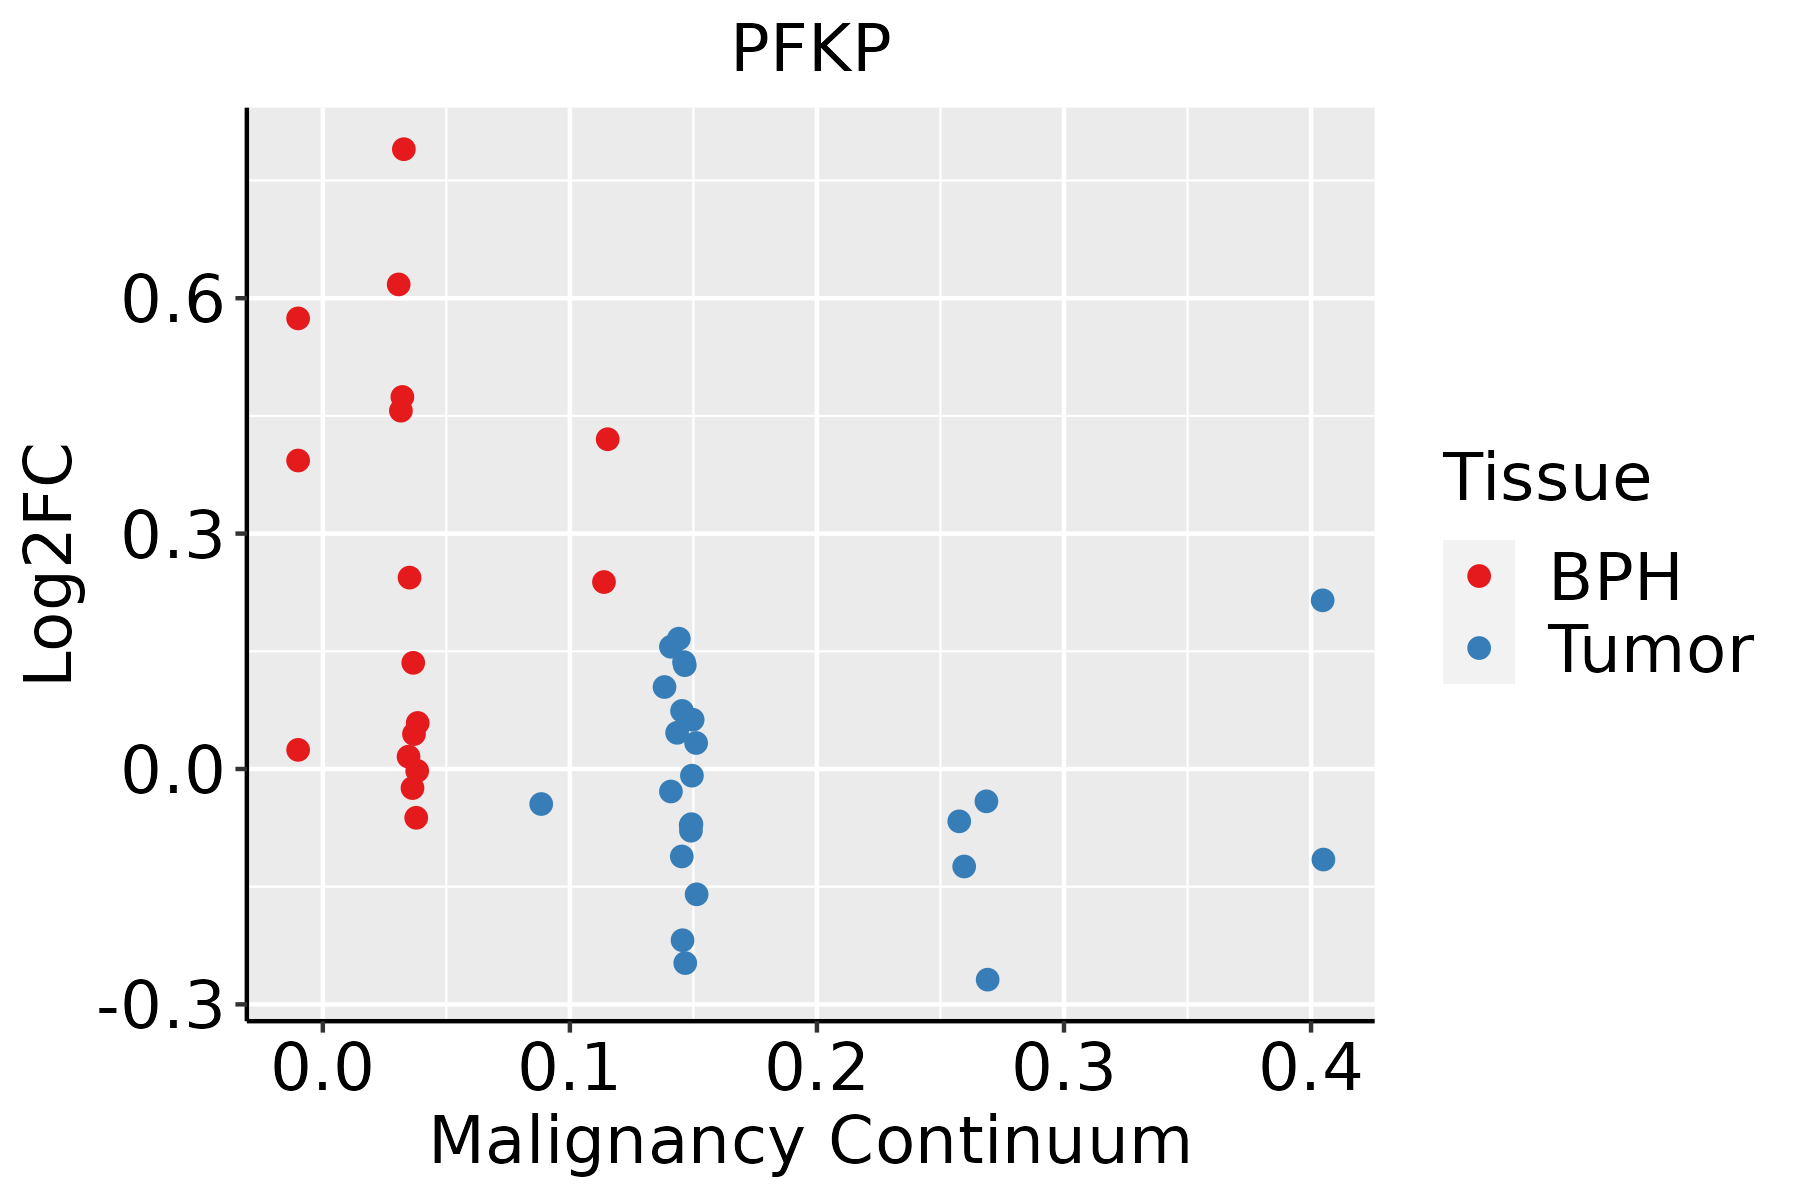 | BPH: Benign Prostatic Hyperplasia |
| Skin | 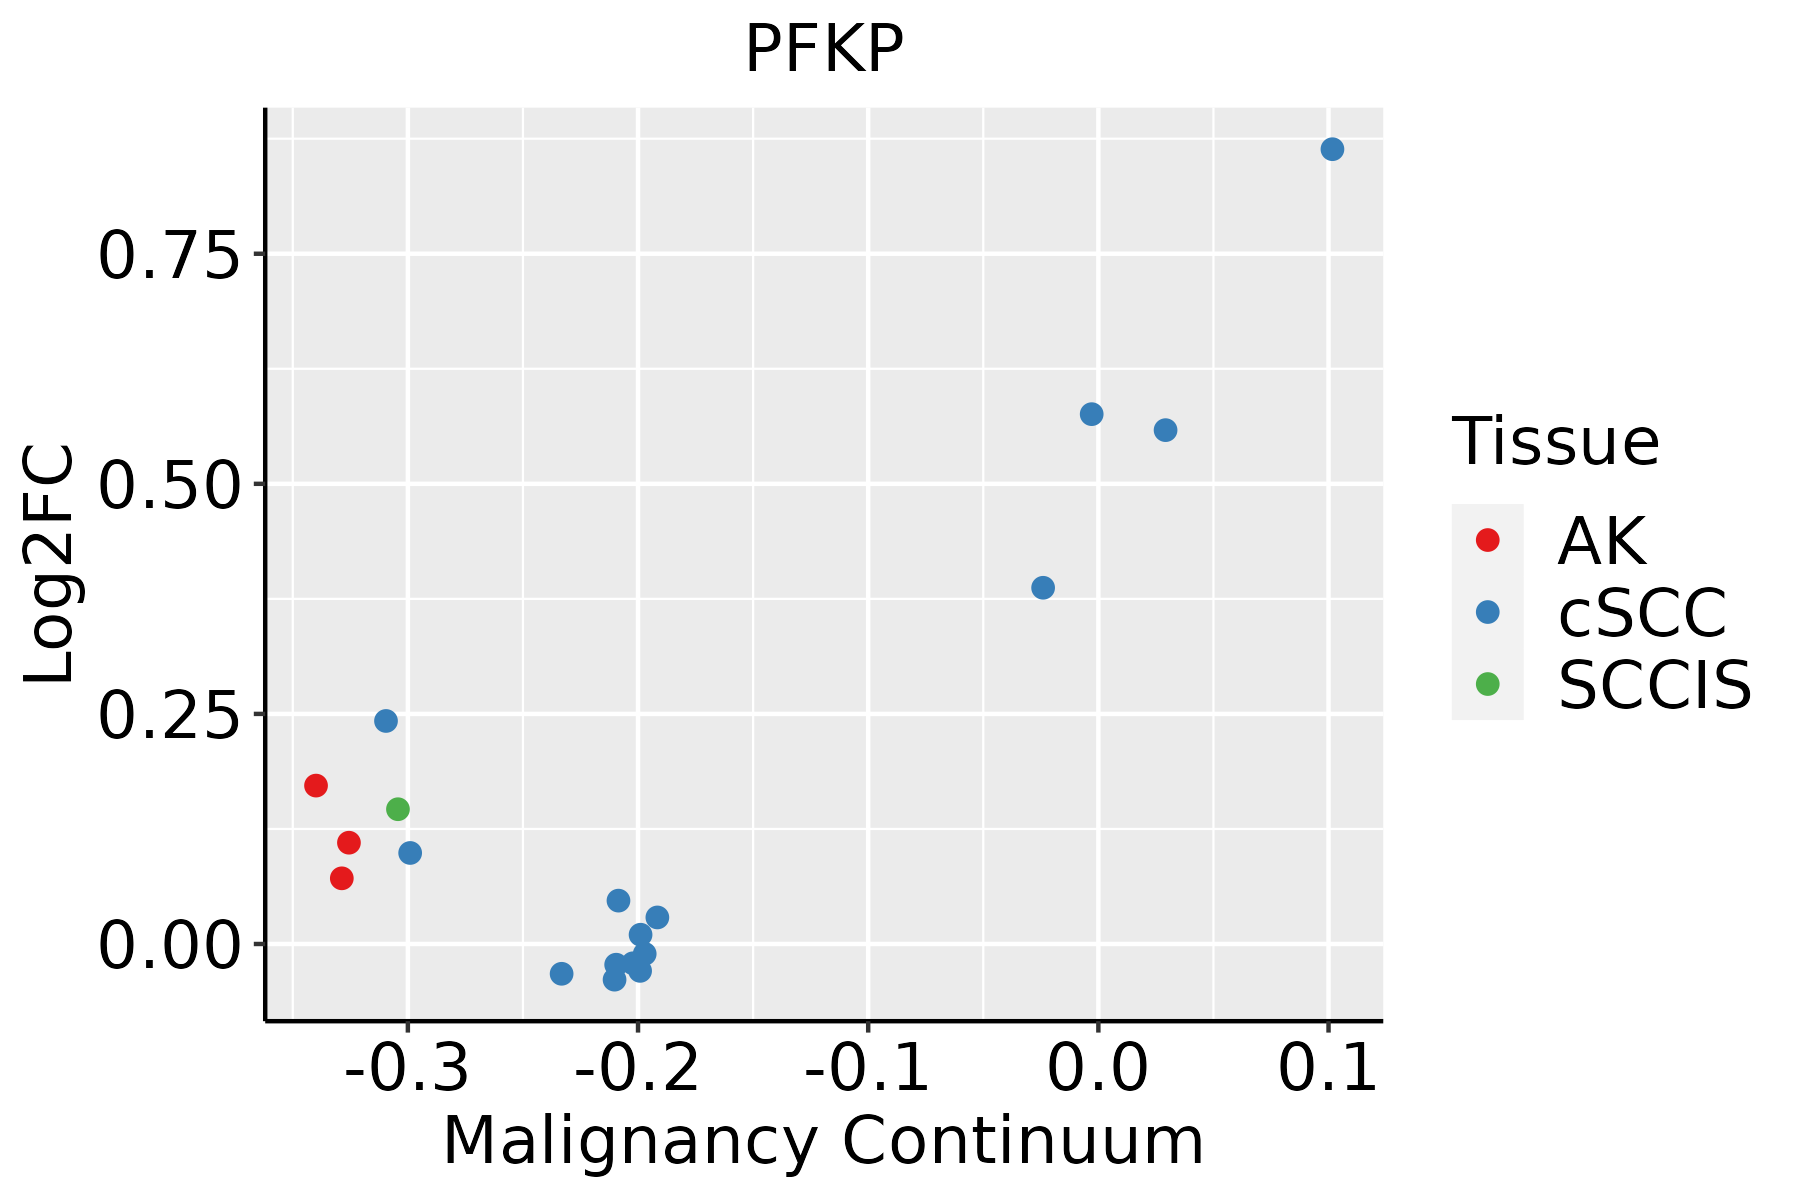 | AK: Actinic keratosis |
| cSCC: Cutaneous squamous cell carcinoma |
| SCCIS:squamous cell carcinoma in situ |
| Thyroid | 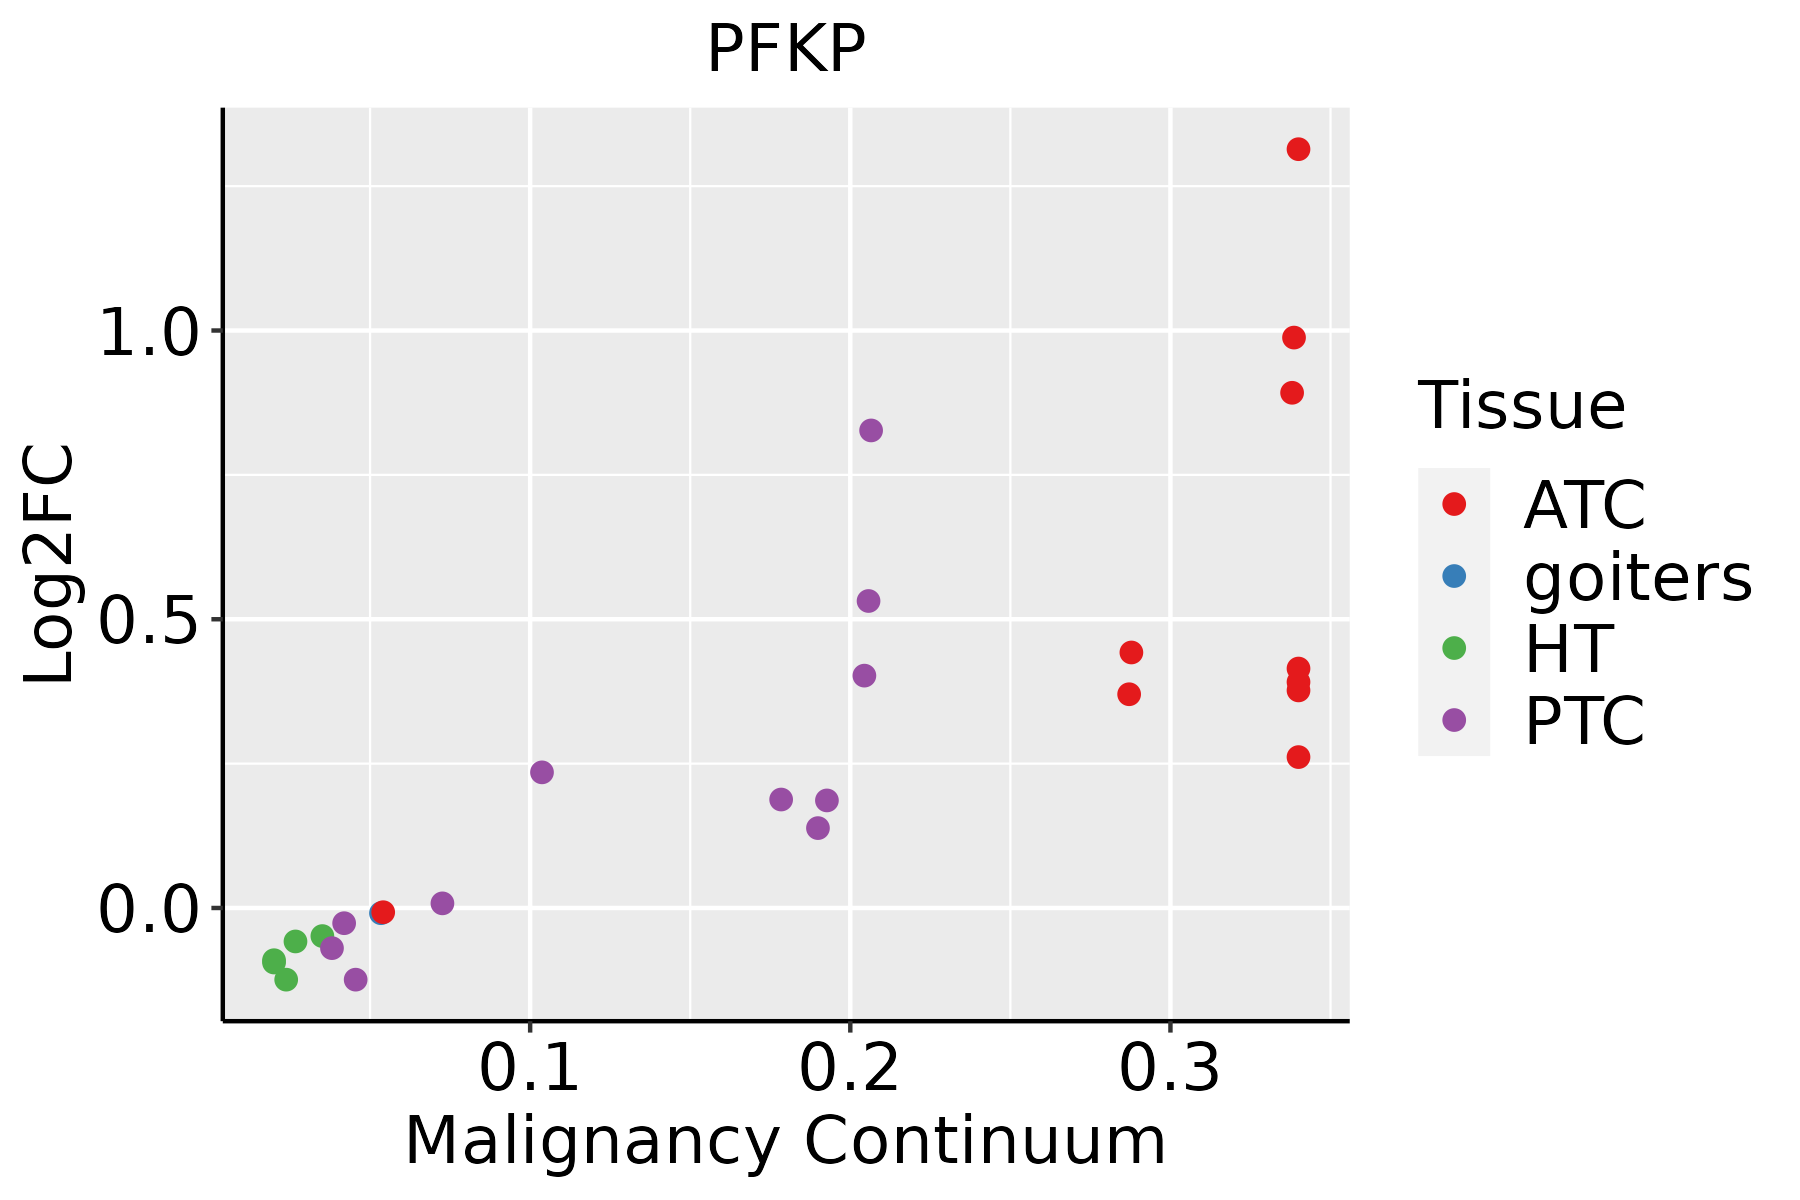 | ATC: Anaplastic thyroid cancer |
| HT: Hashimoto's thyroiditis |
| PTC: Papillary thyroid cancer |
| GO ID | Tissue | Disease Stage | Description | Gene Ratio | Bg Ratio | pvalue | p.adjust | Count |
| GO:000599614 | Thyroid | PTC | monosaccharide metabolic process | 115/5968 | 257/18723 | 9.36e-06 | 1.05e-04 | 115 |
| GO:000600615 | Thyroid | PTC | glucose metabolic process | 90/5968 | 196/18723 | 2.54e-05 | 2.50e-04 | 90 |
| GO:0046939110 | Thyroid | PTC | nucleotide phosphorylation | 52/5968 | 101/18723 | 3.25e-05 | 3.08e-04 | 52 |
| GO:0006165110 | Thyroid | PTC | nucleoside diphosphate phosphorylation | 50/5968 | 99/18723 | 8.68e-05 | 7.22e-04 | 50 |
| GO:0006096110 | Thyroid | PTC | glycolytic process | 42/5968 | 81/18723 | 1.47e-04 | 1.13e-03 | 42 |
| GO:0006757110 | Thyroid | PTC | ATP generation from ADP | 42/5968 | 82/18723 | 2.08e-04 | 1.54e-03 | 42 |
| GO:001605218 | Thyroid | PTC | carbohydrate catabolic process | 70/5968 | 154/18723 | 2.77e-04 | 1.97e-03 | 70 |
| GO:000609020 | Thyroid | PTC | pyruvate metabolic process | 51/5968 | 106/18723 | 3.47e-04 | 2.39e-03 | 51 |
| GO:00616204 | Thyroid | PTC | glycolytic process through glucose-6-phosphate | 9/5968 | 12/18723 | 2.72e-03 | 1.36e-02 | 9 |
| GO:00616152 | Thyroid | PTC | glycolytic process through fructose-6-phosphate | 9/5968 | 13/18723 | 6.33e-03 | 2.79e-02 | 9 |
| GO:199082310 | Thyroid | PTC | response to leukemia inhibitory factor | 42/5968 | 95/18723 | 7.69e-03 | 3.27e-02 | 42 |
| GO:199083010 | Thyroid | PTC | cellular response to leukemia inhibitory factor | 41/5968 | 94/18723 | 1.10e-02 | 4.38e-02 | 41 |
| GO:004603434 | Thyroid | ATC | ATP metabolic process | 167/6293 | 277/18723 | 5.60e-20 | 8.64e-18 | 167 |
| GO:000609134 | Thyroid | ATC | generation of precursor metabolites and energy | 256/6293 | 490/18723 | 6.55e-18 | 7.69e-16 | 256 |
| GO:001969328 | Thyroid | ATC | ribose phosphate metabolic process | 184/6293 | 396/18723 | 5.87e-08 | 1.05e-06 | 184 |
| GO:000915029 | Thyroid | ATC | purine ribonucleotide metabolic process | 172/6293 | 368/18723 | 9.58e-08 | 1.64e-06 | 172 |
| GO:000925928 | Thyroid | ATC | ribonucleotide metabolic process | 178/6293 | 385/18723 | 1.47e-07 | 2.39e-06 | 178 |
| GO:007252128 | Thyroid | ATC | purine-containing compound metabolic process | 189/6293 | 416/18723 | 2.83e-07 | 4.29e-06 | 189 |
| GO:0006753111 | Thyroid | ATC | nucleoside phosphate metabolic process | 219/6293 | 497/18723 | 5.92e-07 | 8.29e-06 | 219 |
| GO:0009117112 | Thyroid | ATC | nucleotide metabolic process | 215/6293 | 489/18723 | 9.09e-07 | 1.20e-05 | 215 |
| Pathway ID | Tissue | Disease Stage | Description | Gene Ratio | Bg Ratio | pvalue | p.adjust | qvalue | Count |
| hsa01200 | Colorectum | AD | Carbon metabolism | 55/2092 | 115/8465 | 5.53e-08 | 8.42e-07 | 5.37e-07 | 55 |
| hsa00010 | Colorectum | AD | Glycolysis / Gluconeogenesis | 34/2092 | 67/8465 | 3.63e-06 | 4.34e-05 | 2.77e-05 | 34 |
| hsa04066 | Colorectum | AD | HIF-1 signaling pathway | 48/2092 | 109/8465 | 7.25e-06 | 7.84e-05 | 5.00e-05 | 48 |
| hsa04919 | Colorectum | AD | Thyroid hormone signaling pathway | 51/2092 | 121/8465 | 1.71e-05 | 1.73e-04 | 1.10e-04 | 51 |
| hsa05230 | Colorectum | AD | Central carbon metabolism in cancer | 33/2092 | 70/8465 | 3.61e-05 | 3.19e-04 | 2.03e-04 | 33 |
| hsa04152 | Colorectum | AD | AMPK signaling pathway | 47/2092 | 121/8465 | 3.74e-04 | 2.82e-03 | 1.80e-03 | 47 |
| hsa04922 | Colorectum | AD | Glucagon signaling pathway | 41/2092 | 107/8465 | 1.18e-03 | 7.75e-03 | 4.94e-03 | 41 |
| hsa00051 | Colorectum | AD | Fructose and mannose metabolism | 17/2092 | 34/8465 | 1.25e-03 | 8.02e-03 | 5.12e-03 | 17 |
| hsa01230 | Colorectum | AD | Biosynthesis of amino acids | 28/2092 | 75/8465 | 9.99e-03 | 3.89e-02 | 2.48e-02 | 28 |
| hsa012001 | Colorectum | AD | Carbon metabolism | 55/2092 | 115/8465 | 5.53e-08 | 8.42e-07 | 5.37e-07 | 55 |
| hsa000101 | Colorectum | AD | Glycolysis / Gluconeogenesis | 34/2092 | 67/8465 | 3.63e-06 | 4.34e-05 | 2.77e-05 | 34 |
| hsa040661 | Colorectum | AD | HIF-1 signaling pathway | 48/2092 | 109/8465 | 7.25e-06 | 7.84e-05 | 5.00e-05 | 48 |
| hsa049191 | Colorectum | AD | Thyroid hormone signaling pathway | 51/2092 | 121/8465 | 1.71e-05 | 1.73e-04 | 1.10e-04 | 51 |
| hsa052301 | Colorectum | AD | Central carbon metabolism in cancer | 33/2092 | 70/8465 | 3.61e-05 | 3.19e-04 | 2.03e-04 | 33 |
| hsa041521 | Colorectum | AD | AMPK signaling pathway | 47/2092 | 121/8465 | 3.74e-04 | 2.82e-03 | 1.80e-03 | 47 |
| hsa049221 | Colorectum | AD | Glucagon signaling pathway | 41/2092 | 107/8465 | 1.18e-03 | 7.75e-03 | 4.94e-03 | 41 |
| hsa000511 | Colorectum | AD | Fructose and mannose metabolism | 17/2092 | 34/8465 | 1.25e-03 | 8.02e-03 | 5.12e-03 | 17 |
| hsa012301 | Colorectum | AD | Biosynthesis of amino acids | 28/2092 | 75/8465 | 9.99e-03 | 3.89e-02 | 2.48e-02 | 28 |
| hsa049222 | Colorectum | SER | Glucagon signaling pathway | 38/1580 | 107/8465 | 2.57e-05 | 3.28e-04 | 2.38e-04 | 38 |
| hsa012002 | Colorectum | SER | Carbon metabolism | 40/1580 | 115/8465 | 2.77e-05 | 3.41e-04 | 2.47e-04 | 40 |
| Hugo Symbol | Variant Class | Variant Classification | dbSNP RS | HGVSc | HGVSp | HGVSp Short | SWISSPROT | BIOTYPE | SIFT | PolyPhen | Tumor Sample Barcode | Tissue | Histology | Sex | Age | Stage | Therapy Types | Drugs | Outcome |
| PFKP | SNV | Missense_Mutation | | c.1994G>T | p.Arg665Met | p.R665M | Q01813 | protein_coding | deleterious(0) | probably_damaging(0.999) | TCGA-AN-A0AK-01 | Breast | breast invasive carcinoma | Female | >=65 | I/II | Unknown | Unknown | SD |
| PFKP | SNV | Missense_Mutation | novel | c.2048G>A | p.Arg683Lys | p.R683K | Q01813 | protein_coding | deleterious(0) | probably_damaging(1) | TCGA-BH-A0B6-01 | Breast | breast invasive carcinoma | Female | <65 | I/II | Unknown | Unknown | SD |
| PFKP | SNV | Missense_Mutation | novel | c.1909A>G | p.Arg637Gly | p.R637G | Q01813 | protein_coding | deleterious(0) | probably_damaging(0.993) | TCGA-BH-A18G-01 | Breast | breast invasive carcinoma | Female | >=65 | I/II | Unknown | Unknown | SD |
| PFKP | SNV | Missense_Mutation | | c.176N>A | p.Phe59Tyr | p.F59Y | Q01813 | protein_coding | tolerated(0.07) | probably_damaging(0.983) | TCGA-D8-A1XQ-01 | Breast | breast invasive carcinoma | Female | >=65 | I/II | Unknown | Unknown | SD |
| PFKP | SNV | Missense_Mutation | rs199868194 | c.2216N>T | p.Thr739Met | p.T739M | Q01813 | protein_coding | deleterious(0.02) | probably_damaging(0.996) | TCGA-E2-A14R-01 | Breast | breast invasive carcinoma | Female | <65 | I/II | Chemotherapy | doxorubicin | PD |
| PFKP | SNV | Missense_Mutation | | c.856N>A | p.Glu286Lys | p.E286K | Q01813 | protein_coding | deleterious(0.03) | benign(0.303) | TCGA-E2-A1IN-01 | Breast | breast invasive carcinoma | Female | <65 | I/II | Hormone Therapy | arimidex | SD |
| PFKP | SNV | Missense_Mutation | novel | c.1858N>C | p.Glu620Gln | p.E620Q | Q01813 | protein_coding | tolerated(0.22) | benign(0.022) | TCGA-E9-A22E-01 | Breast | breast invasive carcinoma | Female | <65 | III/IV | Chemotherapy | cyclophosphane | SD |
| PFKP | deletion | Frame_Shift_Del | novel | c.1598delT | p.Val533AlafsTer24 | p.V533Afs*24 | Q01813 | protein_coding | | | TCGA-EW-A2FV-01 | Breast | breast invasive carcinoma | Female | <65 | III/IV | Chemotherapy | docetaxel | SD |
| PFKP | SNV | Missense_Mutation | novel | c.946G>A | p.Ala316Thr | p.A316T | Q01813 | protein_coding | deleterious(0) | probably_damaging(0.977) | TCGA-2W-A8YY-01 | Cervix | cervical & endocervical cancer | Female | <65 | I/II | Chemotherapy | cisplatin | CR |
| PFKP | SNV | Missense_Mutation | rs753541438 | c.1333G>A | p.Ala445Thr | p.A445T | Q01813 | protein_coding | tolerated(0.08) | probably_damaging(0.941) | TCGA-2W-A8YY-01 | Cervix | cervical & endocervical cancer | Female | <65 | I/II | Chemotherapy | cisplatin | CR |


