
|
|||||
|
 | |
| |
| |
| |
| |
| |
|
Gene: MFHAS1 |
Gene summary for MFHAS1 |
| Gene information | Species | Human | Gene symbol | MFHAS1 | Gene ID | 9258 |
| Gene name | multifunctional ROCO family signaling regulator 1 | |
| Gene Alias | LRRC65 | |
| Cytomap | 8p23.1 | |
| Gene Type | protein-coding | GO ID | GO:0000165 | UniProtAcc | Q9Y4C4 |
Top |
Malignant transformation analysis |
| Identification of the aberrant gene expression in precancerous and cancerous lesions by comparing the gene expression of stem-like cells in diseased tissues with normal stem cells |
| Entrez ID | Symbol | Replicates | Species | Organ | Tissue | Adj P-value | Log2FC | Malignancy |
| 9258 | MFHAS1 | N_HPV_1 | Human | Cervix | N_HPV | 3.50e-02 | -8.89e-02 | 0.0079 |
| 9258 | MFHAS1 | CCI_1 | Human | Cervix | CC | 3.69e-02 | 5.15e-01 | 0.528 |
| 9258 | MFHAS1 | CCI_3 | Human | Cervix | CC | 7.25e-07 | 6.36e-01 | 0.516 |
| 9258 | MFHAS1 | HTA11_3410_2000001011 | Human | Colorectum | AD | 3.78e-14 | -4.92e-01 | 0.0155 |
| 9258 | MFHAS1 | HTA11_2951_2000001011 | Human | Colorectum | AD | 8.86e-03 | -6.80e-01 | 0.0216 |
| 9258 | MFHAS1 | HTA11_3361_2000001011 | Human | Colorectum | AD | 1.72e-04 | -4.00e-01 | -0.1207 |
| 9258 | MFHAS1 | HTA11_99999971662_82457 | Human | Colorectum | MSS | 4.32e-02 | -2.46e-01 | 0.3859 |
| 9258 | MFHAS1 | F007 | Human | Colorectum | FAP | 1.15e-02 | -2.63e-01 | 0.1176 |
| 9258 | MFHAS1 | A002-C-010 | Human | Colorectum | FAP | 4.58e-04 | -2.50e-01 | 0.242 |
| 9258 | MFHAS1 | A001-C-207 | Human | Colorectum | FAP | 1.36e-04 | -2.42e-01 | 0.1278 |
| 9258 | MFHAS1 | A015-C-203 | Human | Colorectum | FAP | 8.86e-37 | -5.12e-01 | -0.1294 |
| 9258 | MFHAS1 | A015-C-204 | Human | Colorectum | FAP | 1.89e-10 | -4.33e-01 | -0.0228 |
| 9258 | MFHAS1 | A014-C-040 | Human | Colorectum | FAP | 9.48e-06 | -3.53e-01 | -0.1184 |
| 9258 | MFHAS1 | A002-C-201 | Human | Colorectum | FAP | 1.08e-16 | -4.05e-01 | 0.0324 |
| 9258 | MFHAS1 | A002-C-203 | Human | Colorectum | FAP | 2.05e-08 | -2.99e-01 | 0.2786 |
| 9258 | MFHAS1 | A001-C-119 | Human | Colorectum | FAP | 6.30e-10 | -4.35e-01 | -0.1557 |
| 9258 | MFHAS1 | A001-C-108 | Human | Colorectum | FAP | 4.67e-23 | -3.98e-01 | -0.0272 |
| 9258 | MFHAS1 | A002-C-205 | Human | Colorectum | FAP | 7.48e-29 | -6.01e-01 | -0.1236 |
| 9258 | MFHAS1 | A001-C-104 | Human | Colorectum | FAP | 4.04e-06 | -2.22e-01 | 0.0184 |
| 9258 | MFHAS1 | A015-C-006 | Human | Colorectum | FAP | 6.51e-16 | -3.10e-01 | -0.0994 |
| Page: 1 2 3 4 5 6 7 8 |
| Tissue | Expression Dynamics | Abbreviation |
| Cervix | 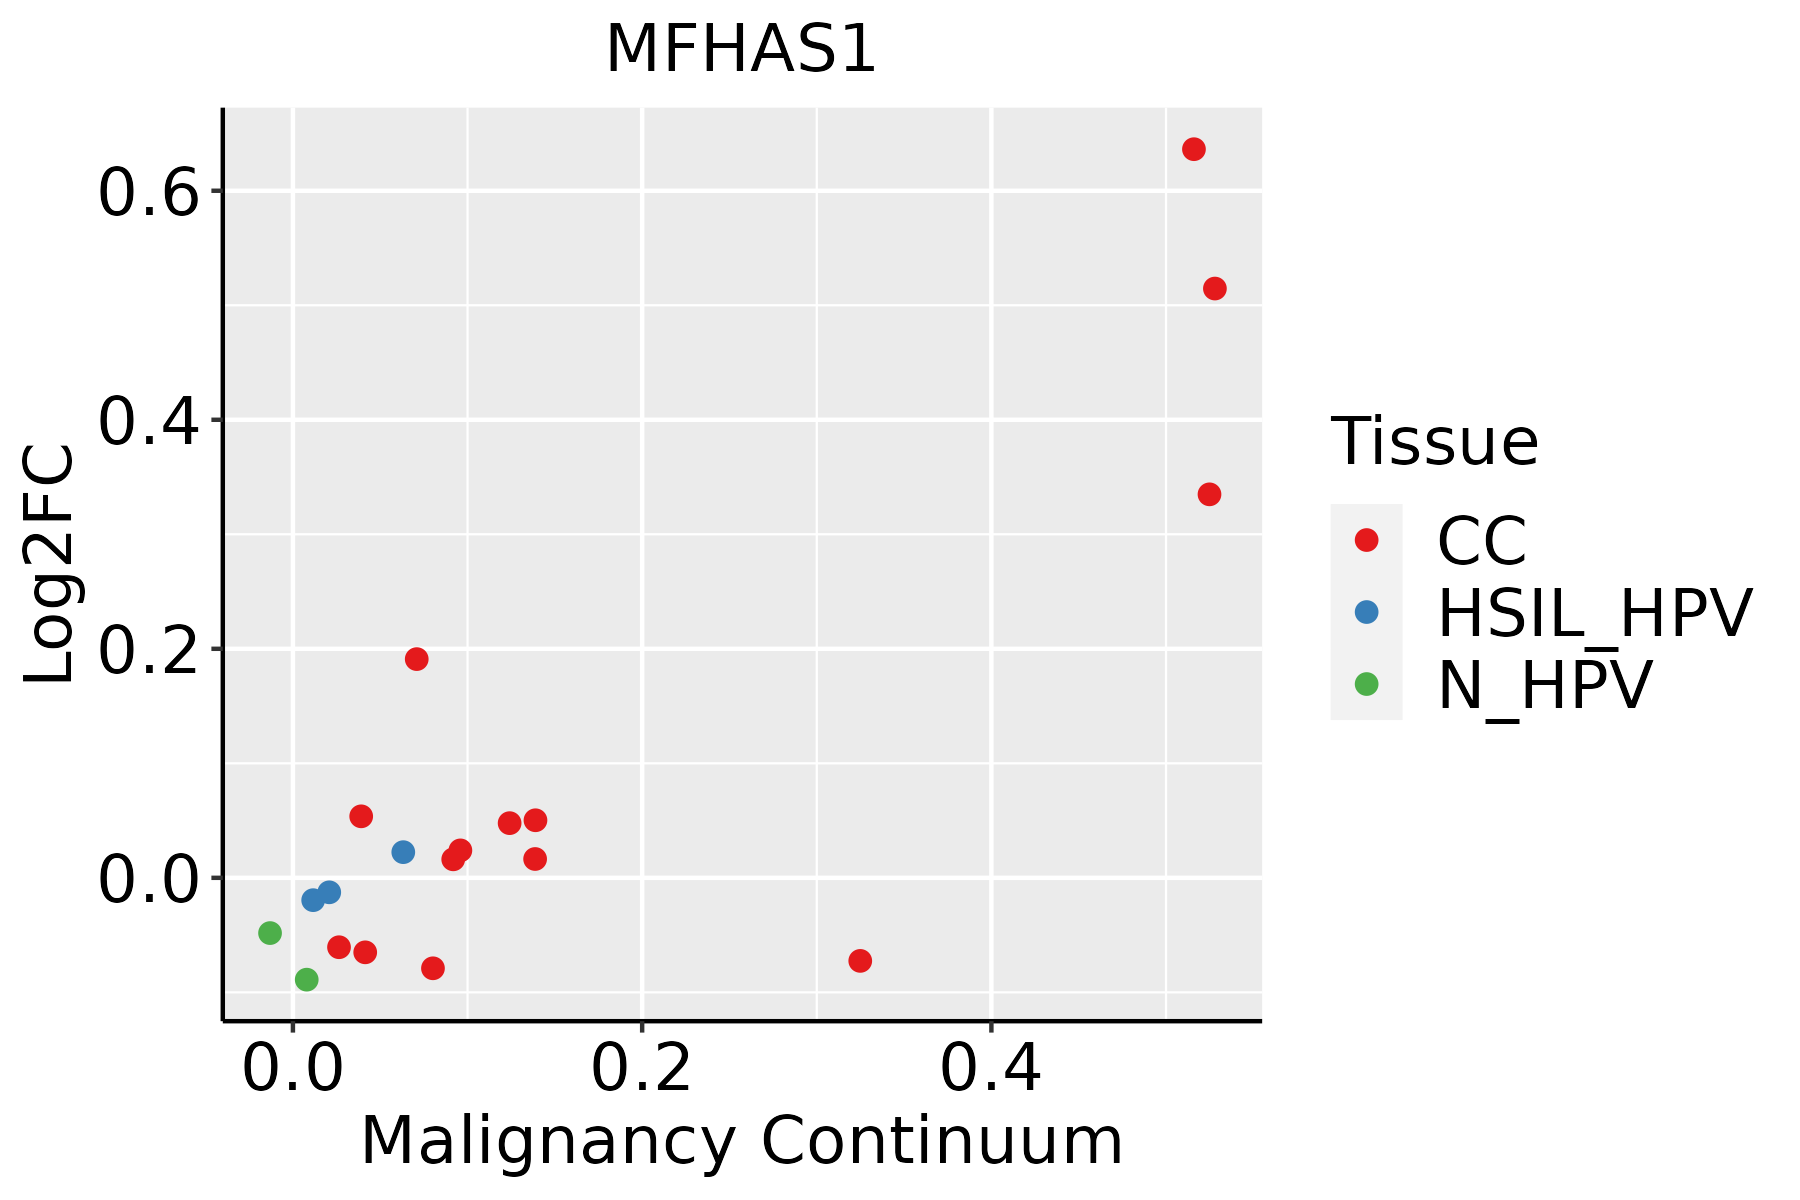 | CC: Cervix cancer |
| HSIL_HPV: HPV-infected high-grade squamous intraepithelial lesions | ||
| N_HPV: HPV-infected normal cervix | ||
| Colorectum (GSE201348) |  | FAP: Familial adenomatous polyposis |
| CRC: Colorectal cancer | ||
| Colorectum (HTA11) |  | AD: Adenomas |
| SER: Sessile serrated lesions | ||
| MSI-H: Microsatellite-high colorectal cancer | ||
| MSS: Microsatellite stable colorectal cancer | ||
| Endometrium |  | AEH: Atypical endometrial hyperplasia |
| EEC: Endometrioid Cancer | ||
| Esophagus | 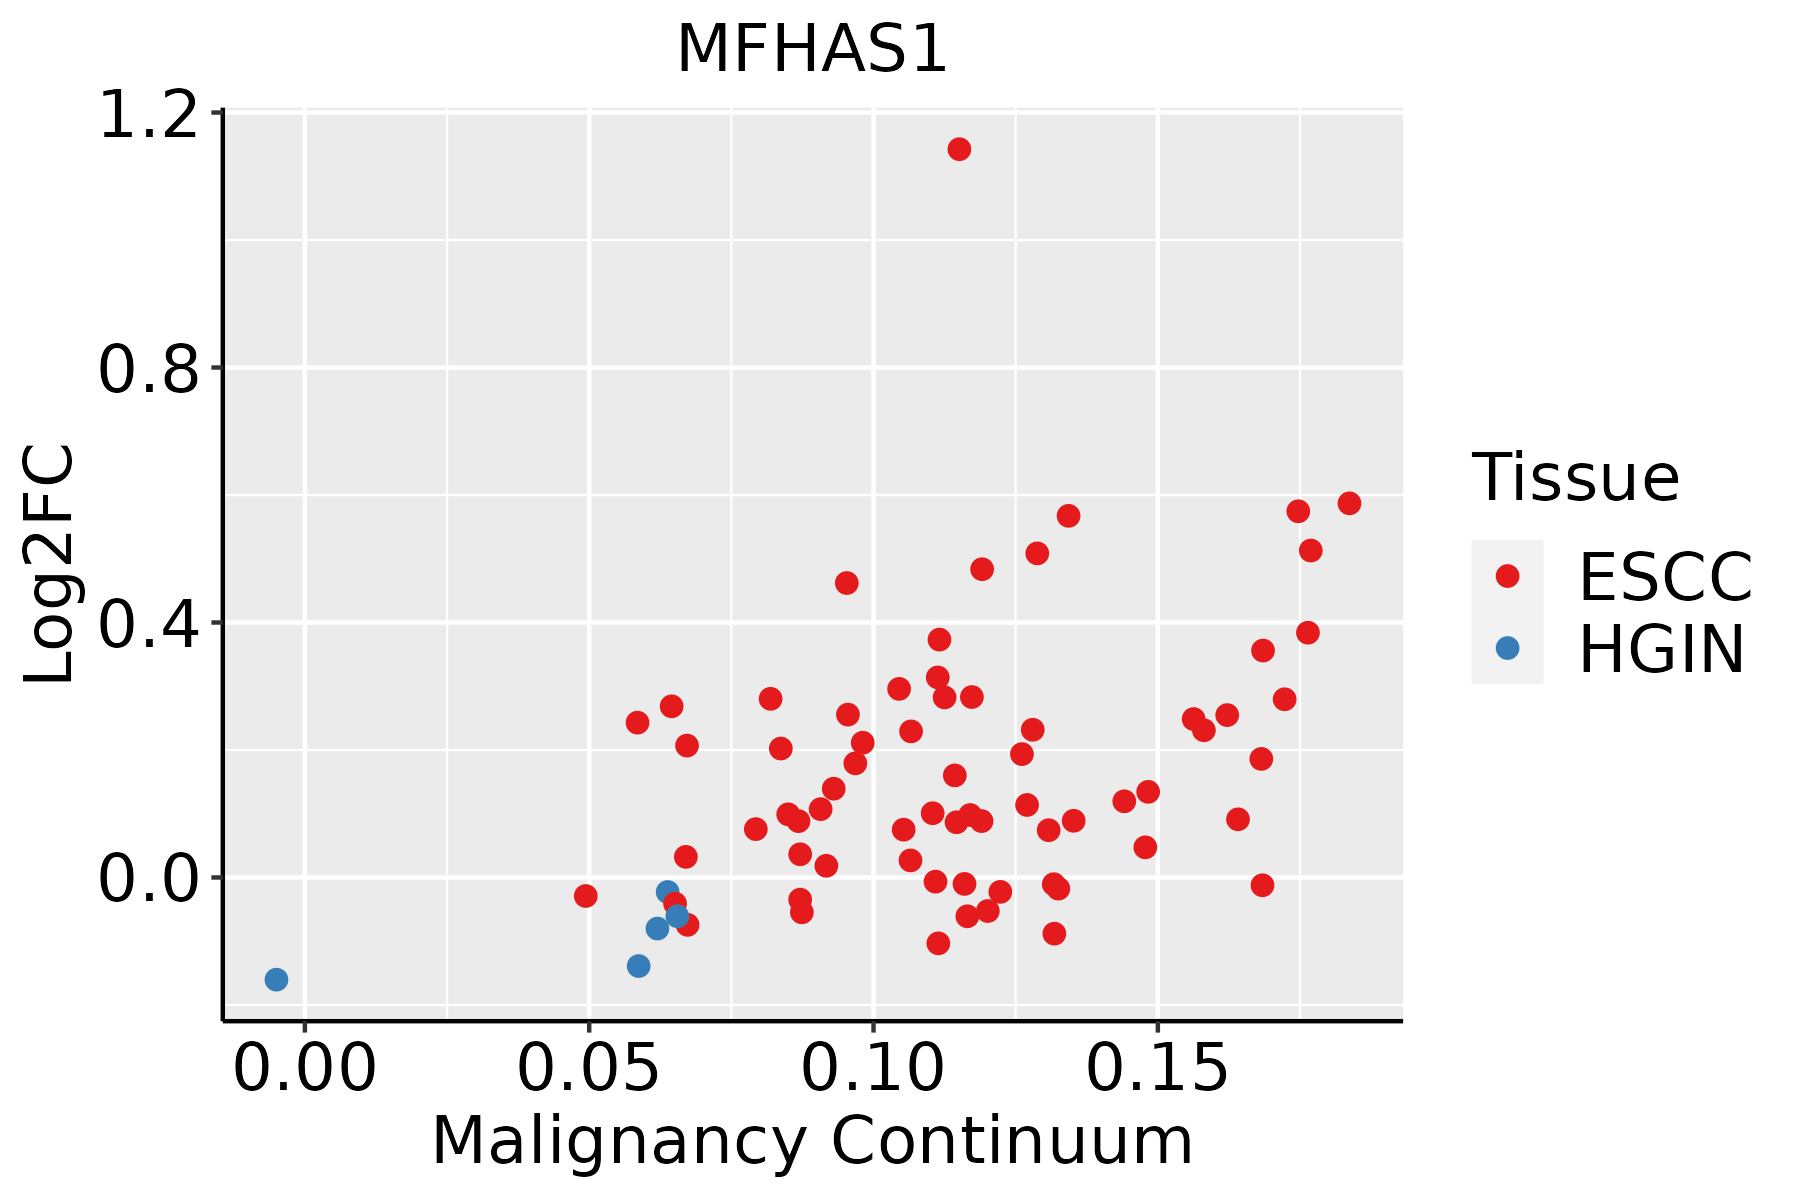 | ESCC: Esophageal squamous cell carcinoma |
| HGIN: High-grade intraepithelial neoplasias | ||
| LGIN: Low-grade intraepithelial neoplasias | ||
| Lung | 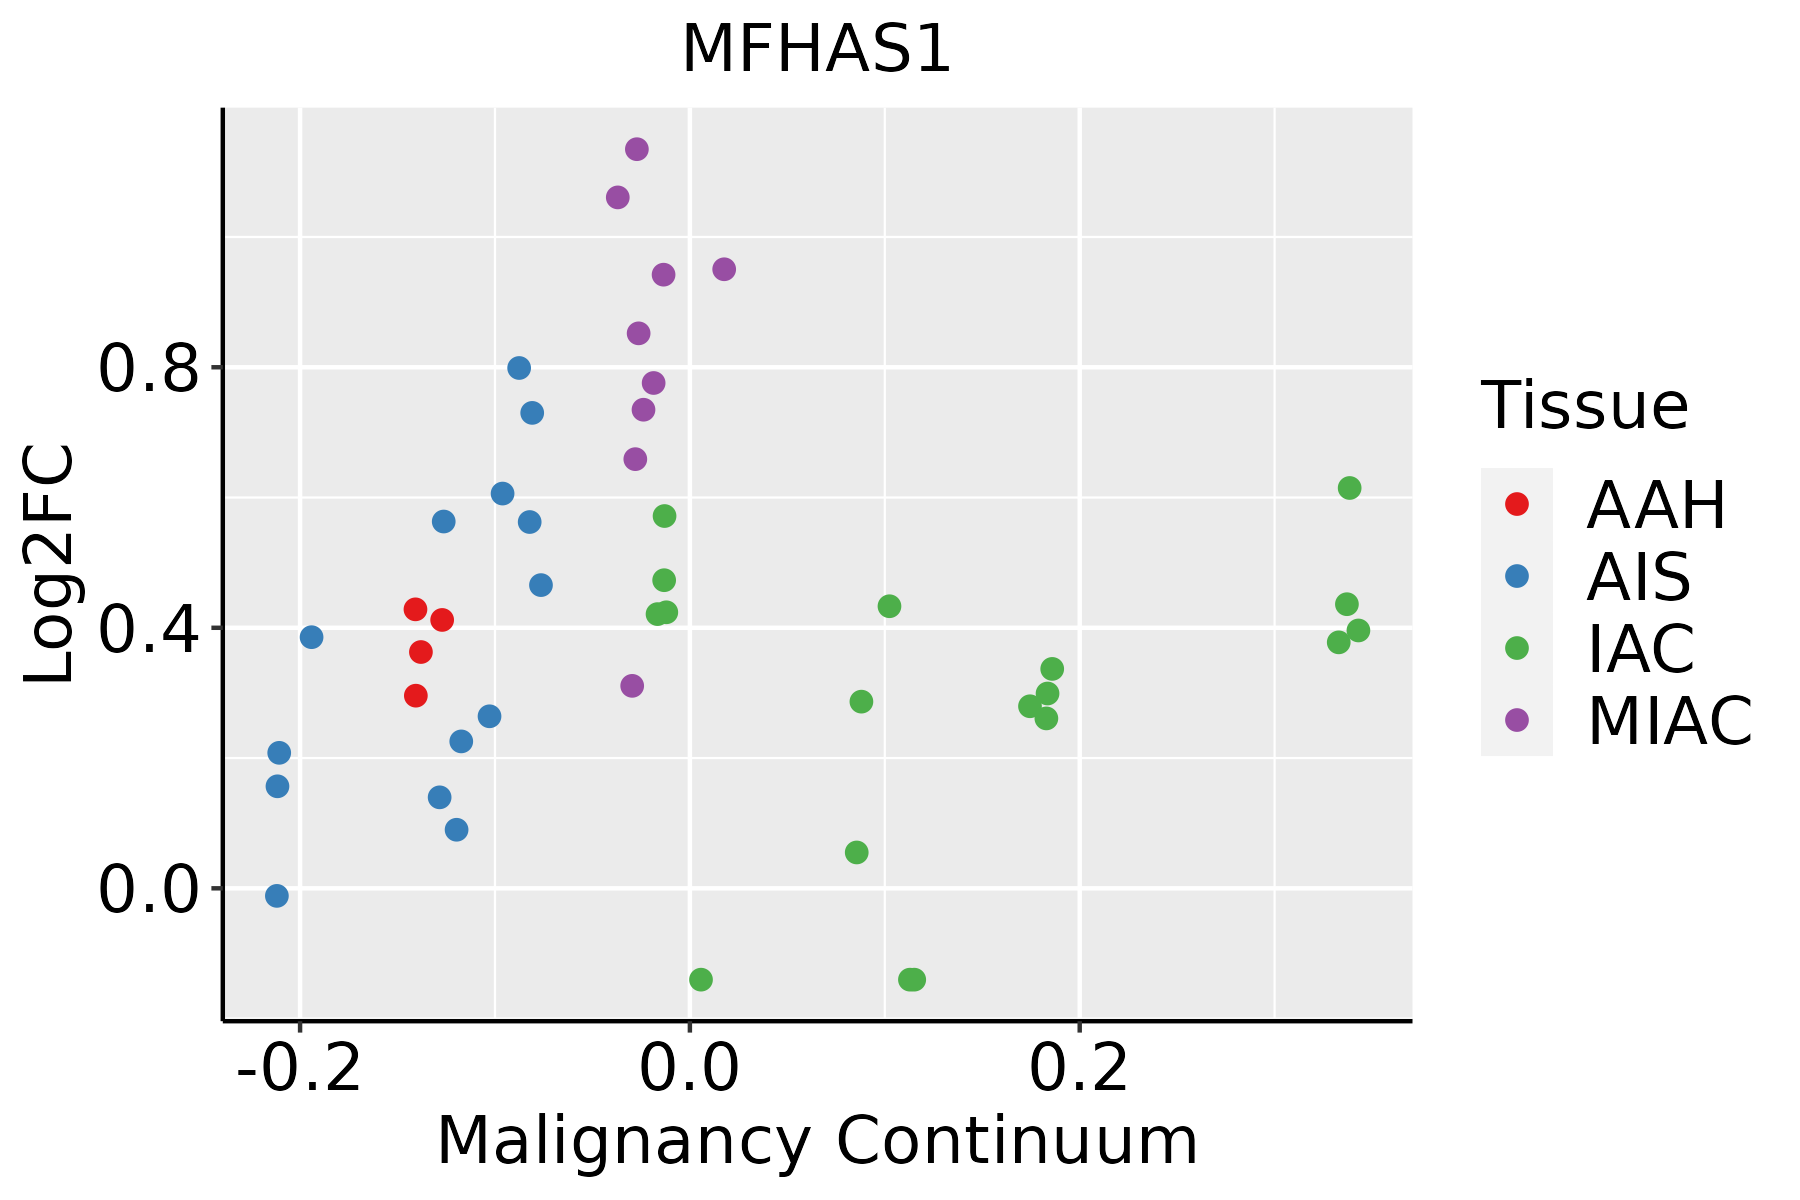 | AAH: Atypical adenomatous hyperplasia |
| AIS: Adenocarcinoma in situ | ||
| IAC: Invasive lung adenocarcinoma | ||
| MIA: Minimally invasive adenocarcinoma | ||
| Oral Cavity |  | EOLP: Erosive Oral lichen planus |
| LP: leukoplakia | ||
| NEOLP: Non-erosive oral lichen planus | ||
| OSCC: Oral squamous cell carcinoma | ||
| Prostate | 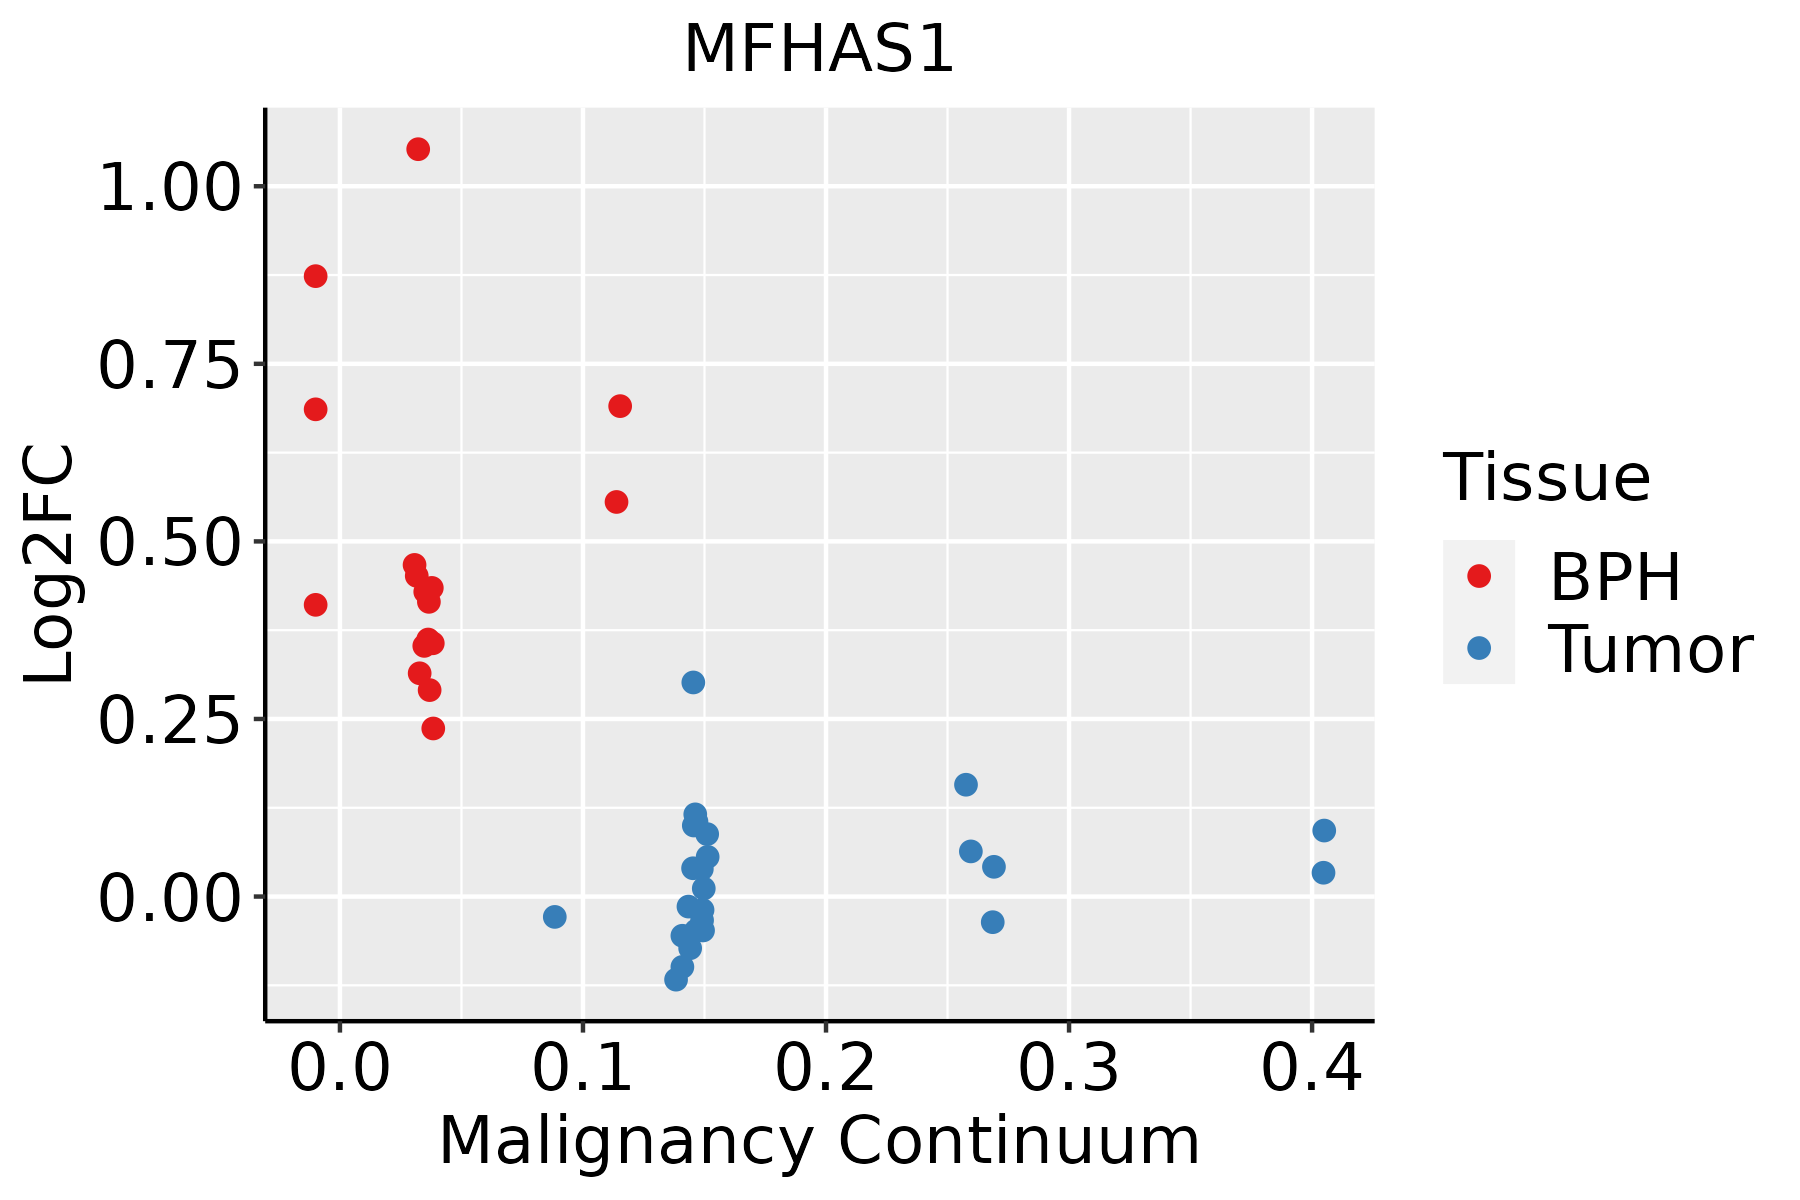 | BPH: Benign Prostatic Hyperplasia |
| Skin |  | AK: Actinic keratosis |
| cSCC: Cutaneous squamous cell carcinoma | ||
| SCCIS:squamous cell carcinoma in situ |
| ∗log2FC in expression of this searched gene in stem-like cells from each diseased tissue sample relative to stem-like cells in normal samples in each tissue plotted against the malignancy continuum. Samples are colored based on if they are from different disease stage. |
Top |
Malignant transformation related pathway analysis |
| Find out the enriched GO biological processes and KEGG pathways involved in transition from healthy to precancer to cancer |
| Tissue | Disease Stage | Enriched GO biological Processes |
| Colorectum | AD |  |
| Colorectum | SER |  |
| Colorectum | MSS |  |
| Colorectum | MSI-H |  |
| Colorectum | FAP |  |
| ∗Top 15 enriched GO BP terms are showed in the bar plot of each disease state in each tissue. Each row represents a significant GO biological process which is colored according to the -log10(p.adjust). |
| Page: 1 2 3 4 5 6 7 8 9 |
| GO ID | Tissue | Disease Stage | Description | Gene Ratio | Bg Ratio | pvalue | p.adjust | Count |
| GO:007030210 | Oral cavity | OSCC | regulation of stress-activated protein kinase signaling cascade | 111/7305 | 195/18723 | 2.82e-07 | 4.34e-06 | 111 |
| GO:003021820 | Oral cavity | OSCC | erythrocyte differentiation | 74/7305 | 120/18723 | 4.09e-07 | 6.06e-06 | 74 |
| GO:003287210 | Oral cavity | OSCC | regulation of stress-activated MAPK cascade | 108/7305 | 192/18723 | 8.97e-07 | 1.22e-05 | 108 |
| GO:00022214 | Oral cavity | OSCC | pattern recognition receptor signaling pathway | 95/7305 | 172/18723 | 1.11e-05 | 1.15e-04 | 95 |
| GO:00072548 | Oral cavity | OSCC | JNK cascade | 90/7305 | 167/18723 | 6.49e-05 | 5.26e-04 | 90 |
| GO:00463288 | Oral cavity | OSCC | regulation of JNK cascade | 74/7305 | 133/18723 | 7.22e-05 | 5.69e-04 | 74 |
| GO:19038288 | Oral cavity | OSCC | negative regulation of cellular protein localization | 65/7305 | 117/18723 | 2.05e-04 | 1.36e-03 | 65 |
| GO:00353055 | Oral cavity | OSCC | negative regulation of dephosphorylation | 28/7305 | 45/18723 | 1.36e-03 | 6.62e-03 | 28 |
| GO:00622076 | Oral cavity | OSCC | regulation of pattern recognition receptor signaling pathway | 56/7305 | 105/18723 | 1.99e-03 | 9.23e-03 | 56 |
| GO:003530810 | Oral cavity | OSCC | negative regulation of protein dephosphorylation | 22/7305 | 34/18723 | 2.14e-03 | 9.81e-03 | 22 |
| GO:00434916 | Oral cavity | OSCC | protein kinase B signaling | 103/7305 | 211/18723 | 2.29e-03 | 1.02e-02 | 103 |
| GO:00022243 | Oral cavity | OSCC | toll-like receptor signaling pathway | 63/7305 | 121/18723 | 2.36e-03 | 1.04e-02 | 63 |
| GO:00703045 | Oral cavity | OSCC | positive regulation of stress-activated protein kinase signaling cascade | 66/7305 | 128/18723 | 2.58e-03 | 1.13e-02 | 66 |
| GO:00027646 | Oral cavity | OSCC | immune response-regulating signaling pathway | 212/7305 | 468/18723 | 2.93e-03 | 1.27e-02 | 212 |
| GO:00328744 | Oral cavity | OSCC | positive regulation of stress-activated MAPK cascade | 64/7305 | 126/18723 | 4.67e-03 | 1.87e-02 | 64 |
| GO:00622087 | Oral cavity | OSCC | positive regulation of pattern recognition receptor signaling pathway | 26/7305 | 44/18723 | 5.49e-03 | 2.13e-02 | 26 |
| GO:00518976 | Oral cavity | OSCC | positive regulation of protein kinase B signaling | 61/7305 | 120/18723 | 5.52e-03 | 2.14e-02 | 61 |
| GO:00341424 | Oral cavity | OSCC | toll-like receptor 4 signaling pathway | 25/7305 | 43/18723 | 8.52e-03 | 3.09e-02 | 25 |
| GO:00434107 | Oral cavity | OSCC | positive regulation of MAPK cascade | 213/7305 | 480/18723 | 8.71e-03 | 3.16e-02 | 213 |
| GO:00703716 | Oral cavity | OSCC | ERK1 and ERK2 cascade | 150/7305 | 330/18723 | 9.47e-03 | 3.38e-02 | 150 |
| Page: 1 2 3 4 5 6 7 8 9 10 11 12 13 14 15 16 17 18 19 20 21 22 23 |
| Pathway ID | Tissue | Disease Stage | Description | Gene Ratio | Bg Ratio | pvalue | p.adjust | qvalue | Count |
| Page: 1 |
Top |
Cell-cell communication analysis |
| Identification of potential cell-cell interactions between two cell types and their ligand-receptor pairs for different disease states |
| Ligand | Receptor | LRpair | Pathway | Tissue | Disease Stage |
| Page: 1 |
Top |
Single-cell gene regulatory network inference analysis |
| Find out the significant the regulons (TFs) and the target genes of each regulon across cell types for different disease states |
| TF | Cell Type | Tissue | Disease Stage | Target Gene | RSS | Regulon Activity |
| ∗The dot plots of a searched regulon are shown for all cell subpopulations in each disease state of each tissue based on the regulon specific score inferred using pySCENIC and by calculating the average expression. |
| Page: 1 |
Top |
Somatic mutation of malignant transformation related genes |
| Annotation of somatic variants for genes involved in malignant transformation |
| Hugo Symbol | Variant Class | Variant Classification | dbSNP RS | HGVSc | HGVSp | HGVSp Short | SWISSPROT | BIOTYPE | SIFT | PolyPhen | Tumor Sample Barcode | Tissue | Histology | Sex | Age | Stage | Therapy Types | Drugs | Outcome |
| MFHAS1 | SNV | Missense_Mutation | rs750288592 | c.2693N>G | p.Tyr898Cys | p.Y898C | Q9Y4C4 | protein_coding | deleterious(0) | possibly_damaging(0.781) | TCGA-AO-A1KT-01 | Breast | breast invasive carcinoma | Female | >=65 | I/II | Chemotherapy | fluorouracil | SD |
| MFHAS1 | SNV | Missense_Mutation | c.1473N>A | p.Phe491Leu | p.F491L | Q9Y4C4 | protein_coding | deleterious(0.01) | probably_damaging(0.985) | TCGA-D8-A1JA-01 | Breast | breast invasive carcinoma | Female | <65 | III/IV | Chemotherapy | adriamycin | PD | |
| MFHAS1 | SNV | Missense_Mutation | c.2573N>A | p.Val858Glu | p.V858E | Q9Y4C4 | protein_coding | tolerated(0.2) | benign(0.005) | TCGA-D8-A1XK-01 | Breast | breast invasive carcinoma | Female | <65 | I/II | Chemotherapy | doxorubicine+cyclophosphamide | SD | |
| MFHAS1 | insertion | In_Frame_Ins | novel | c.1941_1942insACTCAGACTTCCAAAATGGGTTCCAGT | p.Glu647_His648insThrGlnThrSerLysMetGlySerSer | p.E647_H648insTQTSKMGSS | Q9Y4C4 | protein_coding | TCGA-A2-A0T2-01 | Breast | breast invasive carcinoma | Female | >=65 | III/IV | Chemotherapy | xeloda | PD | ||
| MFHAS1 | SNV | Missense_Mutation | c.1453N>A | p.Glu485Lys | p.E485K | Q9Y4C4 | protein_coding | tolerated(0.08) | benign(0.013) | TCGA-DS-A1OD-01 | Cervix | cervical & endocervical cancer | Female | <65 | I/II | Chemotherapy | cisplatin | SD | |
| MFHAS1 | SNV | Missense_Mutation | rs780991918 | c.2756N>G | p.Tyr919Cys | p.Y919C | Q9Y4C4 | protein_coding | tolerated(0.08) | benign(0.012) | TCGA-AA-3679-01 | Colorectum | colon adenocarcinoma | Male | <65 | III/IV | Chemotherapy | folinic | SD |
| MFHAS1 | SNV | Missense_Mutation | c.1898G>A | p.Arg633His | p.R633H | Q9Y4C4 | protein_coding | tolerated(0.55) | benign(0.001) | TCGA-AA-3845-01 | Colorectum | colon adenocarcinoma | Female | >=65 | I/II | Unknown | Unknown | PD | |
| MFHAS1 | SNV | Missense_Mutation | c.2740T>C | p.Phe914Leu | p.F914L | Q9Y4C4 | protein_coding | tolerated(0.64) | benign(0) | TCGA-AA-3864-01 | Colorectum | colon adenocarcinoma | Male | >=65 | I/II | Unknown | Unknown | SD | |
| MFHAS1 | SNV | Missense_Mutation | c.1589C>T | p.Ala530Val | p.A530V | Q9Y4C4 | protein_coding | deleterious(0) | probably_damaging(0.996) | TCGA-AA-3864-01 | Colorectum | colon adenocarcinoma | Male | >=65 | I/II | Unknown | Unknown | SD | |
| MFHAS1 | SNV | Missense_Mutation | c.1910G>A | p.Arg637His | p.R637H | Q9Y4C4 | protein_coding | tolerated(0.14) | benign(0.011) | TCGA-AA-A010-01 | Colorectum | colon adenocarcinoma | Female | <65 | I/II | Chemotherapy | folinic | CR |
| Page: 1 2 3 4 5 6 |
Top |
Related drugs of malignant transformation related genes |
| Identification of chemicals and drugs interact with genes involved in malignant transfromation |
| (DGIdb 4.0) |
| Entrez ID | Symbol | Category | Interaction Types | Drug Claim Name | Drug Name | PMIDs |
| Page: 1 |

Copyright 2023-Present -The University of Texas Health Science Center at Houston |