
|
|||||
|
 | |
| |
| |
| |
| |
| |
|
Gene: MCL1 |
Gene summary for MCL1 |
| Gene information | Species | Human | Gene symbol | MCL1 | Gene ID | 4170 |
| Gene name | MCL1 apoptosis regulator, BCL2 family member | |
| Gene Alias | BCL2L3 | |
| Cytomap | 1q21.2 | |
| Gene Type | protein-coding | GO ID | GO:0001709 | UniProtAcc | A0A087WT64 |
Top |
Malignant transformation analysis |
| Identification of the aberrant gene expression in precancerous and cancerous lesions by comparing the gene expression of stem-like cells in diseased tissues with normal stem cells |
| Entrez ID | Symbol | Replicates | Species | Organ | Tissue | Adj P-value | Log2FC | Malignancy |
| 4170 | MCL1 | GSM4909286 | Human | Breast | IDC | 6.39e-05 | -2.39e-01 | 0.1081 |
| 4170 | MCL1 | GSM4909293 | Human | Breast | IDC | 5.77e-09 | 3.84e-01 | 0.1581 |
| 4170 | MCL1 | GSM4909294 | Human | Breast | IDC | 2.74e-05 | -4.17e-01 | 0.2022 |
| 4170 | MCL1 | GSM4909296 | Human | Breast | IDC | 8.41e-08 | -2.10e-01 | 0.1524 |
| 4170 | MCL1 | GSM4909297 | Human | Breast | IDC | 6.26e-09 | -1.87e-01 | 0.1517 |
| 4170 | MCL1 | GSM4909299 | Human | Breast | IDC | 2.79e-07 | 4.20e-01 | 0.035 |
| 4170 | MCL1 | GSM4909301 | Human | Breast | IDC | 8.48e-88 | 1.06e+00 | 0.1577 |
| 4170 | MCL1 | GSM4909308 | Human | Breast | IDC | 9.89e-03 | 2.93e-01 | 0.158 |
| 4170 | MCL1 | GSM4909311 | Human | Breast | IDC | 8.66e-27 | -3.07e-01 | 0.1534 |
| 4170 | MCL1 | GSM4909312 | Human | Breast | IDC | 8.38e-04 | 8.22e-02 | 0.1552 |
| 4170 | MCL1 | GSM4909319 | Human | Breast | IDC | 1.12e-35 | -6.05e-01 | 0.1563 |
| 4170 | MCL1 | GSM4909320 | Human | Breast | IDC | 2.46e-06 | -5.35e-01 | 0.1575 |
| 4170 | MCL1 | GSM4909321 | Human | Breast | IDC | 4.44e-08 | 2.00e-02 | 0.1559 |
| 4170 | MCL1 | brca2 | Human | Breast | Precancer | 6.51e-03 | -8.41e-02 | -0.024 |
| 4170 | MCL1 | brca3 | Human | Breast | Precancer | 2.99e-04 | -1.06e-02 | -0.0263 |
| 4170 | MCL1 | brca10 | Human | Breast | Precancer | 9.33e-04 | -3.85e-01 | -0.0029 |
| 4170 | MCL1 | NCCBC14 | Human | Breast | DCIS | 8.16e-07 | -3.13e-01 | 0.2021 |
| 4170 | MCL1 | NCCBC5 | Human | Breast | DCIS | 5.78e-08 | -3.78e-01 | 0.2046 |
| 4170 | MCL1 | P1 | Human | Breast | IDC | 1.48e-12 | -1.66e-01 | 0.1527 |
| 4170 | MCL1 | DCIS2 | Human | Breast | DCIS | 1.88e-46 | 4.59e-01 | 0.0085 |
| Page: 1 2 3 4 5 6 7 8 9 10 11 |
| Tissue | Expression Dynamics | Abbreviation |
| Breast |  | IDC: Invasive ductal carcinoma |
| DCIS: Ductal carcinoma in situ | ||
| Precancer(BRCA1-mut): Precancerous lesion from BRCA1 mutation carriers | ||
| Colorectum (GSE201348) |  | FAP: Familial adenomatous polyposis |
| CRC: Colorectal cancer | ||
| Colorectum (HTA11) | 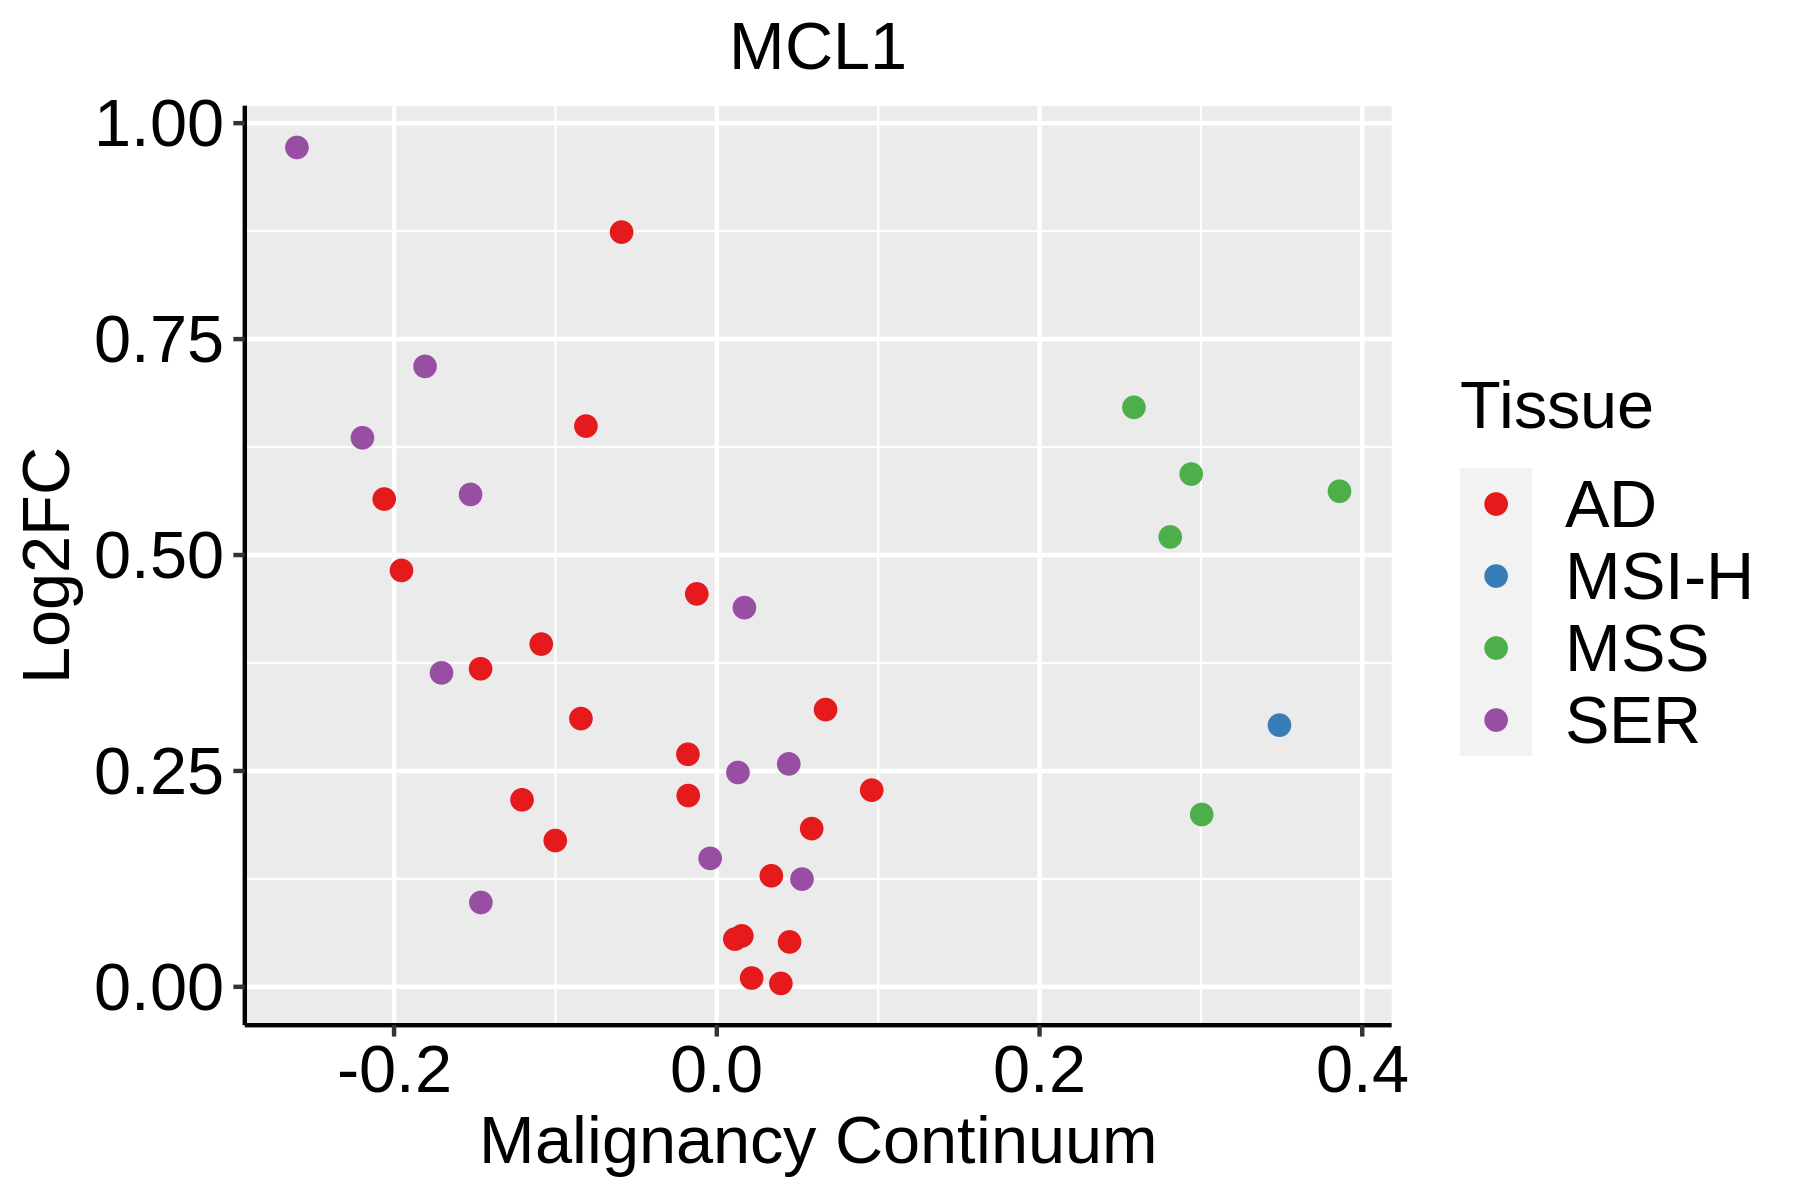 | AD: Adenomas |
| SER: Sessile serrated lesions | ||
| MSI-H: Microsatellite-high colorectal cancer | ||
| MSS: Microsatellite stable colorectal cancer | ||
| Endometrium |  | AEH: Atypical endometrial hyperplasia |
| EEC: Endometrioid Cancer | ||
| Esophagus | 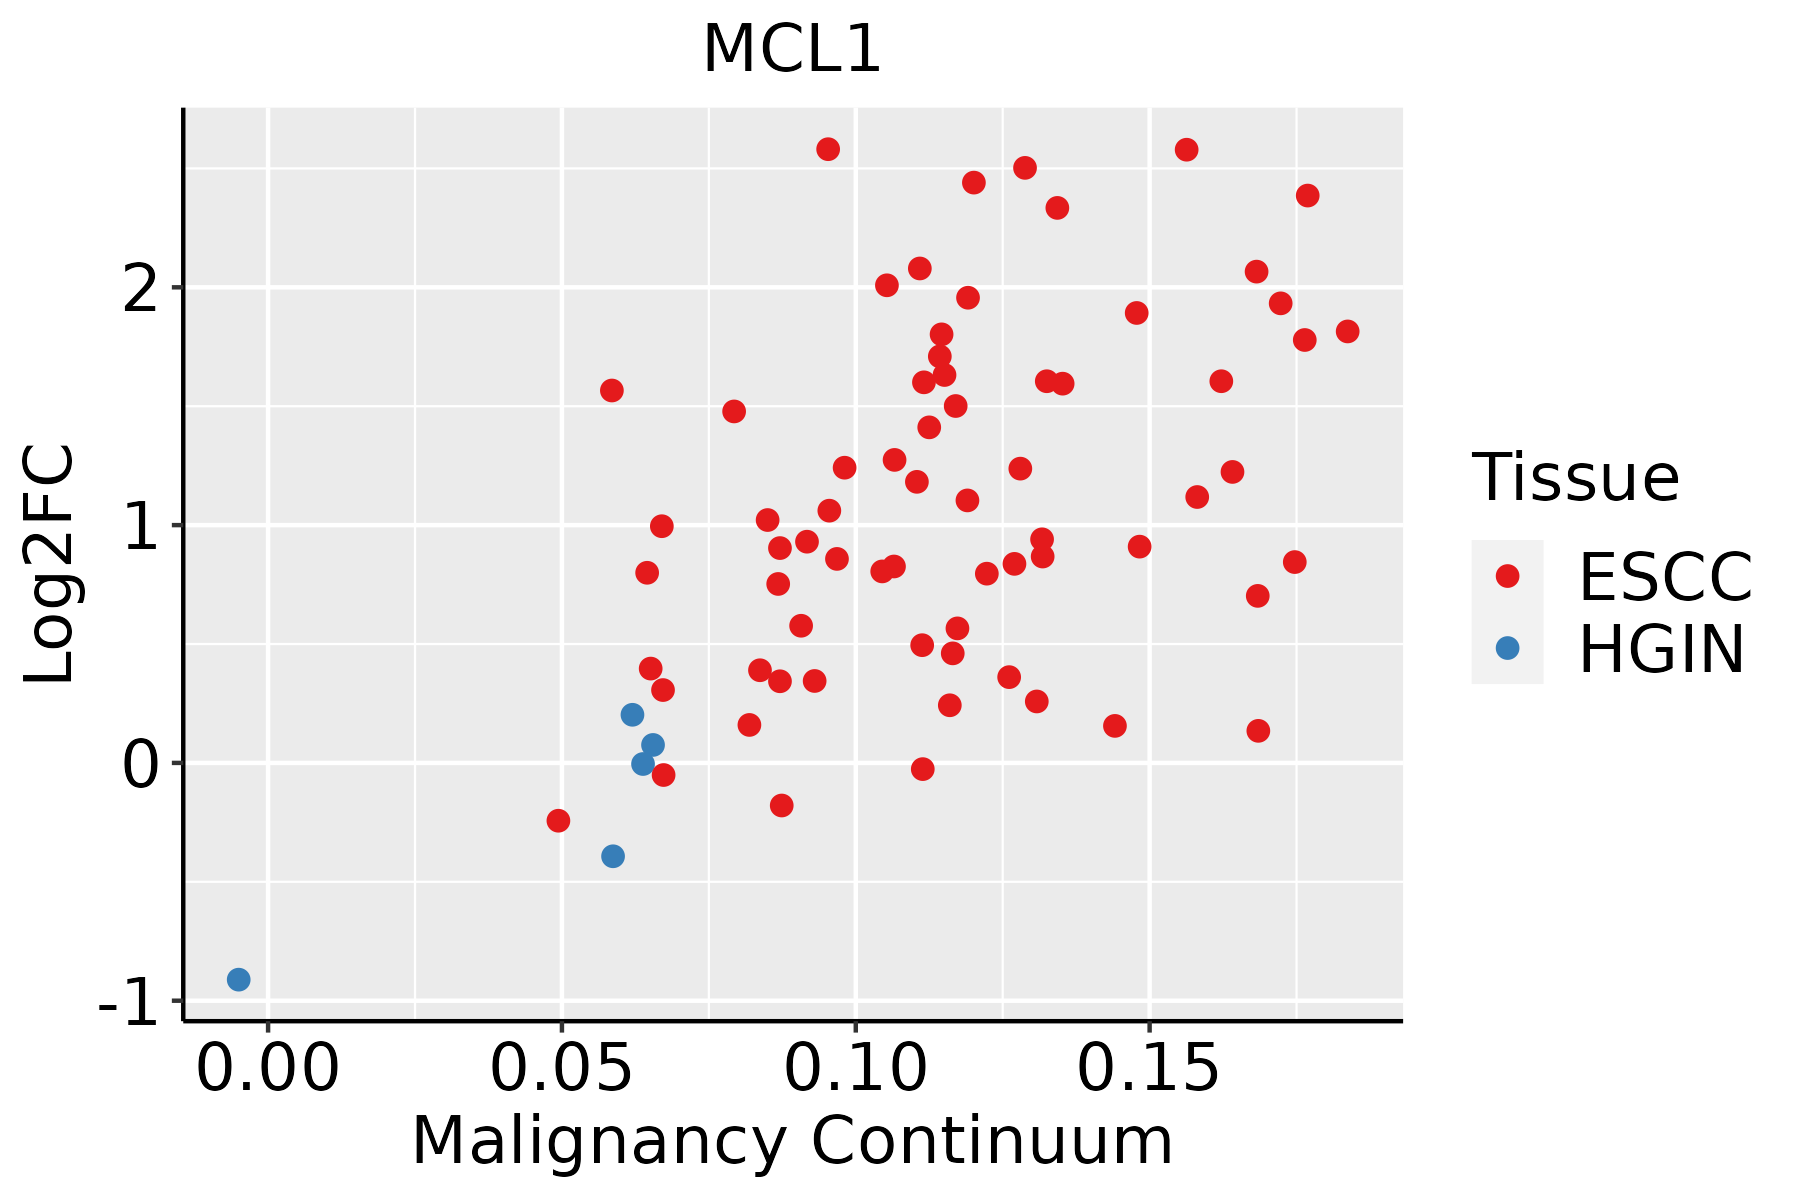 | ESCC: Esophageal squamous cell carcinoma |
| HGIN: High-grade intraepithelial neoplasias | ||
| LGIN: Low-grade intraepithelial neoplasias | ||
| Liver |  | HCC: Hepatocellular carcinoma |
| NAFLD: Non-alcoholic fatty liver disease | ||
| Lung |  | AAH: Atypical adenomatous hyperplasia |
| AIS: Adenocarcinoma in situ | ||
| IAC: Invasive lung adenocarcinoma | ||
| MIA: Minimally invasive adenocarcinoma | ||
| Oral Cavity | 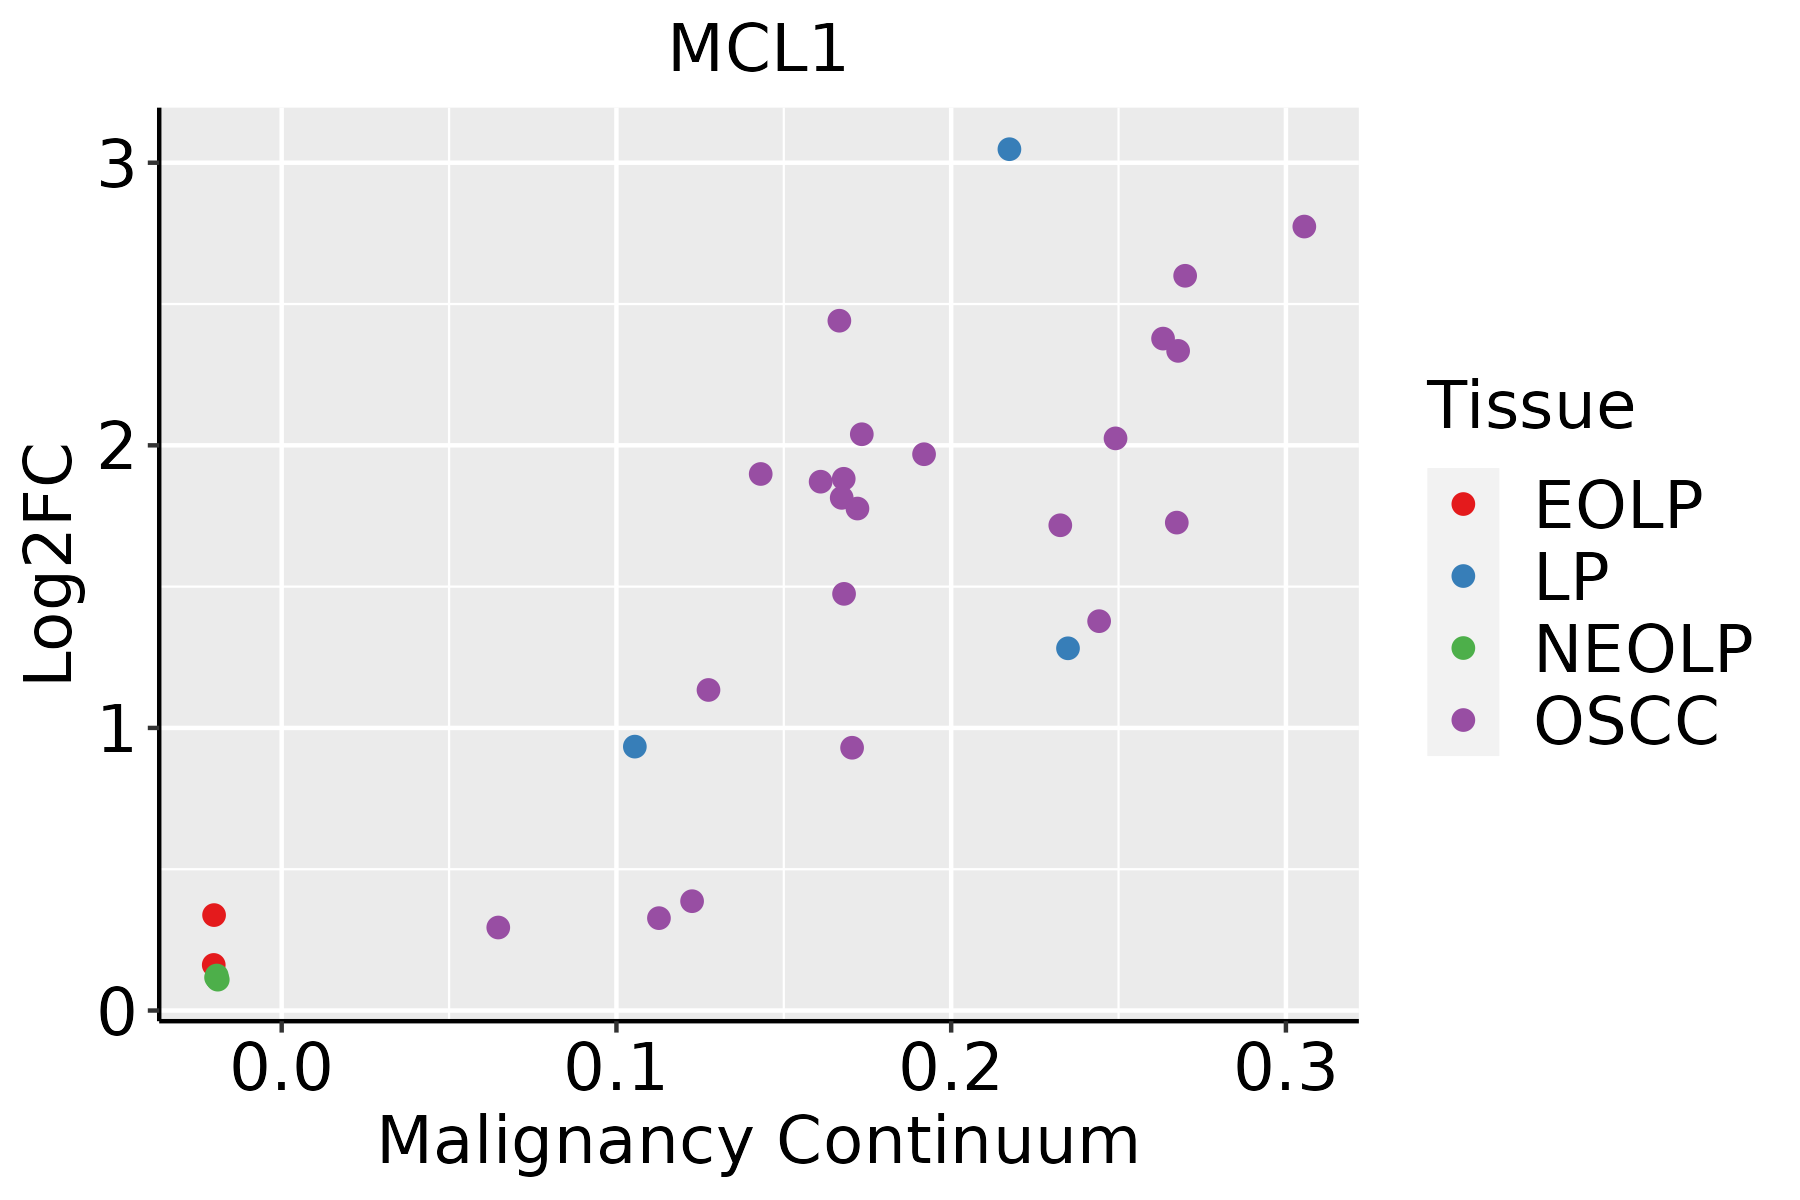 | EOLP: Erosive Oral lichen planus |
| LP: leukoplakia | ||
| NEOLP: Non-erosive oral lichen planus | ||
| OSCC: Oral squamous cell carcinoma | ||
| Prostate | 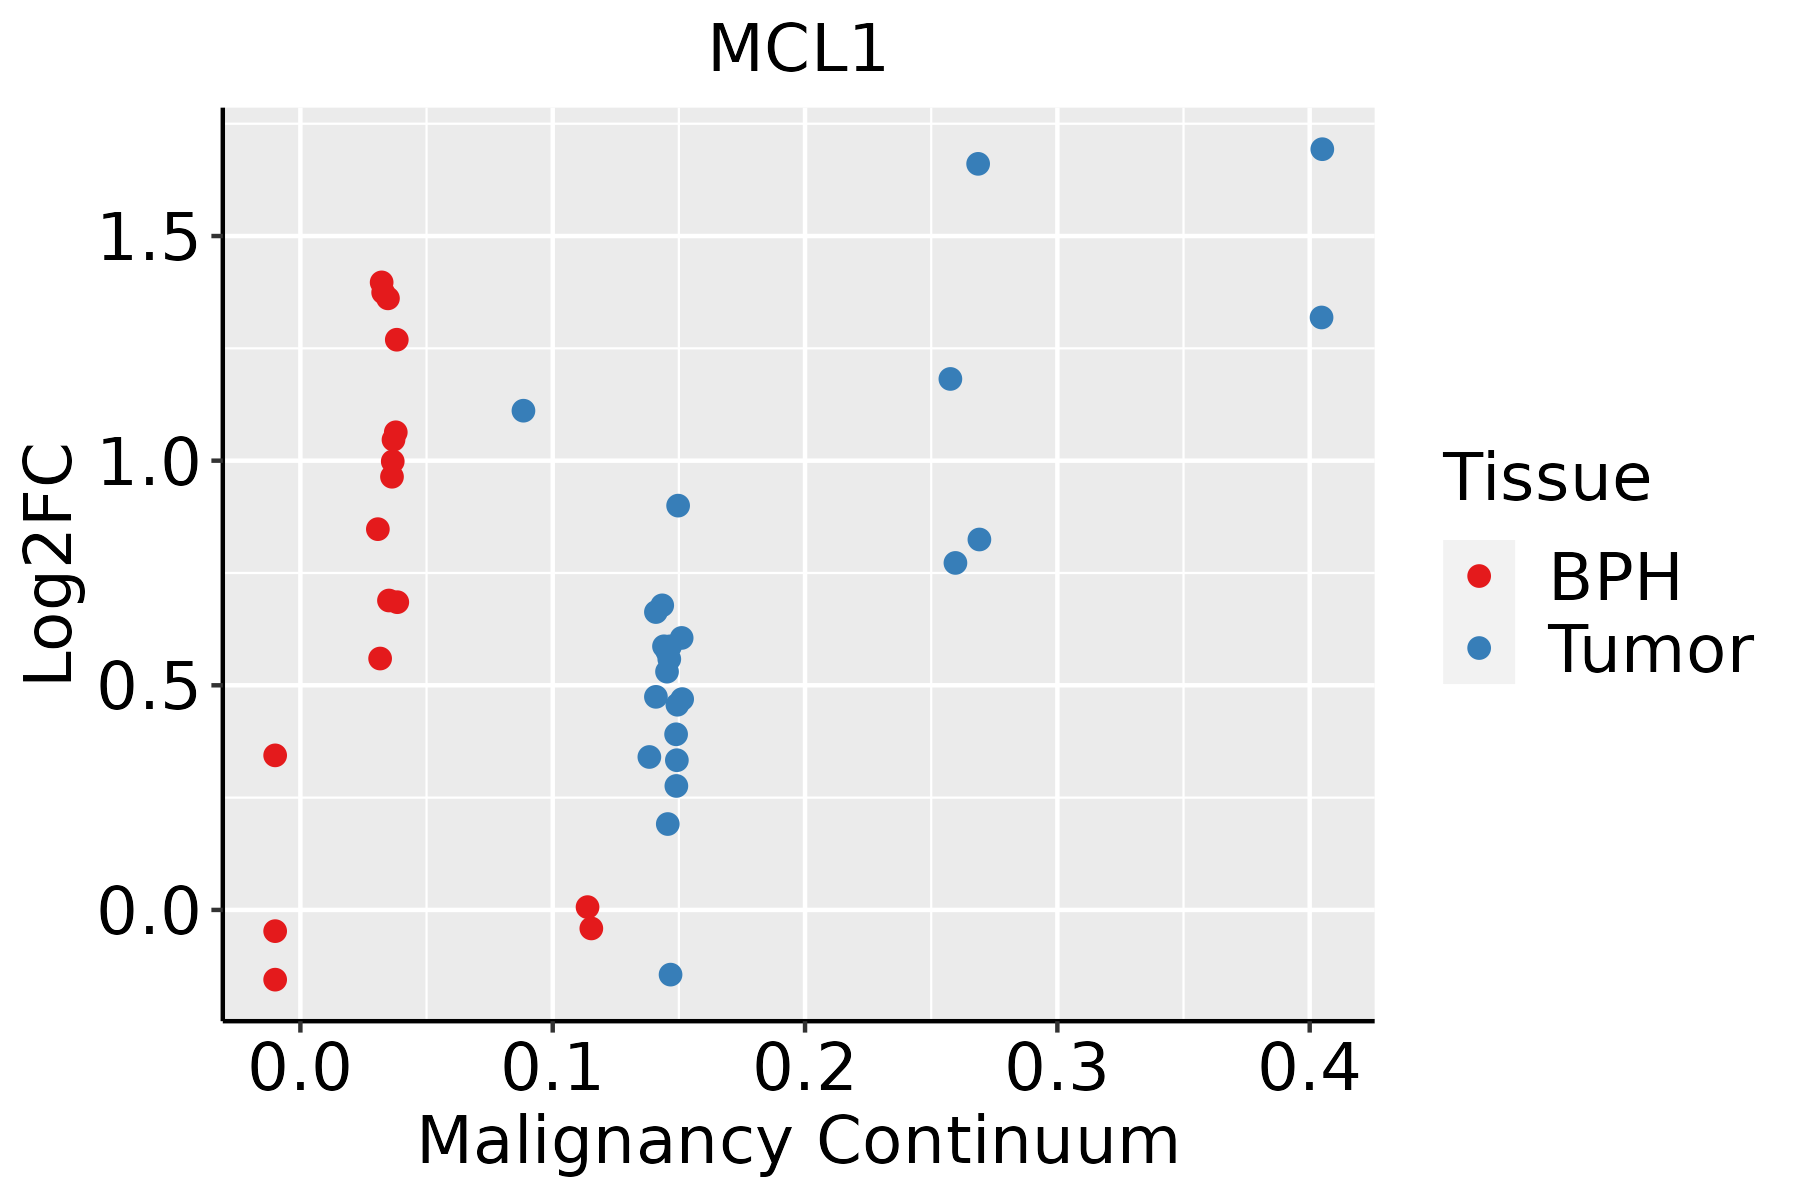 | BPH: Benign Prostatic Hyperplasia |
| Skin | 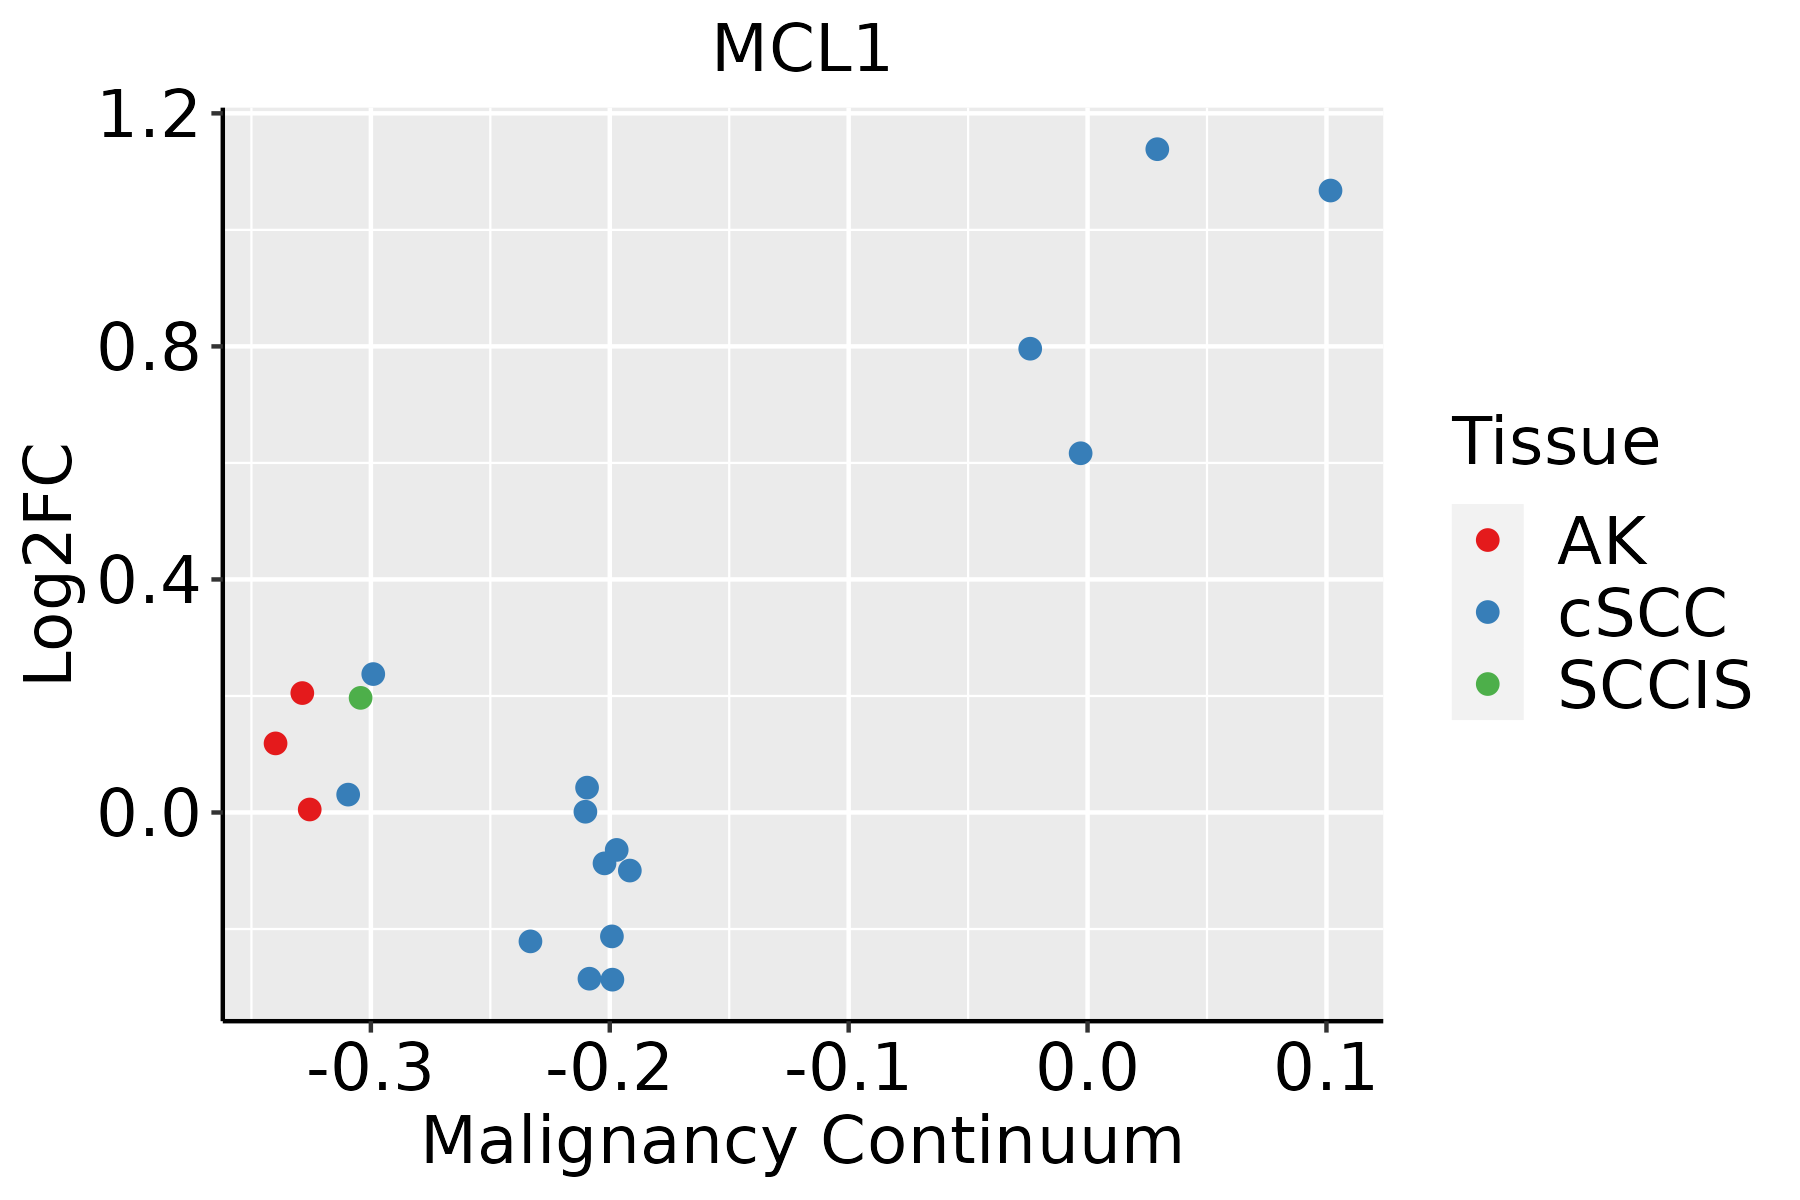 | AK: Actinic keratosis |
| cSCC: Cutaneous squamous cell carcinoma | ||
| SCCIS:squamous cell carcinoma in situ | ||
| Thyroid | 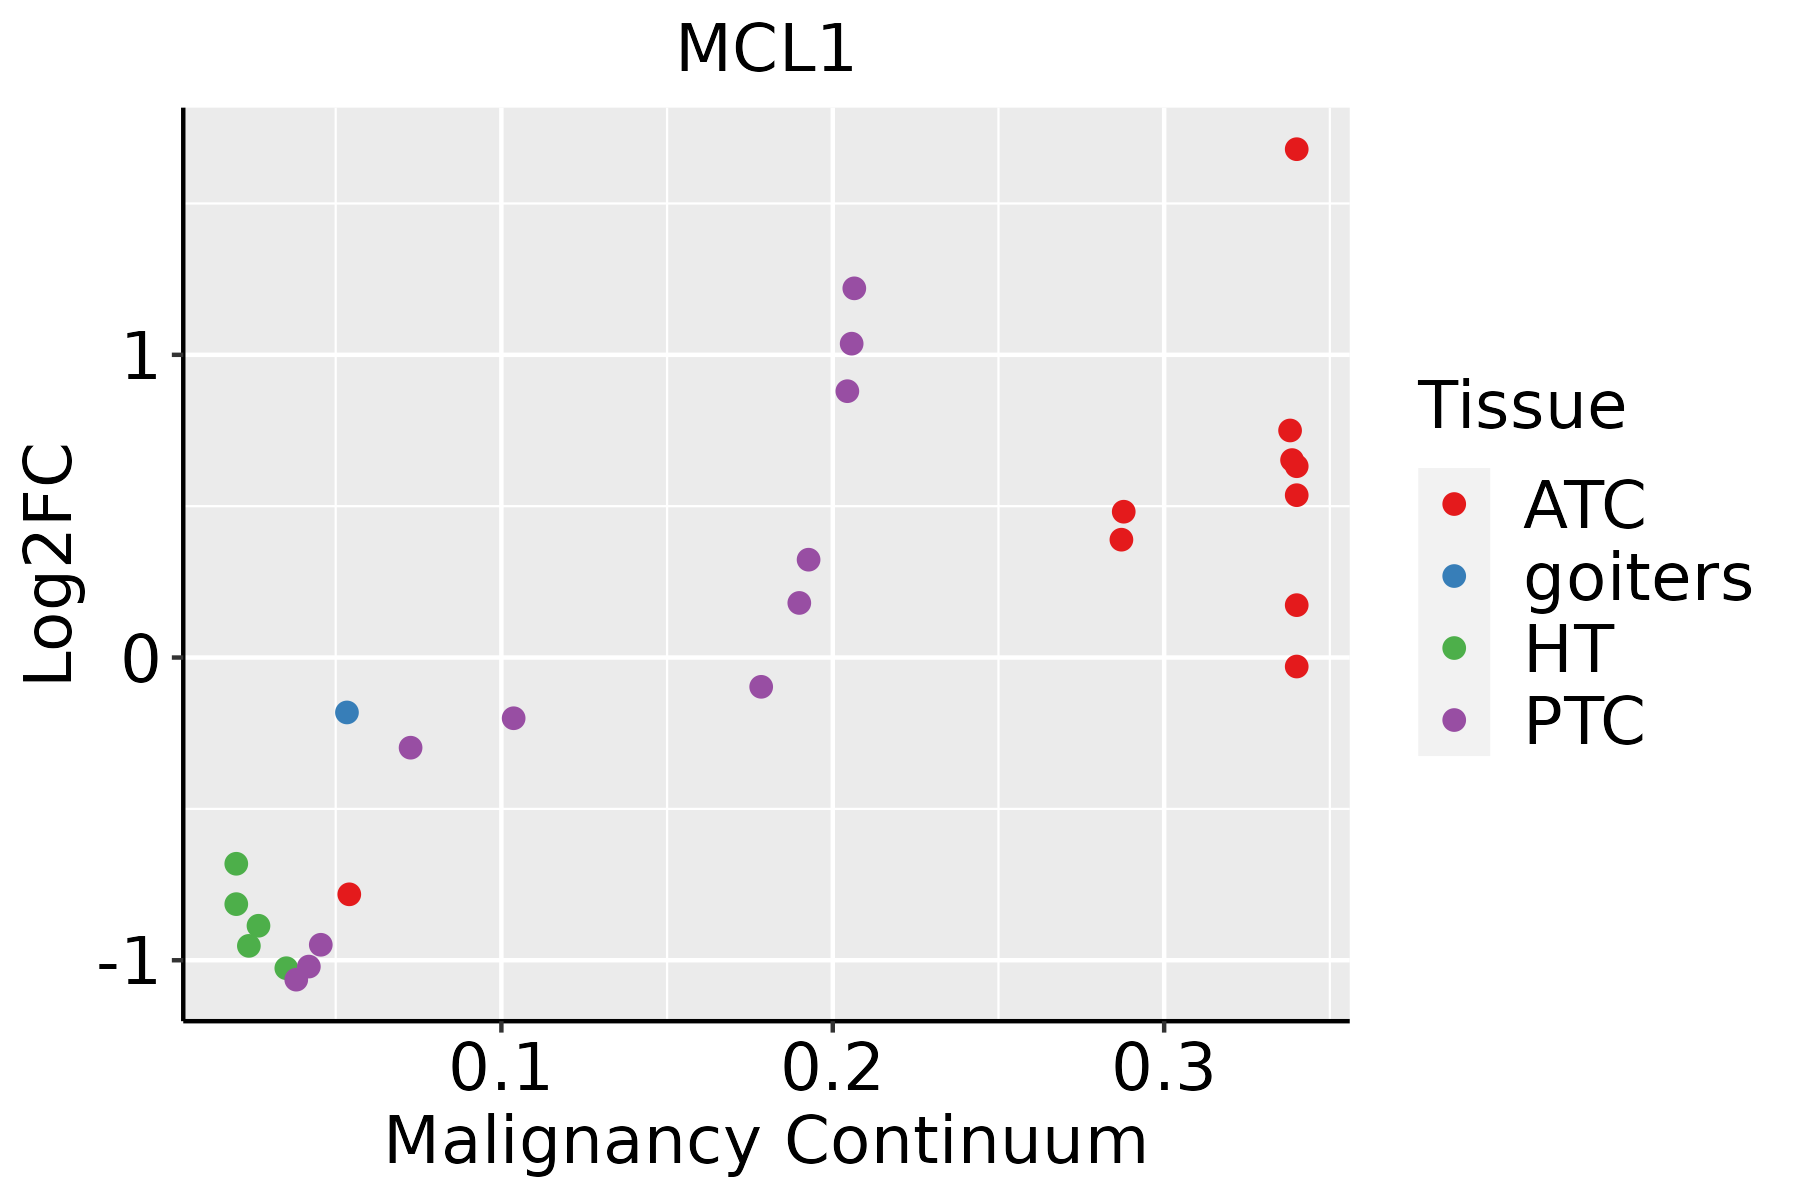 | ATC: Anaplastic thyroid cancer |
| HT: Hashimoto's thyroiditis | ||
| PTC: Papillary thyroid cancer |
| ∗log2FC in expression of this searched gene in stem-like cells from each diseased tissue sample relative to stem-like cells in normal samples in each tissue plotted against the malignancy continuum. Samples are colored based on if they are from different disease stage. |
Top |
Malignant transformation related pathway analysis |
| Find out the enriched GO biological processes and KEGG pathways involved in transition from healthy to precancer to cancer |
| Tissue | Disease Stage | Enriched GO biological Processes |
| Colorectum | AD |  |
| Colorectum | SER |  |
| Colorectum | MSS |  |
| Colorectum | MSI-H |  |
| Colorectum | FAP |  |
| ∗Top 15 enriched GO BP terms are showed in the bar plot of each disease state in each tissue. Each row represents a significant GO biological process which is colored according to the -log10(p.adjust). |
| Page: 1 2 3 4 5 6 7 8 9 |
| GO ID | Tissue | Disease Stage | Description | Gene Ratio | Bg Ratio | pvalue | p.adjust | Count |
| GO:190288220 | Esophagus | ESCC | regulation of response to oxidative stress | 58/8552 | 98/18723 | 4.86e-03 | 1.88e-02 | 58 |
| GO:190320316 | Esophagus | ESCC | regulation of oxidative stress-induced neuron death | 19/8552 | 27/18723 | 8.35e-03 | 2.95e-02 | 19 |
| GO:190040720 | Esophagus | ESCC | regulation of cellular response to oxidative stress | 52/8552 | 89/18723 | 1.04e-02 | 3.56e-02 | 52 |
| GO:190320120 | Esophagus | ESCC | regulation of oxidative stress-induced cell death | 44/8552 | 74/18723 | 1.18e-02 | 3.94e-02 | 44 |
| GO:000697912 | Liver | Cirrhotic | response to oxidative stress | 196/4634 | 446/18723 | 2.80e-19 | 5.86e-17 | 196 |
| GO:200123312 | Liver | Cirrhotic | regulation of apoptotic signaling pathway | 163/4634 | 356/18723 | 2.62e-18 | 4.43e-16 | 163 |
| GO:006219712 | Liver | Cirrhotic | cellular response to chemical stress | 147/4634 | 337/18723 | 1.84e-14 | 1.72e-12 | 147 |
| GO:009719312 | Liver | Cirrhotic | intrinsic apoptotic signaling pathway | 130/4634 | 288/18723 | 2.69e-14 | 2.45e-12 | 130 |
| GO:003459912 | Liver | Cirrhotic | cellular response to oxidative stress | 127/4634 | 288/18723 | 4.29e-13 | 3.32e-11 | 127 |
| GO:20012427 | Liver | Cirrhotic | regulation of intrinsic apoptotic signaling pathway | 82/4634 | 164/18723 | 2.35e-12 | 1.71e-10 | 82 |
| GO:20012347 | Liver | Cirrhotic | negative regulation of apoptotic signaling pathway | 102/4634 | 224/18723 | 8.40e-12 | 5.60e-10 | 102 |
| GO:001050611 | Liver | Cirrhotic | regulation of autophagy | 132/4634 | 317/18723 | 2.17e-11 | 1.33e-09 | 132 |
| GO:009719112 | Liver | Cirrhotic | extrinsic apoptotic signaling pathway | 97/4634 | 219/18723 | 1.82e-10 | 9.11e-09 | 97 |
| GO:200123612 | Liver | Cirrhotic | regulation of extrinsic apoptotic signaling pathway | 72/4634 | 151/18723 | 7.80e-10 | 3.62e-08 | 72 |
| GO:007099712 | Liver | Cirrhotic | neuron death | 141/4634 | 361/18723 | 9.56e-10 | 4.38e-08 | 141 |
| GO:200123512 | Liver | Cirrhotic | positive regulation of apoptotic signaling pathway | 60/4634 | 126/18723 | 2.08e-08 | 7.47e-07 | 60 |
| GO:19012147 | Liver | Cirrhotic | regulation of neuron death | 122/4634 | 319/18723 | 5.17e-08 | 1.62e-06 | 122 |
| GO:000989512 | Liver | Cirrhotic | negative regulation of catabolic process | 121/4634 | 320/18723 | 1.21e-07 | 3.39e-06 | 121 |
| GO:003133012 | Liver | Cirrhotic | negative regulation of cellular catabolic process | 101/4634 | 262/18723 | 4.57e-07 | 1.05e-05 | 101 |
| GO:20012437 | Liver | Cirrhotic | negative regulation of intrinsic apoptotic signaling pathway | 47/4634 | 98/18723 | 5.26e-07 | 1.17e-05 | 47 |
| Page: 1 2 3 4 5 6 7 8 9 10 11 12 13 14 15 16 17 18 19 20 21 22 23 24 25 26 27 28 29 30 31 32 33 34 35 36 37 38 39 40 41 |
| Pathway ID | Tissue | Disease Stage | Description | Gene Ratio | Bg Ratio | pvalue | p.adjust | qvalue | Count |
| hsa042108 | Breast | Precancer | Apoptosis | 25/684 | 136/8465 | 7.61e-05 | 6.87e-04 | 5.26e-04 | 25 |
| hsa0421013 | Breast | Precancer | Apoptosis | 25/684 | 136/8465 | 7.61e-05 | 6.87e-04 | 5.26e-04 | 25 |
| hsa0421022 | Breast | IDC | Apoptosis | 31/867 | 136/8465 | 1.34e-05 | 1.61e-04 | 1.20e-04 | 31 |
| hsa0421032 | Breast | IDC | Apoptosis | 31/867 | 136/8465 | 1.34e-05 | 1.61e-04 | 1.20e-04 | 31 |
| hsa0421041 | Breast | DCIS | Apoptosis | 29/846 | 136/8465 | 5.92e-05 | 5.97e-04 | 4.40e-04 | 29 |
| hsa0421051 | Breast | DCIS | Apoptosis | 29/846 | 136/8465 | 5.92e-05 | 5.97e-04 | 4.40e-04 | 29 |
| hsa04210 | Colorectum | MSS | Apoptosis | 44/1875 | 136/8465 | 3.66e-03 | 1.66e-02 | 1.01e-02 | 44 |
| hsa042101 | Colorectum | MSS | Apoptosis | 44/1875 | 136/8465 | 3.66e-03 | 1.66e-02 | 1.01e-02 | 44 |
| hsa0421024 | Endometrium | EEC | Apoptosis | 31/1237 | 136/8465 | 6.72e-03 | 3.25e-02 | 2.42e-02 | 31 |
| hsa0421034 | Endometrium | EEC | Apoptosis | 31/1237 | 136/8465 | 6.72e-03 | 3.25e-02 | 2.42e-02 | 31 |
| hsa0421020 | Esophagus | HGIN | Apoptosis | 36/1383 | 136/8465 | 1.67e-03 | 1.52e-02 | 1.20e-02 | 36 |
| hsa04210110 | Esophagus | HGIN | Apoptosis | 36/1383 | 136/8465 | 1.67e-03 | 1.52e-02 | 1.20e-02 | 36 |
| hsa0421027 | Esophagus | ESCC | Apoptosis | 102/4205 | 136/8465 | 1.05e-09 | 1.21e-08 | 6.21e-09 | 102 |
| hsa041517 | Esophagus | ESCC | PI3K-Akt signaling pathway | 197/4205 | 354/8465 | 1.24e-02 | 2.83e-02 | 1.45e-02 | 197 |
| hsa0421037 | Esophagus | ESCC | Apoptosis | 102/4205 | 136/8465 | 1.05e-09 | 1.21e-08 | 6.21e-09 | 102 |
| hsa0415114 | Esophagus | ESCC | PI3K-Akt signaling pathway | 197/4205 | 354/8465 | 1.24e-02 | 2.83e-02 | 1.45e-02 | 197 |
| hsa042106 | Liver | Cirrhotic | Apoptosis | 58/2530 | 136/8465 | 9.84e-04 | 5.55e-03 | 3.42e-03 | 58 |
| hsa0421011 | Liver | Cirrhotic | Apoptosis | 58/2530 | 136/8465 | 9.84e-04 | 5.55e-03 | 3.42e-03 | 58 |
| hsa042102 | Liver | HCC | Apoptosis | 83/4020 | 136/8465 | 9.51e-04 | 3.58e-03 | 1.99e-03 | 83 |
| hsa042103 | Liver | HCC | Apoptosis | 83/4020 | 136/8465 | 9.51e-04 | 3.58e-03 | 1.99e-03 | 83 |
| Page: 1 2 3 |
Top |
Cell-cell communication analysis |
| Identification of potential cell-cell interactions between two cell types and their ligand-receptor pairs for different disease states |
| Ligand | Receptor | LRpair | Pathway | Tissue | Disease Stage |
| Page: 1 |
Top |
Single-cell gene regulatory network inference analysis |
| Find out the significant the regulons (TFs) and the target genes of each regulon across cell types for different disease states |
| TF | Cell Type | Tissue | Disease Stage | Target Gene | RSS | Regulon Activity |
| ∗The dot plots of a searched regulon are shown for all cell subpopulations in each disease state of each tissue based on the regulon specific score inferred using pySCENIC and by calculating the average expression. |
| Page: 1 |
Top |
Somatic mutation of malignant transformation related genes |
| Annotation of somatic variants for genes involved in malignant transformation |
| Hugo Symbol | Variant Class | Variant Classification | dbSNP RS | HGVSc | HGVSp | HGVSp Short | SWISSPROT | BIOTYPE | SIFT | PolyPhen | Tumor Sample Barcode | Tissue | Histology | Sex | Age | Stage | Therapy Types | Drugs | Outcome |
| MCL1 | SNV | Missense_Mutation | c.724G>A | p.Asp242Asn | p.D242N | Q07820 | protein_coding | tolerated(0.11) | benign(0.268) | TCGA-D8-A1JN-01 | Breast | breast invasive carcinoma | Female | >=65 | III/IV | Hormone Therapy | anastrozolum | SD | |
| MCL1 | insertion | In_Frame_Ins | novel | c.734_735insCAAACTGTTGGT | p.Ser245_Leu246insLysLeuLeuVal | p.S245_L246insKLLV | Q07820 | protein_coding | TCGA-A8-A0A4-01 | Breast | breast invasive carcinoma | Female | >=65 | I/II | Hormone Therapy | tamoxiphen | CR | ||
| MCL1 | insertion | Frame_Shift_Ins | novel | c.732_733insGCTTCTCTTC | p.Ser245AlafsTer35 | p.S245Afs*35 | Q07820 | protein_coding | TCGA-A8-A0A4-01 | Breast | breast invasive carcinoma | Female | >=65 | I/II | Hormone Therapy | tamoxiphen | CR | ||
| MCL1 | SNV | Missense_Mutation | c.485N>G | p.Ser162Trp | p.S162W | Q07820 | protein_coding | deleterious(0) | probably_damaging(0.979) | TCGA-JW-A5VL-01 | Cervix | cervical & endocervical cancer | Female | <65 | I/II | Unknown | Unknown | SD | |
| MCL1 | SNV | Missense_Mutation | novel | c.823G>A | p.Ala275Thr | p.A275T | Q07820 | protein_coding | deleterious(0.02) | possibly_damaging(0.546) | TCGA-AA-3976-01 | Colorectum | colon adenocarcinoma | Male | >=65 | III/IV | Chemotherapy | folinic | CR |
| MCL1 | SNV | Missense_Mutation | novel | c.543T>G | p.Ile181Met | p.I181M | Q07820 | protein_coding | tolerated(0.1) | benign(0.231) | TCGA-AA-3976-01 | Colorectum | colon adenocarcinoma | Male | >=65 | III/IV | Chemotherapy | folinic | CR |
| MCL1 | SNV | Missense_Mutation | novel | c.74G>A | p.Ser25Asn | p.S25N | Q07820 | protein_coding | tolerated_low_confidence(0.12) | benign(0.023) | TCGA-AA-A022-01 | Colorectum | colon adenocarcinoma | Female | >=65 | I/II | Unknown | Unknown | SD |
| MCL1 | SNV | Missense_Mutation | novel | c.844N>C | p.Asn282His | p.N282H | Q07820 | protein_coding | deleterious(0.04) | probably_damaging(0.956) | TCGA-AG-A00Y-01 | Colorectum | rectum adenocarcinoma | Male | >=65 | I/II | Unknown | Unknown | PD |
| MCL1 | SNV | Missense_Mutation | novel | c.361T>A | p.Ser121Thr | p.S121T | Q07820 | protein_coding | tolerated(0.07) | benign(0.202) | TCGA-B5-A1MX-01 | Endometrium | uterine corpus endometrioid carcinoma | Female | <65 | I/II | Hormone Therapy | megace | SD |
| MCL1 | SNV | Missense_Mutation | novel | c.679N>A | p.Ala227Thr | p.A227T | Q07820 | protein_coding | deleterious(0.04) | possibly_damaging(0.628) | TCGA-BG-A222-01 | Endometrium | uterine corpus endometrioid carcinoma | Female | <65 | I/II | Unknown | Unknown | SD |
| Page: 1 2 3 |
Top |
Related drugs of malignant transformation related genes |
| Identification of chemicals and drugs interact with genes involved in malignant transfromation |
| (DGIdb 4.0) |
| Entrez ID | Symbol | Category | Interaction Types | Drug Claim Name | Drug Name | PMIDs |
| 4170 | MCL1 | DRUGGABLE GENOME, CLINICALLY ACTIONABLE | PMID27744724-Compound-13 | |||
| 4170 | MCL1 | DRUGGABLE GENOME, CLINICALLY ACTIONABLE | PROCHLORPERAZINE | PROCHLORPERAZINE | ||
| 4170 | MCL1 | DRUGGABLE GENOME, CLINICALLY ACTIONABLE | SULFURETIN | SULFURETIN | ||
| 4170 | MCL1 | DRUGGABLE GENOME, CLINICALLY ACTIONABLE | PMID27744724-Compound-22 | |||
| 4170 | MCL1 | DRUGGABLE GENOME, CLINICALLY ACTIONABLE | APOMORPHINE HYDROCHLORIDE HEMIHYDRATE | APOMORPHINE HYDROCHLORIDE HEMIHYDRATE | ||
| 4170 | MCL1 | DRUGGABLE GENOME, CLINICALLY ACTIONABLE | CB7969312 | CHEMBL599255 | ||
| 4170 | MCL1 | DRUGGABLE GENOME, CLINICALLY ACTIONABLE | SJ000036432 | CHEMBL591135 | ||
| 4170 | MCL1 | DRUGGABLE GENOME, CLINICALLY ACTIONABLE | AMENTOFLAVONE | AMENTOFLAVONE | ||
| 4170 | MCL1 | DRUGGABLE GENOME, CLINICALLY ACTIONABLE | antagonist | 252166530 | VENETOCLAX | |
| 4170 | MCL1 | DRUGGABLE GENOME, CLINICALLY ACTIONABLE | LOMOFUNGIN | LOMOFUNGIN |
| Page: 1 2 3 4 5 6 7 8 |

Copyright 2023-Present -The University of Texas Health Science Center at Houston |