Schematic overview of the cellular and molecular mechanisms involved in the cancer progression, including the proposed cellular and molecular mechanisms in cancer cells trajectory. AT1: alveolar type 1 cells; AT2: alveolar type 2 cells; AAH: atypical adenomatous hyperplasia; AIS: adenocarcinoma in situ; MIA: minimally invasive adenocarcinoma; IA: invasive adenocarcinoma; EMT: epithelial-mesenchymal transition

Home

Download

Statistics

Help

Contact

Center for Computational Systems Medicine
leaf

Gene summary

leaf

Malignant transformation analysis

leaf

Malignant transformation related pathway analysis

leaf

Cell-cell communication analysis

leaf

Single-cell gene regulatory network inference analysis

leaf

Somatic mutation of malignant transformation related genes

leaf

Related drugs of malignant transformation related genes

Gene: MARK2

Gene summary for MARK2

check button Gene summary.

Gene informationSpeciesHuman
Gene symbol

MARK2

Gene ID

2011

Gene namemicrotubule affinity regulating kinase 2
Gene AliasEMK-1
Cytomap11q13.1
Gene Typeprotein-coding
GO ID

GO:0000226

UniProtAcc

Q7KZI7


Top

Malignant transformation analysis

check button Identification of the aberrant gene expression in precancerous and cancerous lesions by comparing the gene expression of stem-like cells in diseased tissues with normal stem cells
check button Malignant transformation involving gene list.
Entrez IDSymbolReplicatesSpeciesOrganTissueAdj P-valueLog2FCMalignancy
2011MARK2HTA11_3410_2000001011HumanColorectumAD1.23e-03-3.02e-010.0155
2011MARK2HTA11_2951_2000001011HumanColorectumAD1.13e-02-6.04e-010.0216
2011MARK2HTA11_347_2000001011HumanColorectumAD1.35e-043.86e-01-0.1954
2011MARK2HTA11_411_2000001011HumanColorectumSER3.99e-027.08e-01-0.2602
2011MARK2HTA11_99999970781_79442HumanColorectumMSS3.18e-08-3.25e-010.294
2011MARK2A002-C-010HumanColorectumFAP3.76e-02-2.31e-010.242
2011MARK2A015-C-203HumanColorectumFAP9.59e-26-3.69e-01-0.1294
2011MARK2A015-C-204HumanColorectumFAP4.99e-06-3.54e-01-0.0228
2011MARK2A014-C-040HumanColorectumFAP1.26e-02-4.15e-01-0.1184
2011MARK2A002-C-201HumanColorectumFAP3.54e-08-2.95e-010.0324
2011MARK2A002-C-203HumanColorectumFAP2.71e-04-1.91e-010.2786
2011MARK2A001-C-119HumanColorectumFAP1.00e-03-2.80e-01-0.1557
2011MARK2A001-C-108HumanColorectumFAP3.21e-16-3.24e-01-0.0272
2011MARK2A002-C-205HumanColorectumFAP4.03e-16-4.09e-01-0.1236
2011MARK2A001-C-104HumanColorectumFAP3.90e-06-2.25e-010.0184
2011MARK2A015-C-005HumanColorectumFAP2.53e-05-3.62e-01-0.0336
2011MARK2A015-C-006HumanColorectumFAP5.18e-08-2.55e-01-0.0994
2011MARK2A015-C-106HumanColorectumFAP4.33e-15-2.22e-01-0.0511
2011MARK2A002-C-114HumanColorectumFAP1.13e-12-3.80e-01-0.1561
2011MARK2A015-C-104HumanColorectumFAP1.67e-28-3.65e-01-0.1899
Page: 1 2 3 4 5 6 7 

check button Transcriptomic changes along malignancy continuum.
TissueExpression DynamicsAbbreviation
Colorectum (GSE201348)The image shows the transcriptomic changes along malignancy continuum.log2FC in expression of this searched gene in stem-like cells from each diseased tissue sample relative to stem-like cells in normal samples in each tissue plotted against the malignancy continuum. Samples are colored based on if they are from different disease stage.FAP: Familial adenomatous polyposis
CRC: Colorectal cancer
Colorectum (HTA11)The image shows the transcriptomic changes along malignancy continuum.log2FC in expression of this searched gene in stem-like cells from each diseased tissue sample relative to stem-like cells in normal samples in each tissue plotted against the malignancy continuum. Samples are colored based on if they are from different disease stage.AD: Adenomas
SER: Sessile serrated lesions
MSI-H: Microsatellite-high colorectal cancer
MSS: Microsatellite stable colorectal cancer
EsophagusThe image shows the transcriptomic changes along malignancy continuum.log2FC in expression of this searched gene in stem-like cells from each diseased tissue sample relative to stem-like cells in normal samples in each tissue plotted against the malignancy continuum. Samples are colored based on if they are from different disease stage.
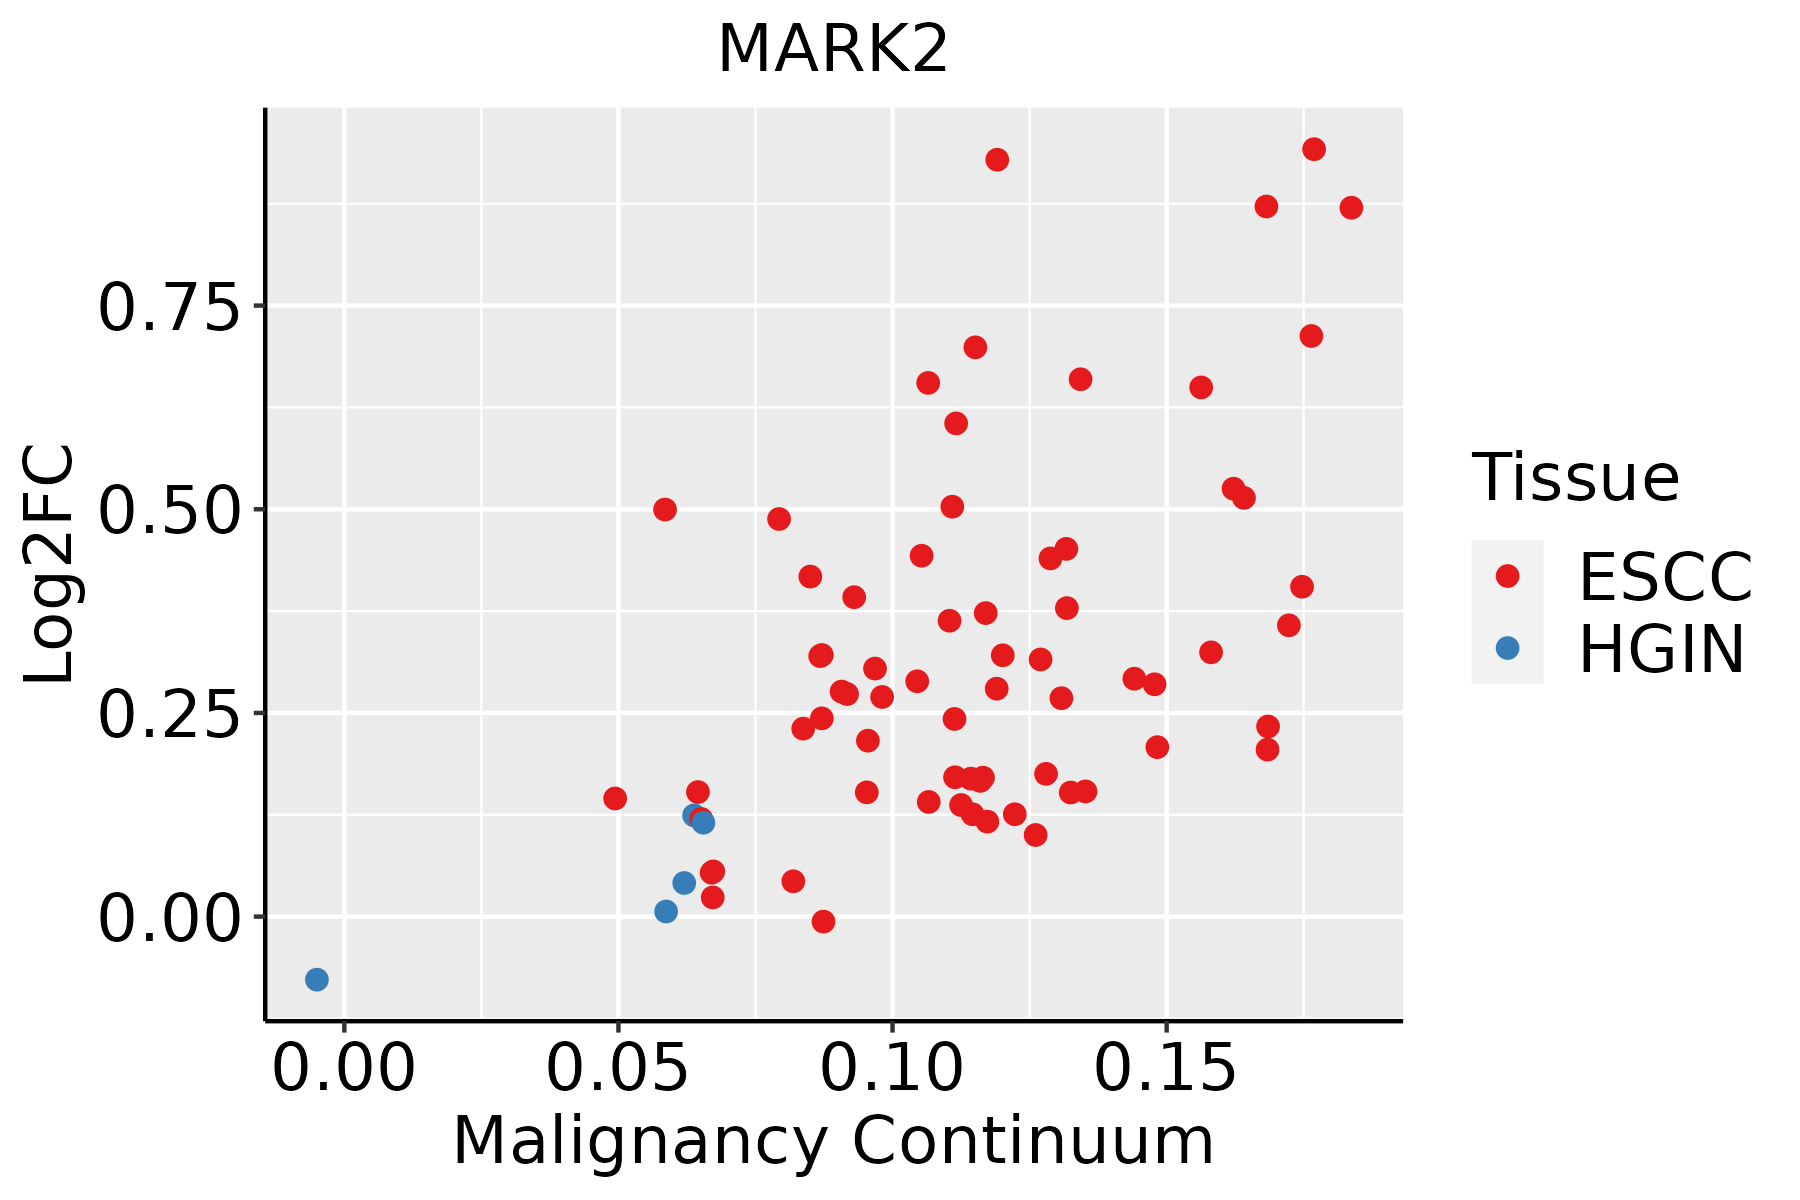
ESCC: Esophageal squamous cell carcinoma
HGIN: High-grade intraepithelial neoplasias
LGIN: Low-grade intraepithelial neoplasias
LiverThe image shows the transcriptomic changes along malignancy continuum.log2FC in expression of this searched gene in stem-like cells from each diseased tissue sample relative to stem-like cells in normal samples in each tissue plotted against the malignancy continuum. Samples are colored based on if they are from different disease stage.
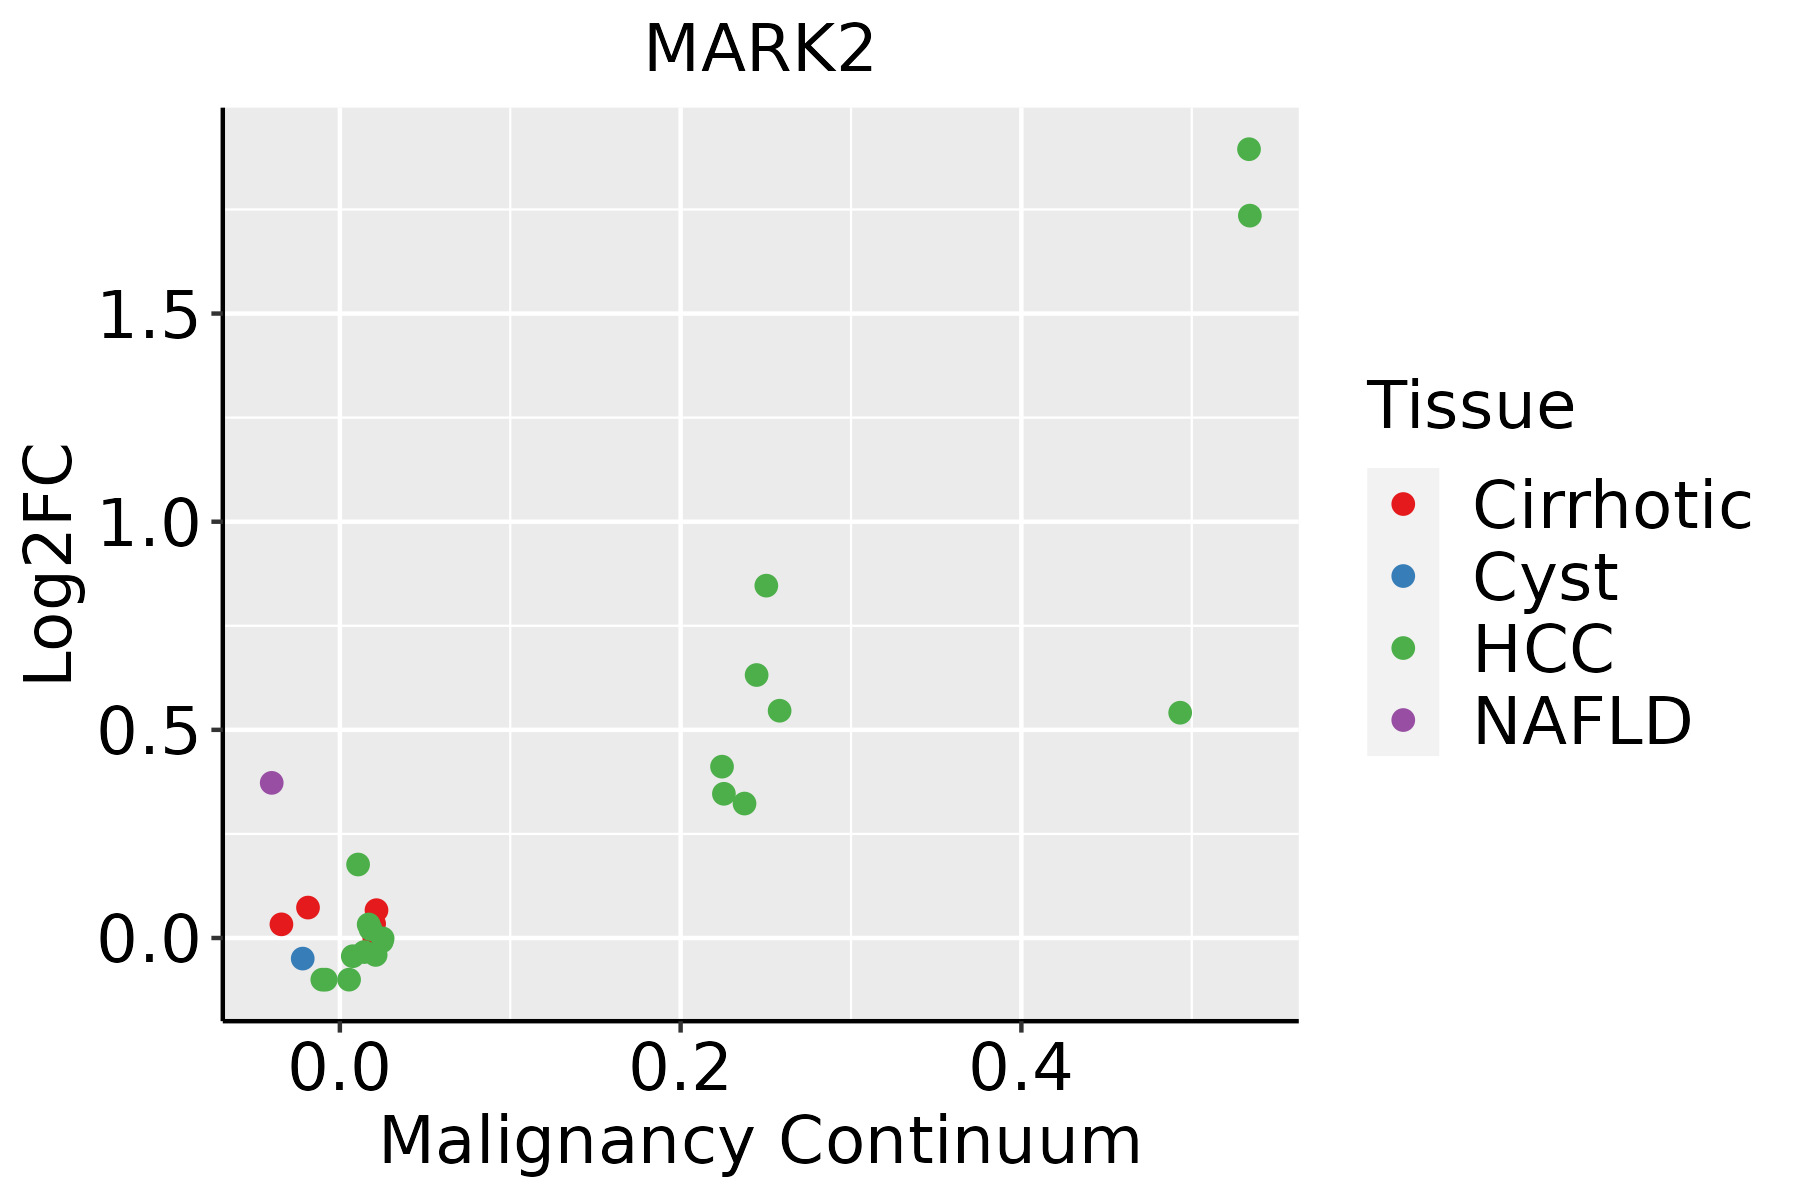
HCC: Hepatocellular carcinoma
NAFLD: Non-alcoholic fatty liver disease
Oral CavityThe image shows the transcriptomic changes along malignancy continuum.log2FC in expression of this searched gene in stem-like cells from each diseased tissue sample relative to stem-like cells in normal samples in each tissue plotted against the malignancy continuum. Samples are colored based on if they are from different disease stage.EOLP: Erosive Oral lichen planus
LP: leukoplakia
NEOLP: Non-erosive oral lichen planus
OSCC: Oral squamous cell carcinoma
SkinThe image shows the transcriptomic changes along malignancy continuum.log2FC in expression of this searched gene in stem-like cells from each diseased tissue sample relative to stem-like cells in normal samples in each tissue plotted against the malignancy continuum. Samples are colored based on if they are from different disease stage.
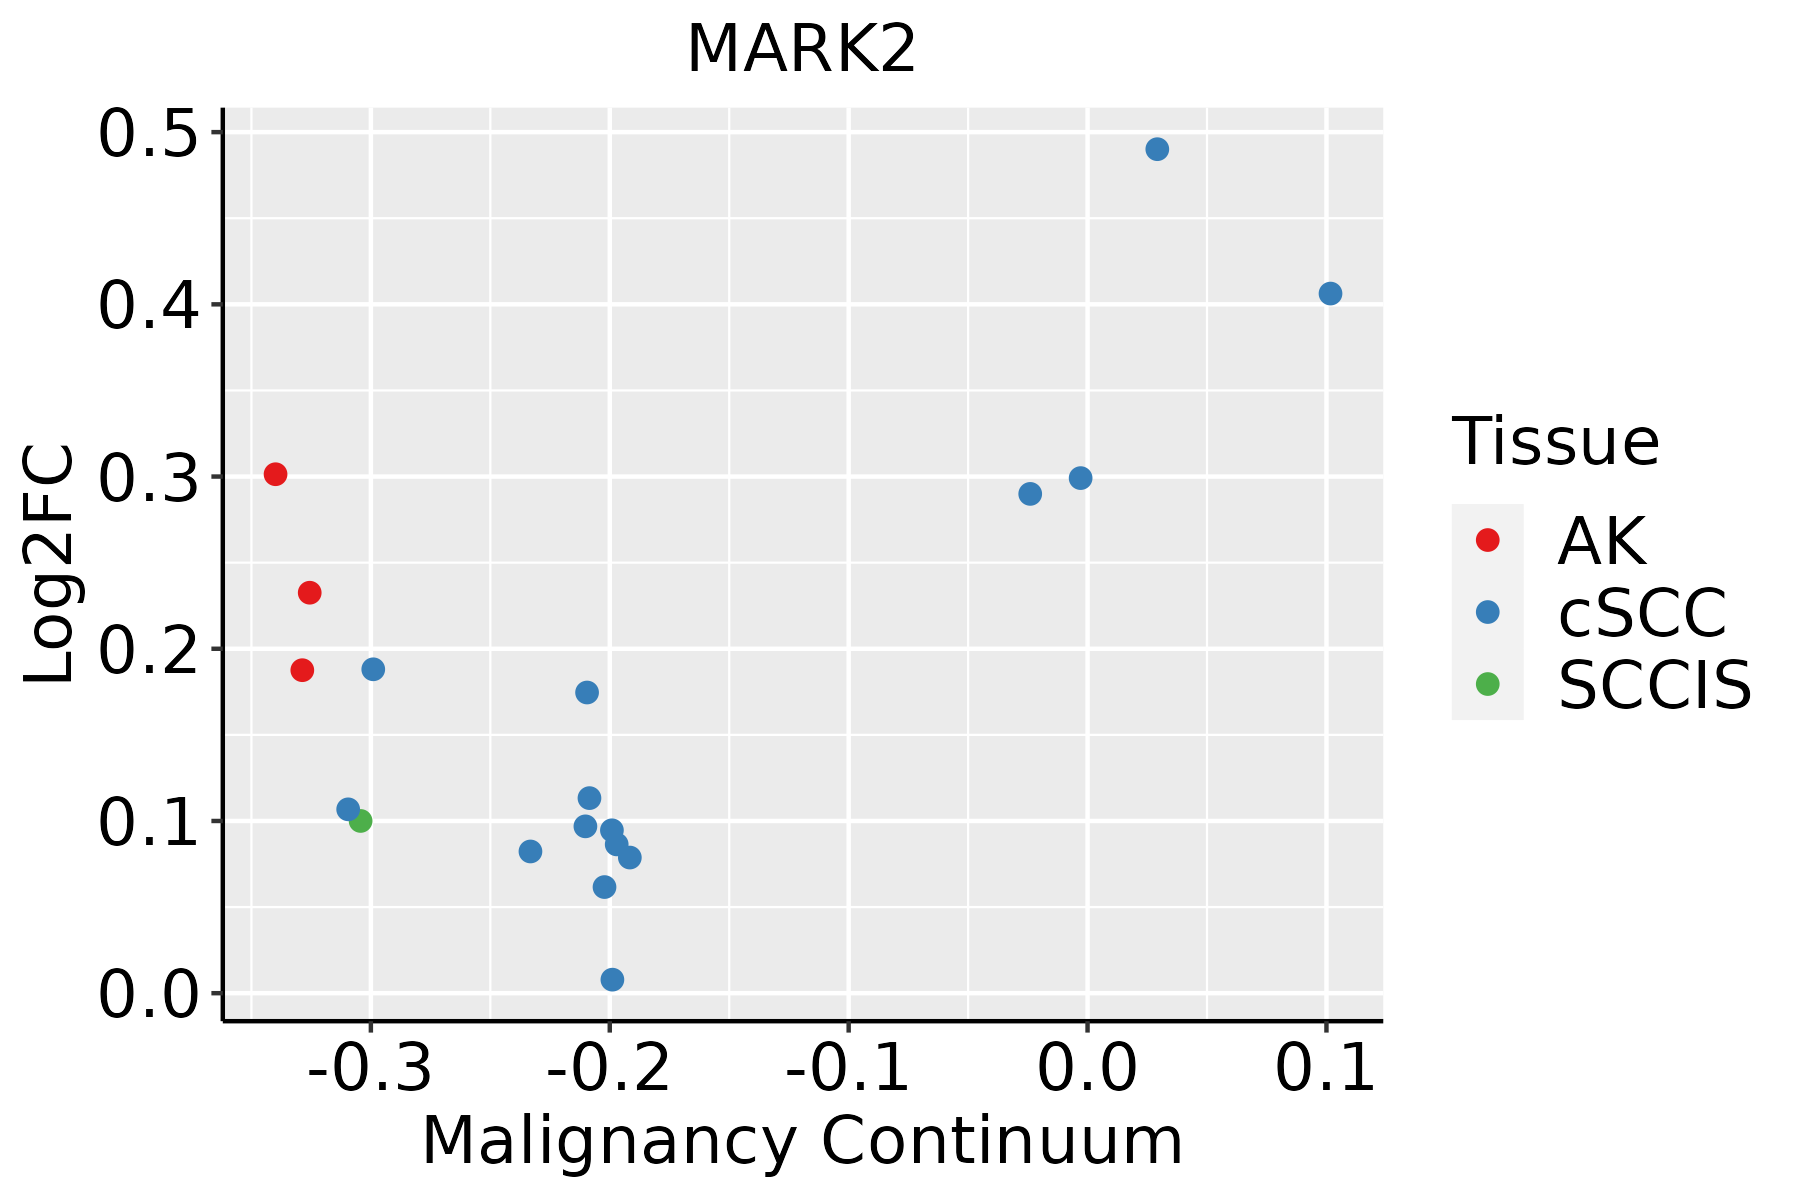
AK: Actinic keratosis
cSCC: Cutaneous squamous cell carcinoma
SCCIS:squamous cell carcinoma in situ
ThyroidThe image shows the transcriptomic changes along malignancy continuum.log2FC in expression of this searched gene in stem-like cells from each diseased tissue sample relative to stem-like cells in normal samples in each tissue plotted against the malignancy continuum. Samples are colored based on if they are from different disease stage.
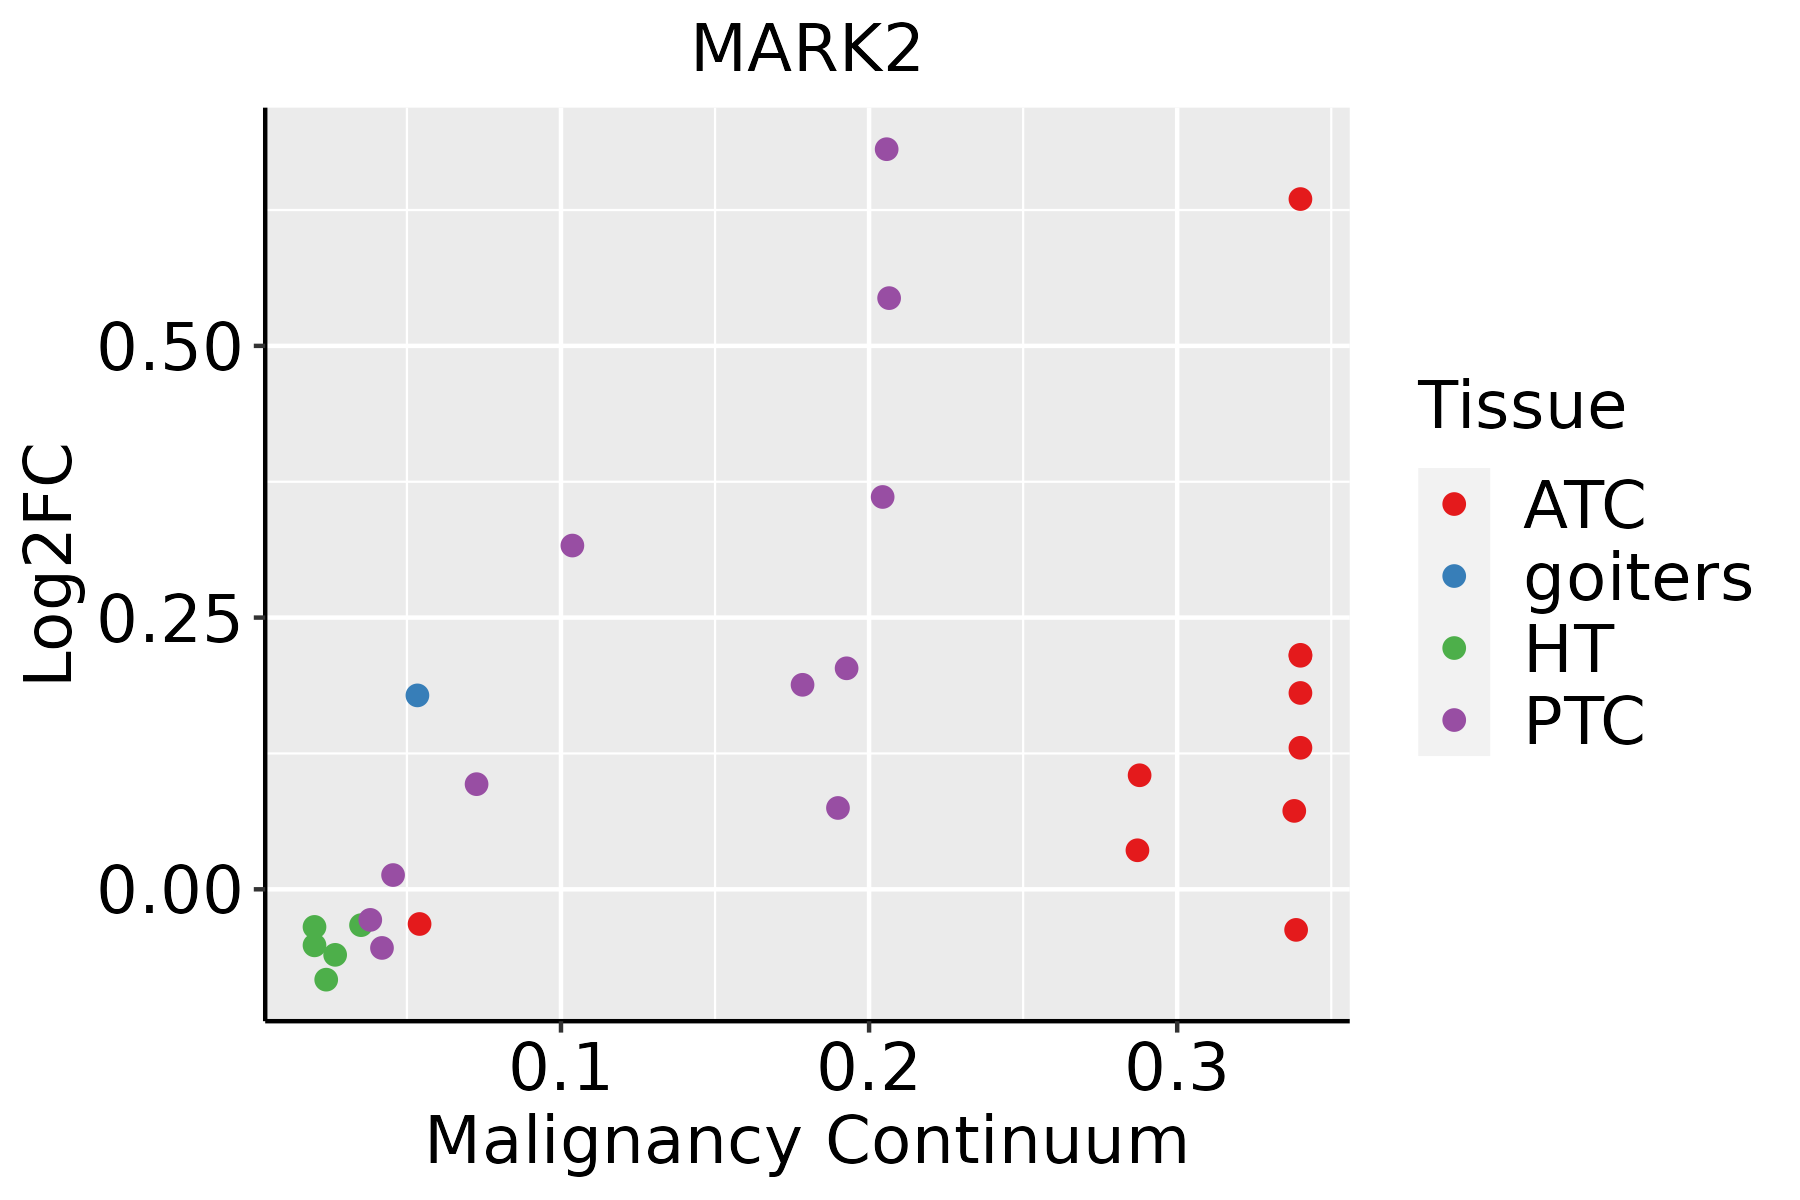
ATC: Anaplastic thyroid cancer
HT: Hashimoto's thyroiditis
PTC: Papillary thyroid cancer
∗log2FC in expression of this searched gene in stem-like cells from each diseased tissue sample relative to stem-like cells in normal samples in each tissue plotted against the malignancy continuum. Samples are colored based on if they are from different disease stage.

Top

Malignant transformation related pathway analysis

check buttonFind out the enriched GO biological processes and KEGG pathways involved in transition from healthy to precancer to cancer
check button Figure of enriched GO biological processes.
TissueDisease StageEnriched GO biological Processes
ColorectumADGO analysis - Figure of enriched GO biological processes: Top 15 enriched GO BP terms are showed in the bar plot of each disease state in each tissue. Each row represents a significant GO biological process which is colored according to the -log10(p.adjust).
ColorectumSERGO analysis - Figure of enriched GO biological processes: Top 15 enriched GO BP terms are showed in the bar plot of each disease state in each tissue. Each row represents a significant GO biological process which is colored according to the -log10(p.adjust).
ColorectumMSSGO analysis - Figure of enriched GO biological processes: Top 15 enriched GO BP terms are showed in the bar plot of each disease state in each tissue. Each row represents a significant GO biological process which is colored according to the -log10(p.adjust).
ColorectumMSI-HGO analysis - Figure of enriched GO biological processes: Top 15 enriched GO BP terms are showed in the bar plot of each disease state in each tissue. Each row represents a significant GO biological process which is colored according to the -log10(p.adjust).
ColorectumFAPGO analysis - Figure of enriched GO biological processes: Top 15 enriched GO BP terms are showed in the bar plot of each disease state in each tissue. Each row represents a significant GO biological process which is colored according to the -log10(p.adjust).
∗Top 15 enriched GO BP terms are showed in the bar plot of each disease state in each tissue. Each row represents a significant GO biological process which is colored according to the -log10(p.adjust).
Page: 1 2 3 4 5 6 7 8 9 

check button Enriched GO biological processes.
GO IDTissueDisease StageDescriptionGene RatioBg Ratiopvaluep.adjustCount
GO:001820917ThyroidATCpeptidyl-serine modification161/6293338/187235.23e-089.44e-07161
GO:003367427ThyroidATCpositive regulation of kinase activity212/6293467/187235.89e-081.05e-06212
GO:0030010111ThyroidATCestablishment of cell polarity79/6293143/187238.08e-081.40e-0679
GO:004677717ThyroidATCprotein autophosphorylation114/6293227/187231.54e-072.49e-06114
GO:005077011ThyroidATCregulation of axonogenesis80/6293154/187231.95e-062.34e-0580
GO:001810718ThyroidATCpeptidyl-threonine phosphorylation63/6293116/187233.47e-063.89e-0563
GO:003288613ThyroidATCregulation of microtubule-based process114/6293240/187235.17e-065.59e-05114
GO:001821018ThyroidATCpeptidyl-threonine modification66/6293125/187237.36e-067.56e-0566
GO:001097614ThyroidATCpositive regulation of neuron projection development82/6293163/187237.43e-067.61e-0582
GO:003214711ThyroidATCactivation of protein kinase activity65/6293134/187232.44e-041.57e-0365
GO:003508815ThyroidATCestablishment or maintenance of apical/basal cell polarity27/629349/187231.58e-037.99e-0327
GO:006124515ThyroidATCestablishment or maintenance of bipolar cell polarity27/629349/187231.58e-037.99e-0327
GO:004519715ThyroidATCestablishment or maintenance of epithelial cell apical/basal polarity24/629344/187233.39e-031.52e-0224
GO:005164612ThyroidATCmitochondrion localization25/629350/187231.20e-024.27e-0225
Page: 1 2 3 4 5 6 7 8 9 10 11 12 13 14 15 16 17 

check button Enriched KEGG pathways.
Pathway IDTissueDisease StageDescriptionGene RatioBg Ratiopvaluep.adjustqvalueCount
Page: 1 

Top

Cell-cell communication analysis

check buttonIdentification of potential cell-cell interactions between two cell types and their ligand-receptor pairs for different disease states
LigandReceptorLRpairPathwayTissueDisease Stage
Page: 1 

Top

Single-cell gene regulatory network inference analysis

check buttonFind out the significant the regulons (TFs) and the target genes of each regulon across cell types for different disease states
TFCell TypeTissueDisease StageTarget GeneRSSRegulon Activity
∗The dot plots of a searched regulon are shown for all cell subpopulations in each disease state of each tissue based on the regulon specific score inferred using pySCENIC and by calculating the average expression.
Page: 1 

Top

Somatic mutation of malignant transformation related genes

check buttonAnnotation of somatic variants for genes involved in malignant transformation
Hugo SymbolVariant ClassVariant ClassificationdbSNP RSHGVScHGVSpHGVSp ShortSWISSPROTBIOTYPESIFTPolyPhenTumor Sample BarcodeTissueHistologySexAgeStageTherapy TypesDrugsOutcome
MARK2SNVMissense_Mutationc.2144N>Ap.Arg715Hisp.R715HQ7KZI7protein_codingdeleterious(0)probably_damaging(0.915)TCGA-A7-A6VX-01Breastbreast invasive carcinomaFemale>=65I/IIChemotherapydocetaxelCR
MARK2SNVMissense_Mutationc.2050G>Cp.Glu684Glnp.E684QQ7KZI7protein_codingtolerated(0.08)benign(0)TCGA-AC-A23H-01Breastbreast invasive carcinomaFemale>=65I/IIUnknownUnknownPD
MARK2SNVMissense_Mutationnovelc.1312G>Cp.Glu438Glnp.E438QQ7KZI7protein_codingtolerated(0.23)benign(0.018)TCGA-AC-A5XS-01Breastbreast invasive carcinomaFemale>=65I/IIHormone TherapyfemaraSD
MARK2SNVMissense_Mutationc.1075C>Ap.Leu359Metp.L359MQ7KZI7protein_codingdeleterious(0.01)possibly_damaging(0.654)TCGA-B6-A0IK-01Breastbreast invasive carcinomaFemale<65III/IVUnknownUnknownPD
MARK2SNVMissense_Mutationc.316N>Cp.Val106Leup.V106LQ7KZI7protein_codingtolerated(0.79)benign(0)TCGA-BH-A18Q-01Breastbreast invasive carcinomaFemale<65I/IIUnknownUnknownSD
MARK2SNVMissense_Mutationrs368859674c.1307N>Ap.Arg436Glnp.R436QQ7KZI7protein_codingtolerated(0.79)benign(0.007)TCGA-D8-A1Y1-01Breastbreast invasive carcinomaFemale>=65III/IVHormone TherapytamoxiphenPD
MARK2SNVMissense_Mutationrs199684279c.905N>Ap.Arg302Glnp.R302QQ7KZI7protein_codingdeleterious(0)possibly_damaging(0.606)TCGA-XX-A899-01Breastbreast invasive carcinomaFemale<65III/IVChemotherapycytoxanCR
MARK2insertionNonsense_Mutationnovelc.908_909insCCCCAGAACTCTTCCAGGGCAAAAAATATGATGGACCCp.Trp303CysfsTer11p.W303Cfs*11Q7KZI7protein_codingTCGA-AO-A0JB-01Breastbreast invasive carcinomaFemale<65III/IVChemotherapycyclophosphamideSD
MARK2insertionFrame_Shift_Insnovelc.876_877insTCCTCTCp.Gly293SerfsTer21p.G293Sfs*21Q7KZI7protein_codingTCGA-B6-A0IK-01Breastbreast invasive carcinomaFemale<65III/IVUnknownUnknownPD
MARK2insertionNonsense_Mutationnovelc.879_880insCTCTGGTCTTAGCCCTGACCTCCTGCCTTTGCCp.Gly293_Thr294insLeuTrpSerTerProTerProProAlaPheAlap.G293_T294insLWS*P*PPAFAQ7KZI7protein_codingTCGA-B6-A0IK-01Breastbreast invasive carcinomaFemale<65III/IVUnknownUnknownPD
Page: 1 2 3 4 5 6 7 8 9 10 11 

Top

Related drugs of malignant transformation related genes

check buttonIdentification of chemicals and drugs interact with genes involved in malignant transfromation
(DGIdb 4.0)
Entrez IDSymbolCategoryInteraction TypesDrug Claim NameDrug NamePMIDs
2011MARK2KINASE, SERINE THREONINE KINASE, DRUGGABLE GENOME, ENZYMETOZASERTIBTOZASERTIB
2011MARK2KINASE, SERINE THREONINE KINASE, DRUGGABLE GENOME, ENZYMELINIFANIBLINIFANIB
2011MARK2KINASE, SERINE THREONINE KINASE, DRUGGABLE GENOME, ENZYMEDOVITINIBDOVITINIB
2011MARK2KINASE, SERINE THREONINE KINASE, DRUGGABLE GENOME, ENZYMEGSK-269962AGSK-269962A
2011MARK2KINASE, SERINE THREONINE KINASE, DRUGGABLE GENOME, ENZYMETYROSINE KINASE INHIBITORS15811957
2011MARK2KINASE, SERINE THREONINE KINASE, DRUGGABLE GENOME, ENZYMEGNF-PF-2301CHEMBL578061
2011MARK2KINASE, SERINE THREONINE KINASE, DRUGGABLE GENOME, ENZYMEKENPAULLONEKENPAULLONE
2011MARK2KINASE, SERINE THREONINE KINASE, DRUGGABLE GENOME, ENZYMECENISERTIBCENISERTIB
2011MARK2KINASE, SERINE THREONINE KINASE, DRUGGABLE GENOME, ENZYMEALSTERPAULLONEALSTERPAULLONE
2011MARK2KINASE, SERINE THREONINE KINASE, DRUGGABLE GENOME, ENZYMEAZD-1080AZD-1080
Page: 1 2