
|
|||||
|
 | |
| |
| |
| |
| |
| |
|
Gene: KMT2E |
Gene summary for KMT2E |
| Gene information | Species | Human | Gene symbol | KMT2E | Gene ID | 55904 |
| Gene name | lysine methyltransferase 2E (inactive) | |
| Gene Alias | HDCMC04P | |
| Cytomap | 7q22.3 | |
| Gene Type | protein-coding | GO ID | GO:0000082 | UniProtAcc | Q8IZD2 |
Top |
Malignant transformation analysis |
| Identification of the aberrant gene expression in precancerous and cancerous lesions by comparing the gene expression of stem-like cells in diseased tissues with normal stem cells |
| Entrez ID | Symbol | Replicates | Species | Organ | Tissue | Adj P-value | Log2FC | Malignancy |
| 55904 | KMT2E | CA_HPV_1 | Human | Cervix | CC | 2.94e-06 | -1.08e-01 | 0.0264 |
| 55904 | KMT2E | CCI_1 | Human | Cervix | CC | 7.00e-11 | 1.21e+00 | 0.528 |
| 55904 | KMT2E | CCI_2 | Human | Cervix | CC | 6.58e-09 | 6.02e-01 | 0.5249 |
| 55904 | KMT2E | CCI_3 | Human | Cervix | CC | 2.82e-09 | 9.36e-01 | 0.516 |
| 55904 | KMT2E | L1 | Human | Cervix | CC | 1.11e-09 | -2.69e-01 | 0.0802 |
| 55904 | KMT2E | T1 | Human | Cervix | CC | 6.15e-04 | -2.86e-01 | 0.0918 |
| 55904 | KMT2E | HTA11_3410_2000001011 | Human | Colorectum | AD | 3.05e-37 | -7.32e-01 | 0.0155 |
| 55904 | KMT2E | HTA11_347_2000001011 | Human | Colorectum | AD | 3.89e-10 | 5.40e-01 | -0.1954 |
| 55904 | KMT2E | HTA11_8622_2000001021 | Human | Colorectum | SER | 7.13e-04 | -5.32e-01 | 0.0528 |
| 55904 | KMT2E | HTA11_11156_2000001011 | Human | Colorectum | AD | 4.05e-04 | -7.02e-01 | 0.0397 |
| 55904 | KMT2E | HTA11_99999970781_79442 | Human | Colorectum | MSS | 1.67e-04 | -3.97e-01 | 0.294 |
| 55904 | KMT2E | HTA11_99999965104_69814 | Human | Colorectum | MSS | 1.08e-03 | 4.74e-01 | 0.281 |
| 55904 | KMT2E | HTA11_99999974143_84620 | Human | Colorectum | MSS | 8.11e-17 | -5.70e-01 | 0.3005 |
| 55904 | KMT2E | F007 | Human | Colorectum | FAP | 4.39e-02 | -1.69e-01 | 0.1176 |
| 55904 | KMT2E | A001-C-207 | Human | Colorectum | FAP | 1.10e-08 | -4.29e-01 | 0.1278 |
| 55904 | KMT2E | A015-C-203 | Human | Colorectum | FAP | 1.79e-32 | -2.67e-01 | -0.1294 |
| 55904 | KMT2E | A015-C-204 | Human | Colorectum | FAP | 3.51e-05 | -2.22e-01 | -0.0228 |
| 55904 | KMT2E | A014-C-040 | Human | Colorectum | FAP | 1.08e-06 | -1.96e-01 | -0.1184 |
| 55904 | KMT2E | A002-C-201 | Human | Colorectum | FAP | 8.47e-19 | -3.73e-01 | 0.0324 |
| 55904 | KMT2E | A001-C-119 | Human | Colorectum | FAP | 1.31e-08 | -5.88e-02 | -0.1557 |
| Page: 1 2 3 4 5 6 7 8 9 10 11 12 |
| Tissue | Expression Dynamics | Abbreviation |
| Cervix | 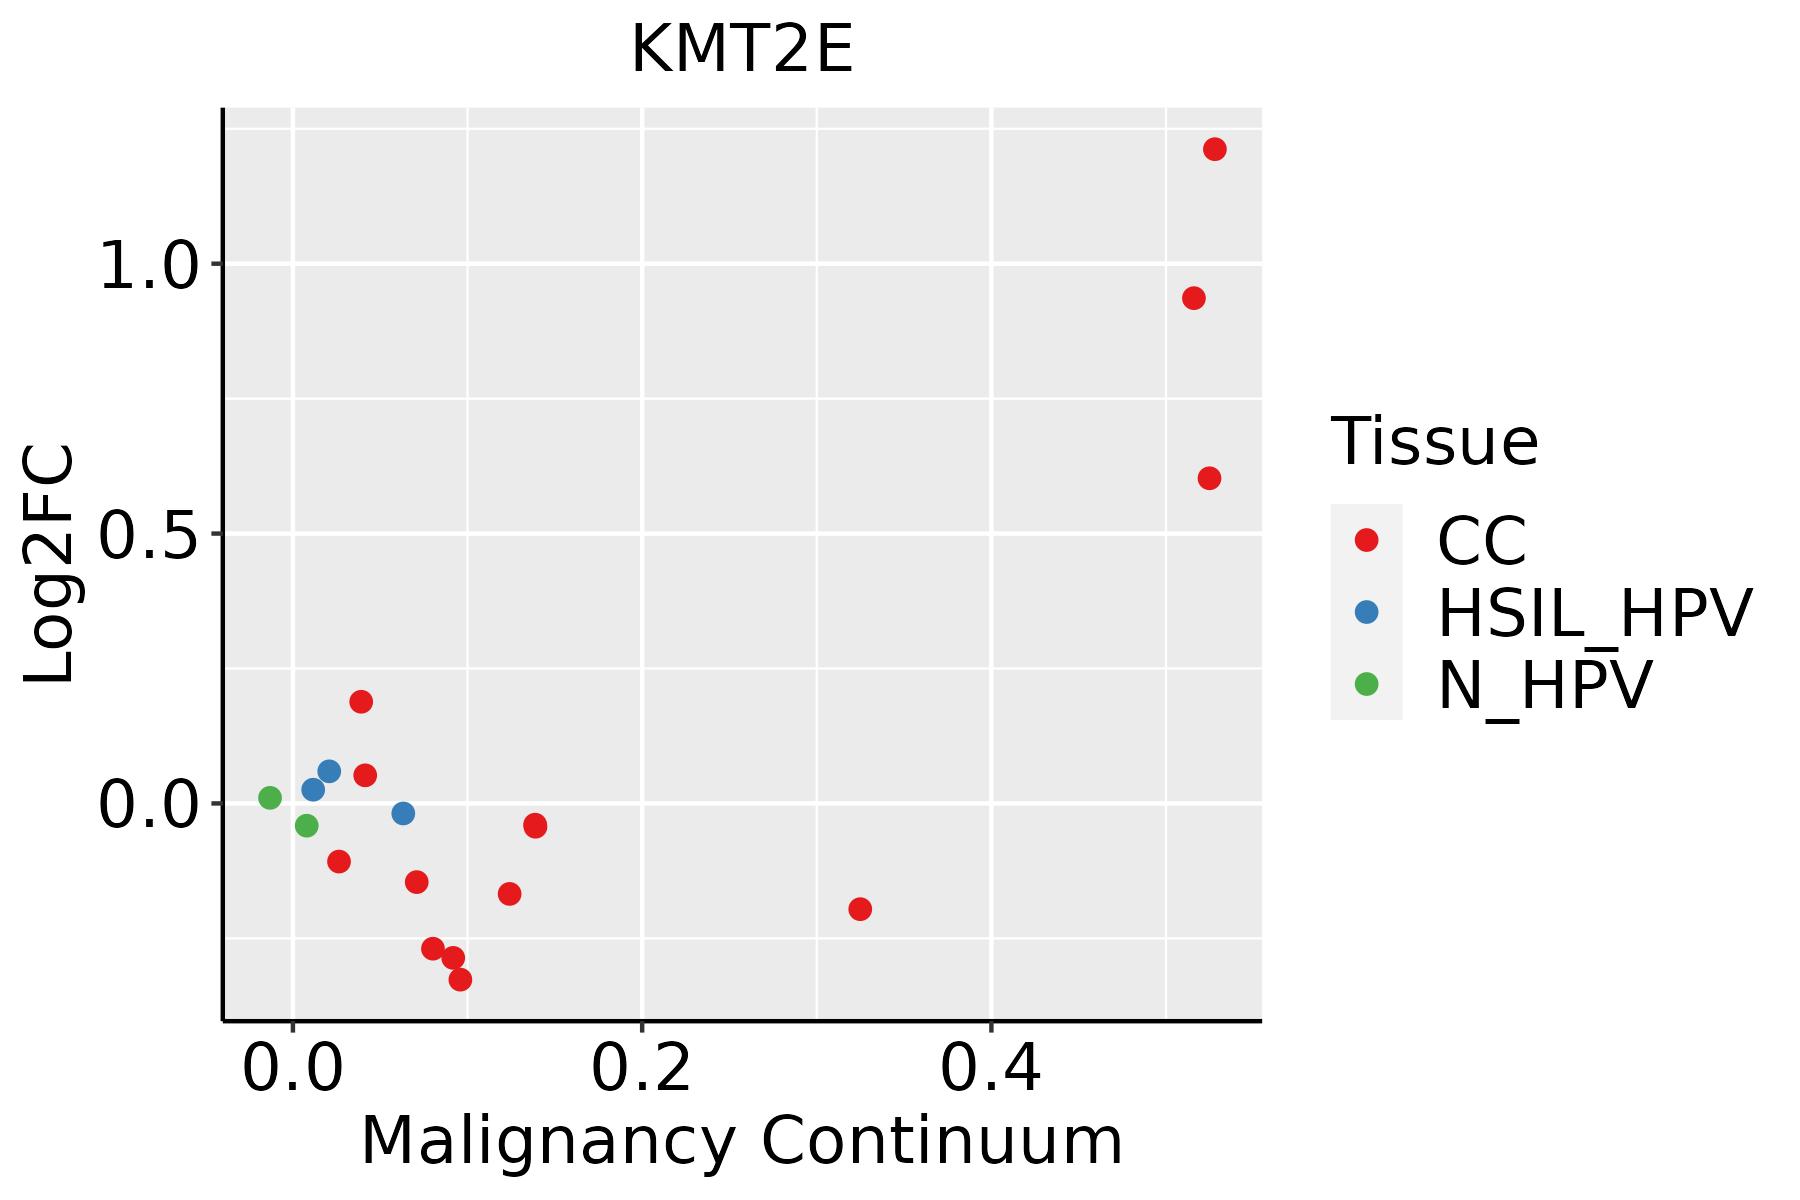 | CC: Cervix cancer |
| HSIL_HPV: HPV-infected high-grade squamous intraepithelial lesions | ||
| N_HPV: HPV-infected normal cervix | ||
| Colorectum (GSE201348) |  | FAP: Familial adenomatous polyposis |
| CRC: Colorectal cancer | ||
| Colorectum (HTA11) |  | AD: Adenomas |
| SER: Sessile serrated lesions | ||
| MSI-H: Microsatellite-high colorectal cancer | ||
| MSS: Microsatellite stable colorectal cancer | ||
| Esophagus |  | ESCC: Esophageal squamous cell carcinoma |
| HGIN: High-grade intraepithelial neoplasias | ||
| LGIN: Low-grade intraepithelial neoplasias | ||
| Liver | 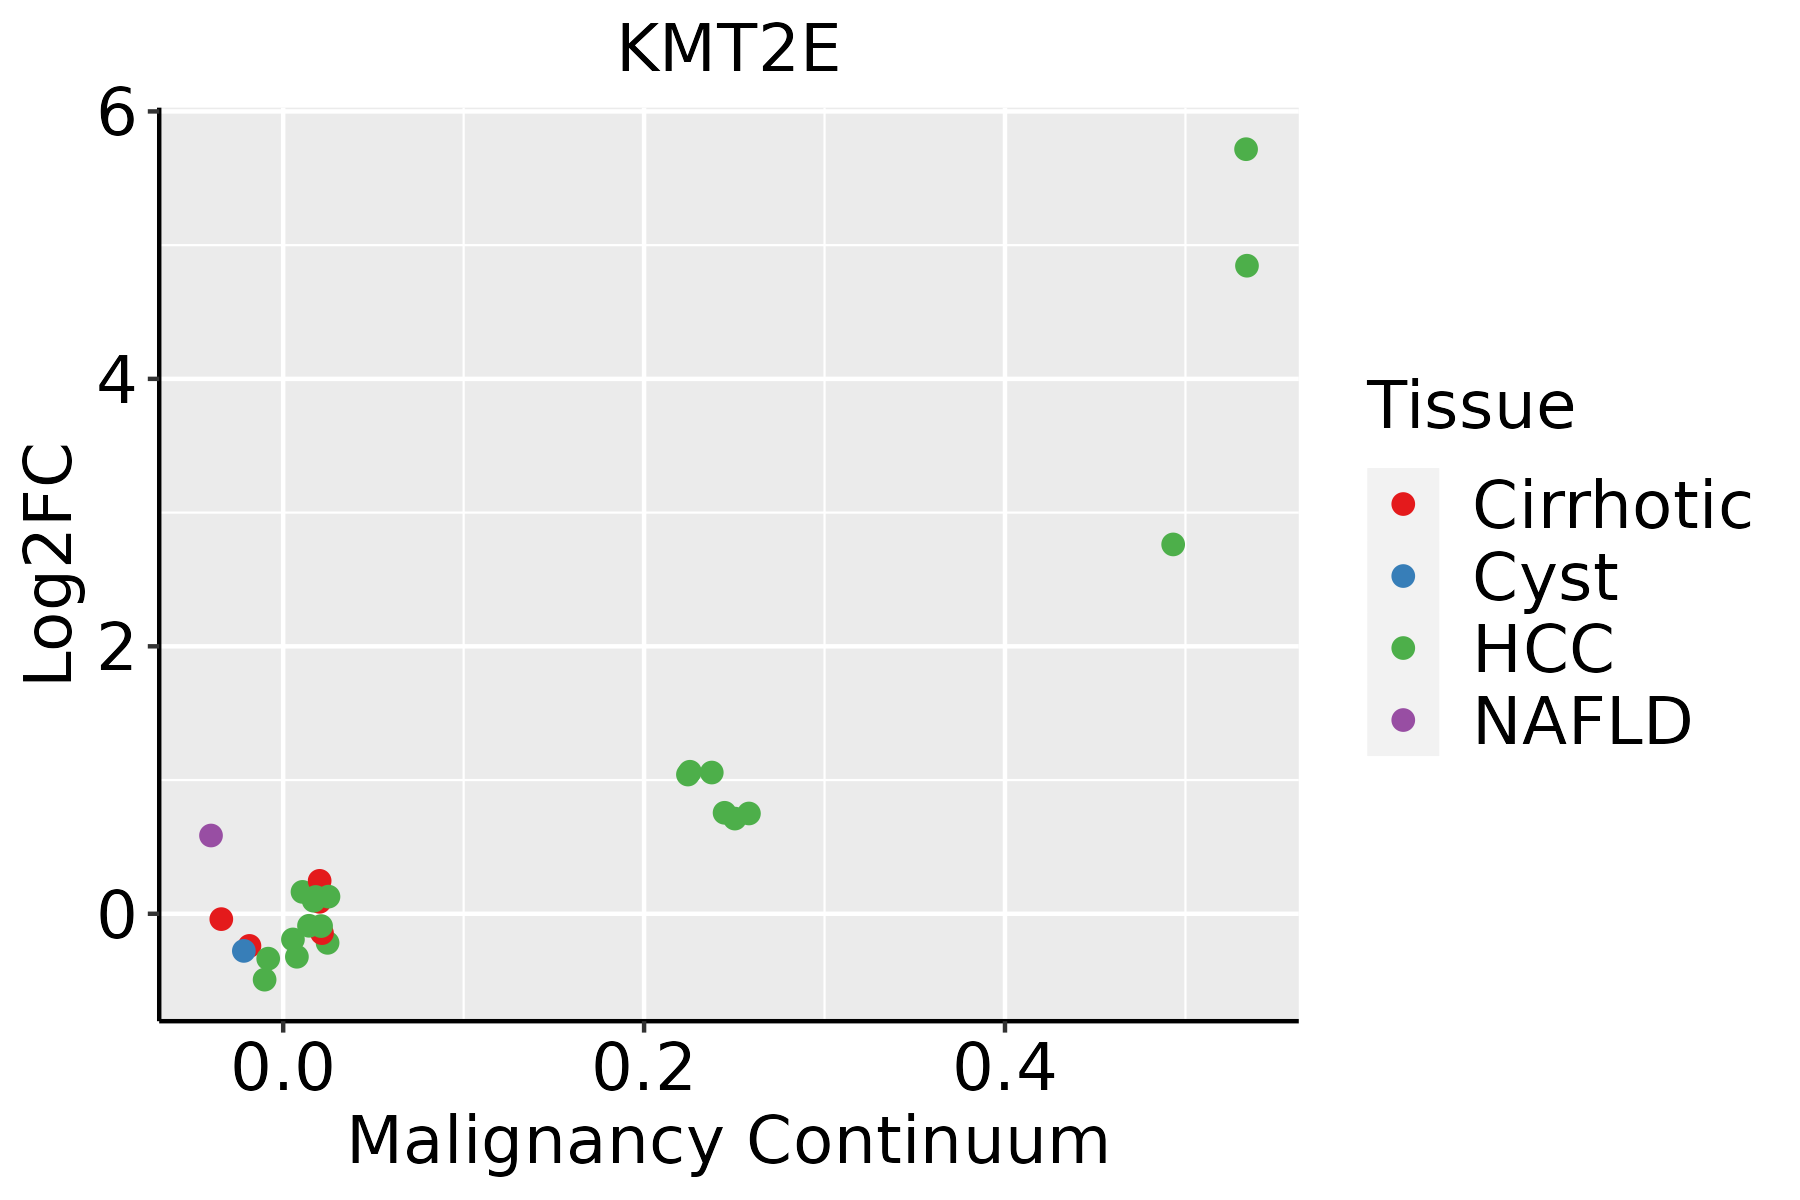 | HCC: Hepatocellular carcinoma |
| NAFLD: Non-alcoholic fatty liver disease | ||
| Lung | 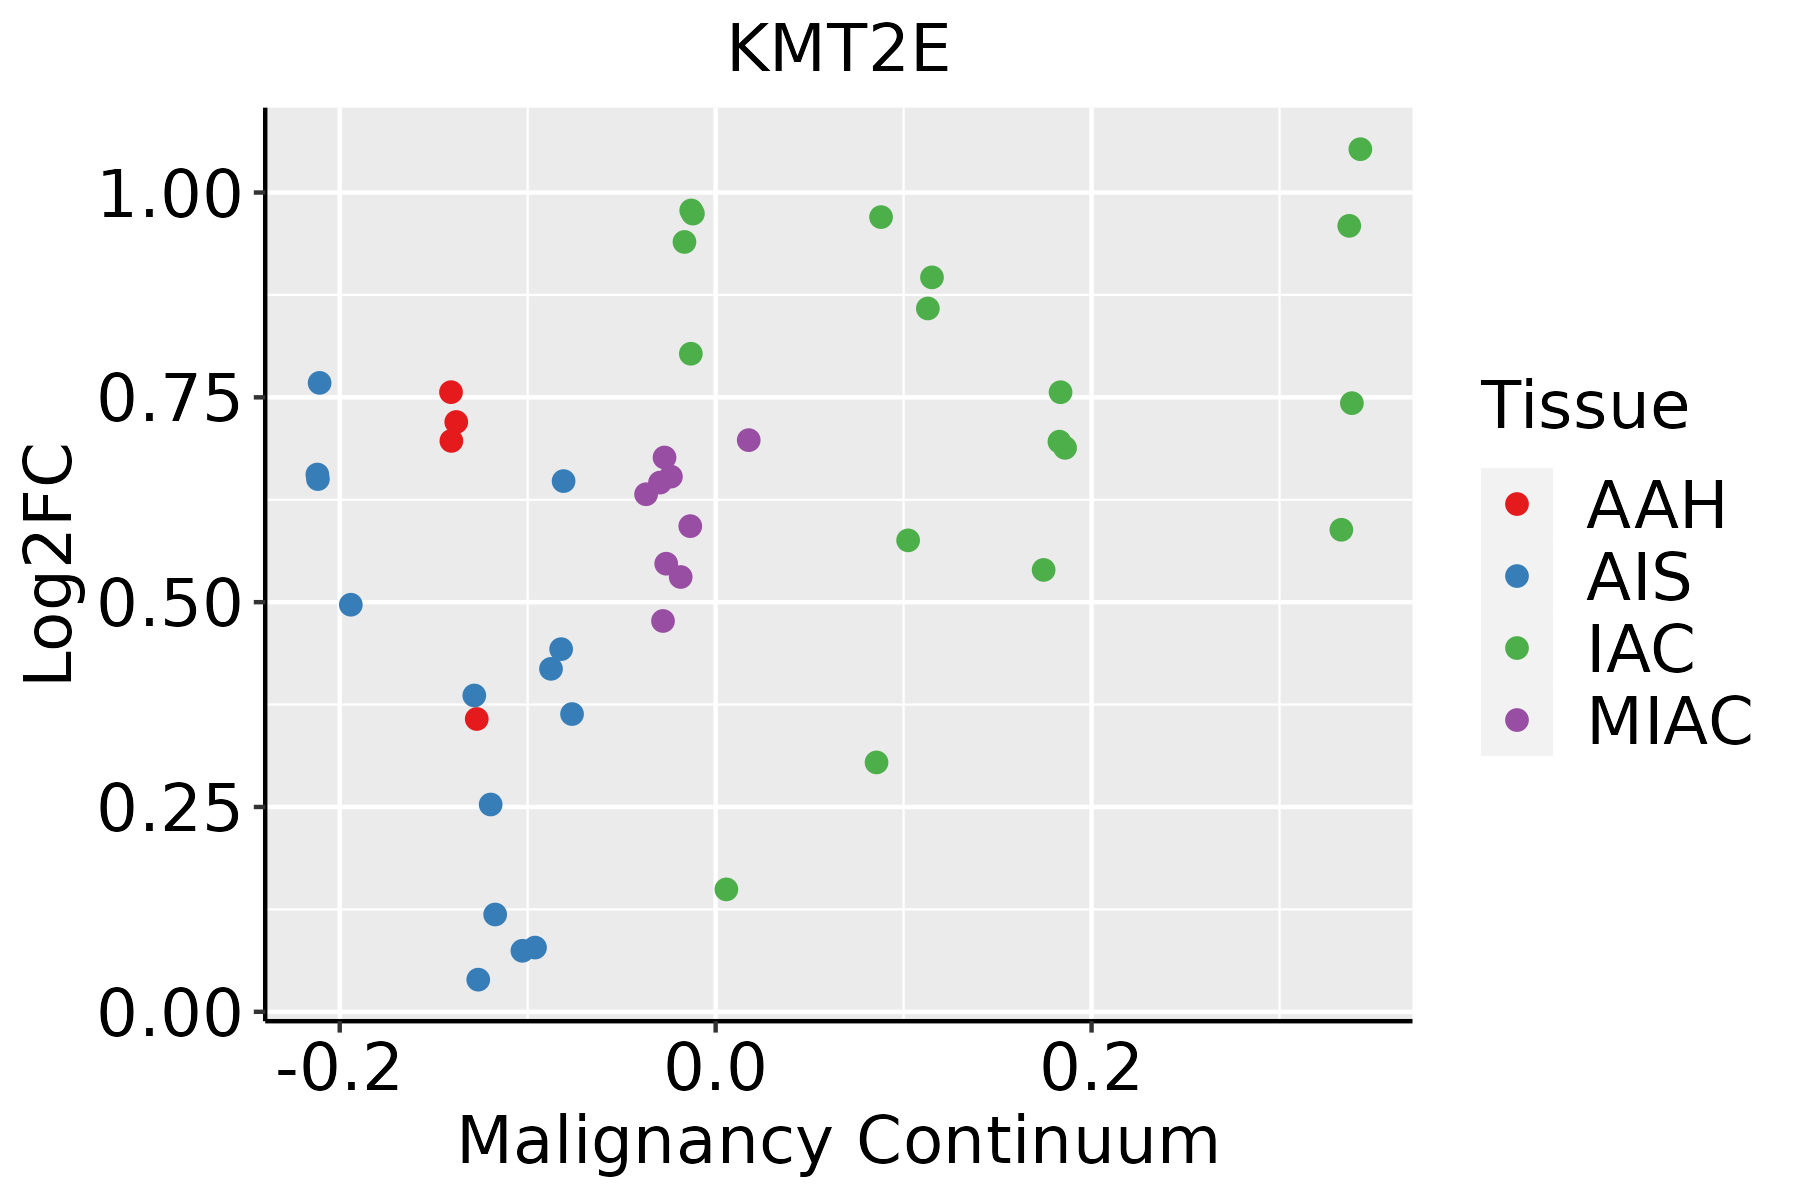 | AAH: Atypical adenomatous hyperplasia |
| AIS: Adenocarcinoma in situ | ||
| IAC: Invasive lung adenocarcinoma | ||
| MIA: Minimally invasive adenocarcinoma | ||
| Oral Cavity | 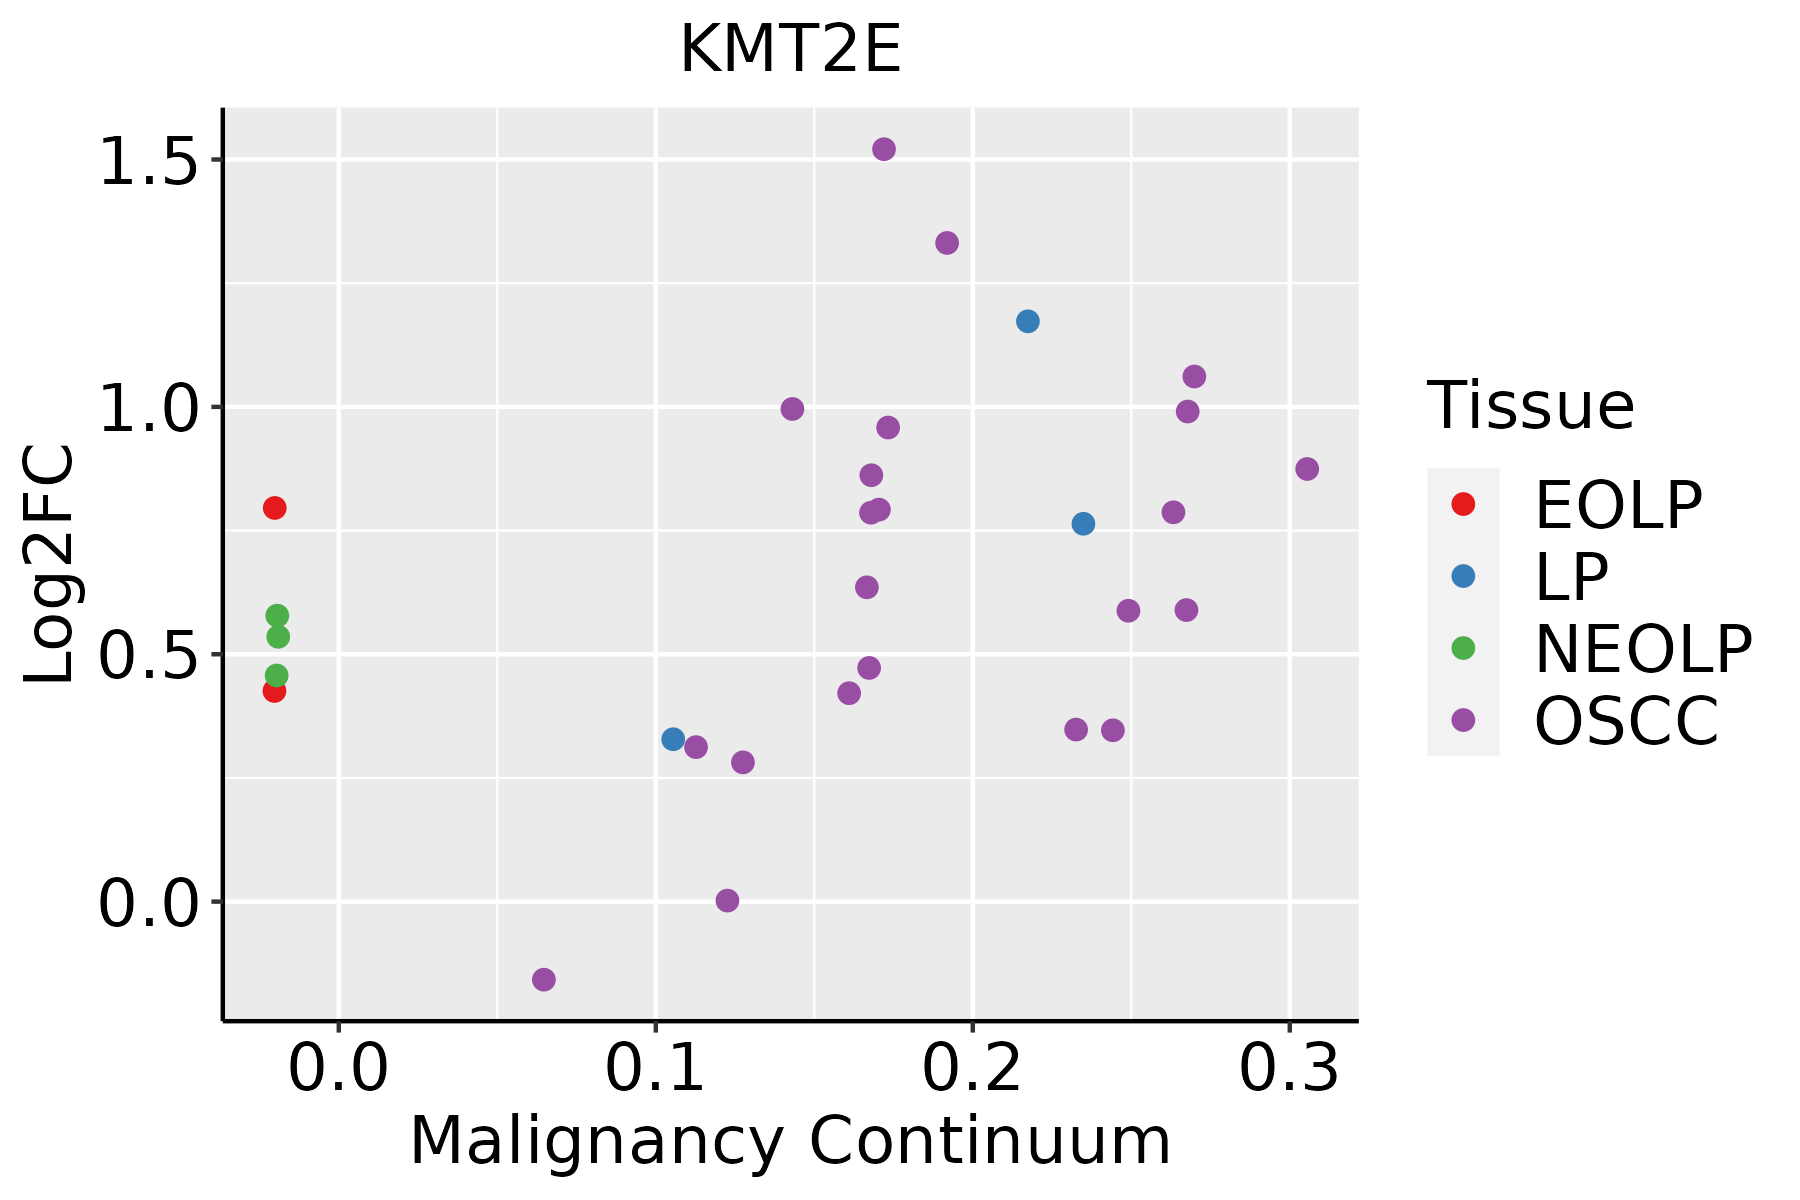 | EOLP: Erosive Oral lichen planus |
| LP: leukoplakia | ||
| NEOLP: Non-erosive oral lichen planus | ||
| OSCC: Oral squamous cell carcinoma | ||
| Prostate | 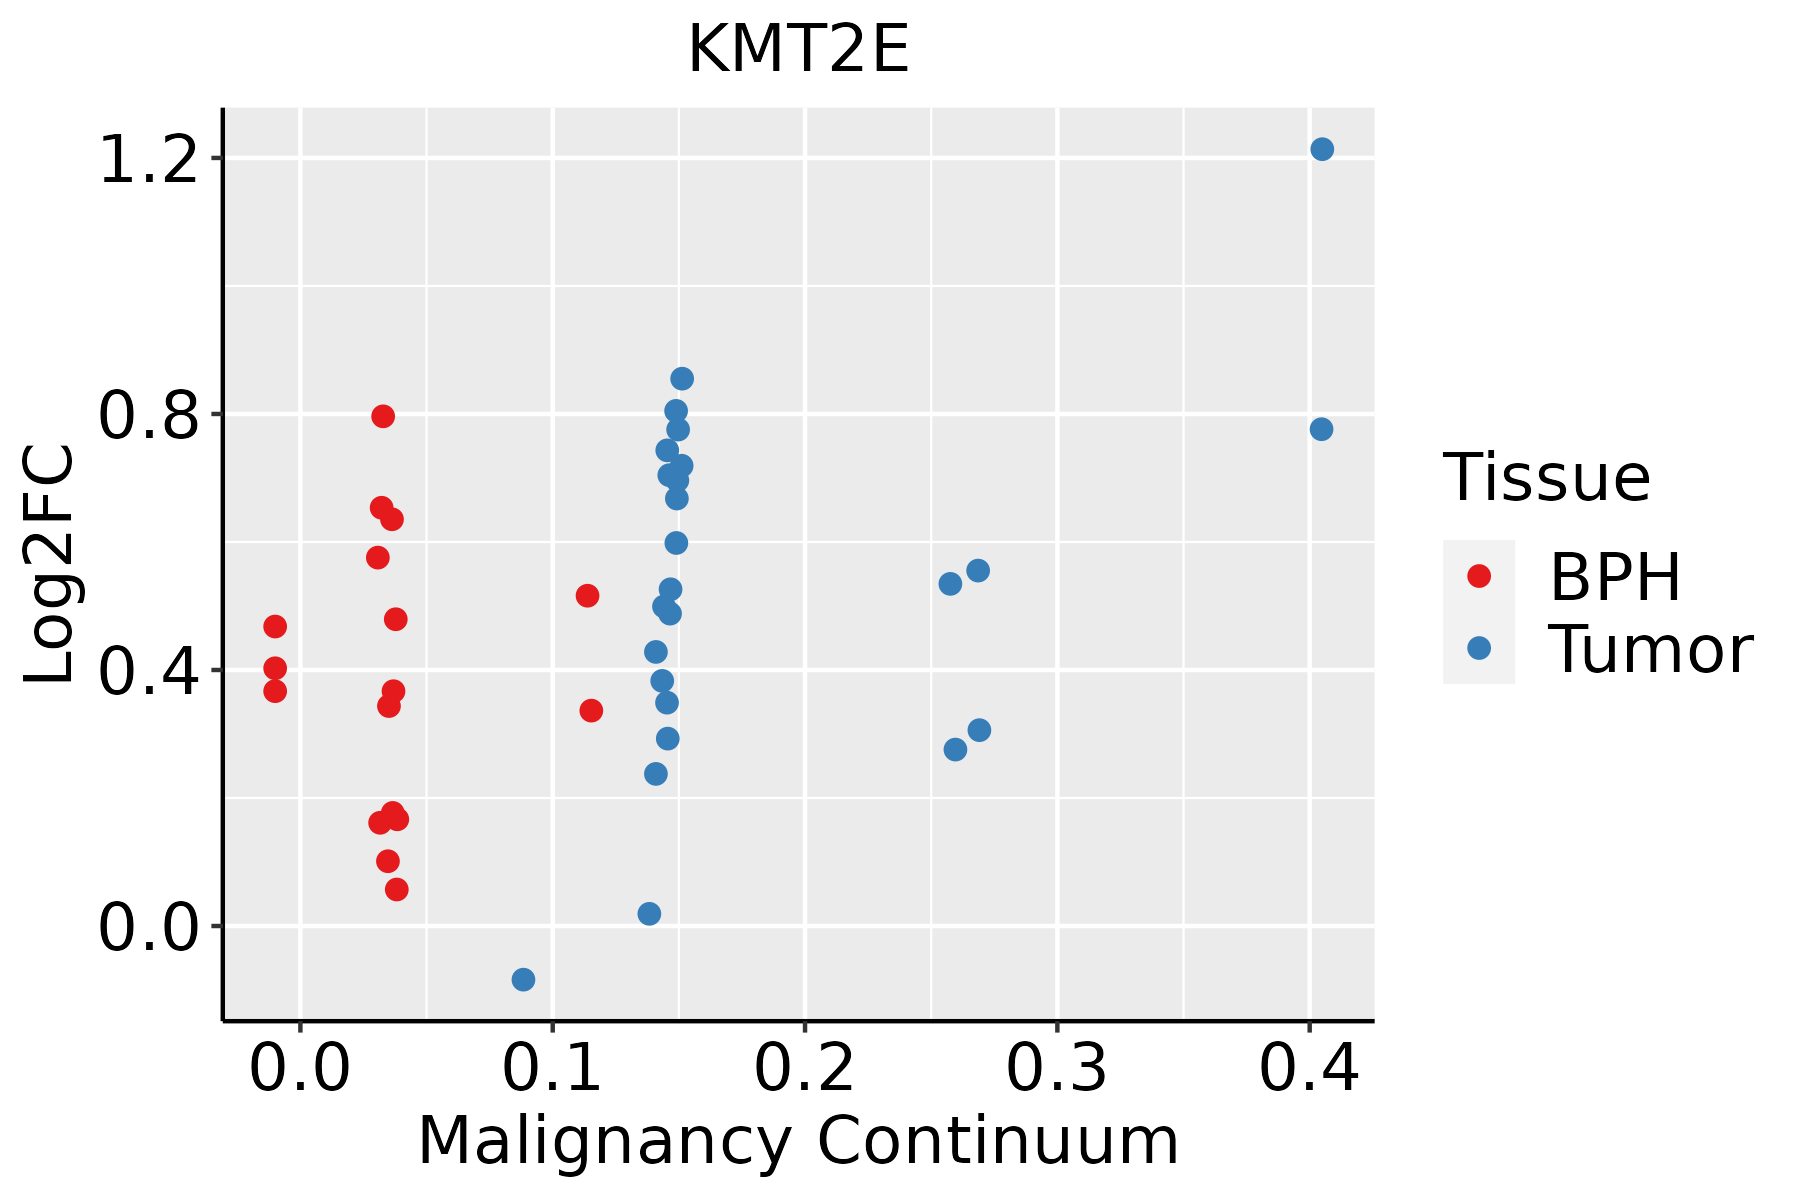 | BPH: Benign Prostatic Hyperplasia |
| Skin |  | AK: Actinic keratosis |
| cSCC: Cutaneous squamous cell carcinoma | ||
| SCCIS:squamous cell carcinoma in situ | ||
| Thyroid | 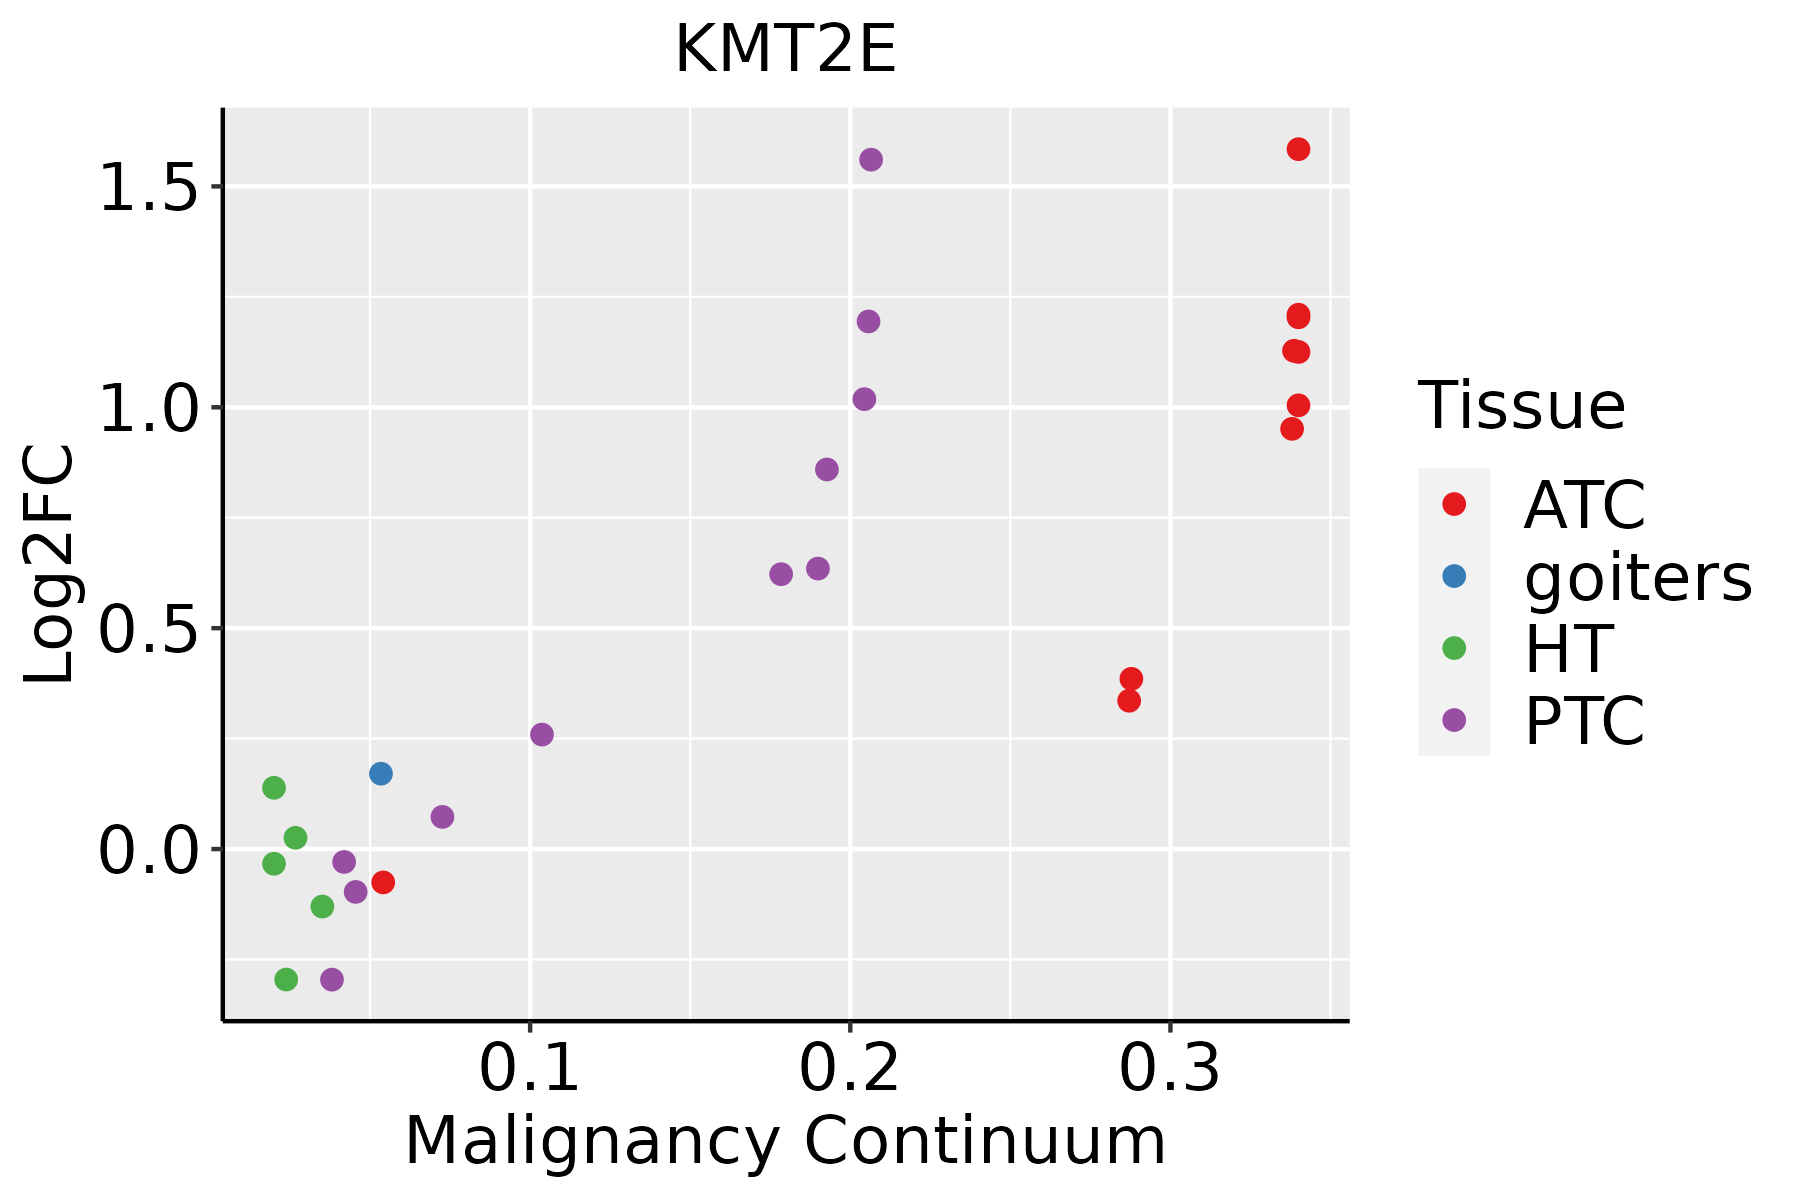 | ATC: Anaplastic thyroid cancer |
| HT: Hashimoto's thyroiditis | ||
| PTC: Papillary thyroid cancer |
| ∗log2FC in expression of this searched gene in stem-like cells from each diseased tissue sample relative to stem-like cells in normal samples in each tissue plotted against the malignancy continuum. Samples are colored based on if they are from different disease stage. |
Top |
Malignant transformation related pathway analysis |
| Find out the enriched GO biological processes and KEGG pathways involved in transition from healthy to precancer to cancer |
| Tissue | Disease Stage | Enriched GO biological Processes |
| Colorectum | AD |  |
| Colorectum | SER |  |
| Colorectum | MSS |  |
| Colorectum | MSI-H |  |
| Colorectum | FAP |  |
| ∗Top 15 enriched GO BP terms are showed in the bar plot of each disease state in each tissue. Each row represents a significant GO biological process which is colored according to the -log10(p.adjust). |
| Page: 1 2 3 4 5 6 7 8 9 |
| GO ID | Tissue | Disease Stage | Description | Gene Ratio | Bg Ratio | pvalue | p.adjust | Count |
| GO:004477215 | Oral cavity | LP | mitotic cell cycle phase transition | 150/4623 | 424/18723 | 4.38e-07 | 1.23e-05 | 150 |
| GO:0030099110 | Oral cavity | LP | myeloid cell differentiation | 130/4623 | 381/18723 | 1.94e-05 | 3.27e-04 | 130 |
| GO:000008213 | Oral cavity | LP | G1/S transition of mitotic cell cycle | 80/4623 | 214/18723 | 2.30e-05 | 3.74e-04 | 80 |
| GO:004484313 | Oral cavity | LP | cell cycle G1/S phase transition | 88/4623 | 241/18723 | 2.62e-05 | 4.21e-04 | 88 |
| GO:001657014 | Oral cavity | LP | histone modification | 152/4623 | 463/18723 | 4.04e-05 | 5.90e-04 | 152 |
| GO:190199012 | Oral cavity | LP | regulation of mitotic cell cycle phase transition | 104/4623 | 299/18723 | 5.34e-05 | 7.41e-04 | 104 |
| GO:190198712 | Oral cavity | LP | regulation of cell cycle phase transition | 126/4623 | 390/18723 | 3.69e-04 | 3.64e-03 | 126 |
| GO:004593115 | Oral cavity | LP | positive regulation of mitotic cell cycle | 46/4623 | 121/18723 | 7.65e-04 | 6.80e-03 | 46 |
| GO:003105613 | Oral cavity | LP | regulation of histone modification | 55/4623 | 152/18723 | 1.01e-03 | 8.48e-03 | 55 |
| GO:00310581 | Oral cavity | LP | positive regulation of histone modification | 36/4623 | 92/18723 | 1.51e-03 | 1.18e-02 | 36 |
| GO:190280612 | Oral cavity | LP | regulation of cell cycle G1/S phase transition | 59/4623 | 168/18723 | 1.55e-03 | 1.20e-02 | 59 |
| GO:200004512 | Oral cavity | LP | regulation of G1/S transition of mitotic cell cycle | 51/4623 | 142/18723 | 1.81e-03 | 1.37e-02 | 51 |
| GO:0034101110 | Oral cavity | LP | erythrocyte homeostasis | 47/4623 | 129/18723 | 1.91e-03 | 1.43e-02 | 47 |
| GO:0002262110 | Oral cavity | LP | myeloid cell homeostasis | 55/4623 | 157/18723 | 2.33e-03 | 1.68e-02 | 55 |
| GO:190198912 | Oral cavity | LP | positive regulation of cell cycle phase transition | 42/4623 | 115/18723 | 3.06e-03 | 2.09e-02 | 42 |
| GO:0048872110 | Oral cavity | LP | homeostasis of number of cells | 87/4623 | 272/18723 | 3.75e-03 | 2.47e-02 | 87 |
| GO:0030218110 | Oral cavity | LP | erythrocyte differentiation | 43/4623 | 120/18723 | 4.13e-03 | 2.66e-02 | 43 |
| GO:190199211 | Oral cavity | LP | positive regulation of mitotic cell cycle phase transition | 34/4623 | 93/18723 | 7.08e-03 | 3.98e-02 | 34 |
| GO:004578715 | Oral cavity | LP | positive regulation of cell cycle | 96/4623 | 313/18723 | 9.08e-03 | 4.85e-02 | 96 |
| GO:003009926 | Oral cavity | EOLP | myeloid cell differentiation | 91/2218 | 381/18723 | 2.87e-11 | 4.15e-09 | 91 |
| Page: 1 2 3 4 5 6 7 8 9 10 11 12 13 14 15 16 17 18 19 20 21 22 23 24 25 26 27 28 29 30 |
| Pathway ID | Tissue | Disease Stage | Description | Gene Ratio | Bg Ratio | pvalue | p.adjust | qvalue | Count |
| hsa00310 | Colorectum | AD | Lysine degradation | 27/2092 | 63/8465 | 1.17e-03 | 7.75e-03 | 4.94e-03 | 27 |
| hsa003101 | Colorectum | AD | Lysine degradation | 27/2092 | 63/8465 | 1.17e-03 | 7.75e-03 | 4.94e-03 | 27 |
| hsa003102 | Colorectum | MSS | Lysine degradation | 24/1875 | 63/8465 | 2.94e-03 | 1.39e-02 | 8.50e-03 | 24 |
| hsa003103 | Colorectum | MSS | Lysine degradation | 24/1875 | 63/8465 | 2.94e-03 | 1.39e-02 | 8.50e-03 | 24 |
| hsa003104 | Colorectum | FAP | Lysine degradation | 23/1404 | 63/8465 | 1.04e-04 | 9.46e-04 | 5.76e-04 | 23 |
| hsa003105 | Colorectum | FAP | Lysine degradation | 23/1404 | 63/8465 | 1.04e-04 | 9.46e-04 | 5.76e-04 | 23 |
| hsa0031010 | Esophagus | ESCC | Lysine degradation | 41/4205 | 63/8465 | 9.63e-03 | 2.27e-02 | 1.16e-02 | 41 |
| hsa0031013 | Esophagus | ESCC | Lysine degradation | 41/4205 | 63/8465 | 9.63e-03 | 2.27e-02 | 1.16e-02 | 41 |
| hsa003108 | Liver | NAFLD | Lysine degradation | 21/1043 | 63/8465 | 1.09e-05 | 3.58e-04 | 2.89e-04 | 21 |
| hsa0031011 | Liver | NAFLD | Lysine degradation | 21/1043 | 63/8465 | 1.09e-05 | 3.58e-04 | 2.89e-04 | 21 |
| hsa0031021 | Liver | Cirrhotic | Lysine degradation | 29/2530 | 63/8465 | 4.81e-03 | 1.74e-02 | 1.07e-02 | 29 |
| hsa0031031 | Liver | Cirrhotic | Lysine degradation | 29/2530 | 63/8465 | 4.81e-03 | 1.74e-02 | 1.07e-02 | 29 |
| hsa0031041 | Liver | HCC | Lysine degradation | 47/4020 | 63/8465 | 1.02e-05 | 7.58e-05 | 4.22e-05 | 47 |
| hsa0031051 | Liver | HCC | Lysine degradation | 47/4020 | 63/8465 | 1.02e-05 | 7.58e-05 | 4.22e-05 | 47 |
| hsa003109 | Lung | IAC | Lysine degradation | 17/1053 | 63/8465 | 1.35e-03 | 8.63e-03 | 5.73e-03 | 17 |
| hsa0031012 | Lung | IAC | Lysine degradation | 17/1053 | 63/8465 | 1.35e-03 | 8.63e-03 | 5.73e-03 | 17 |
| hsa0031022 | Lung | AIS | Lysine degradation | 16/961 | 63/8465 | 1.41e-03 | 9.49e-03 | 6.07e-03 | 16 |
| hsa0031032 | Lung | AIS | Lysine degradation | 16/961 | 63/8465 | 1.41e-03 | 9.49e-03 | 6.07e-03 | 16 |
| hsa0031042 | Lung | MIAC | Lysine degradation | 10/507 | 63/8465 | 3.93e-03 | 3.18e-02 | 2.30e-02 | 10 |
| hsa0031052 | Lung | MIAC | Lysine degradation | 10/507 | 63/8465 | 3.93e-03 | 3.18e-02 | 2.30e-02 | 10 |
| Page: 1 |
Top |
Cell-cell communication analysis |
| Identification of potential cell-cell interactions between two cell types and their ligand-receptor pairs for different disease states |
| Ligand | Receptor | LRpair | Pathway | Tissue | Disease Stage |
| Page: 1 |
Top |
Single-cell gene regulatory network inference analysis |
| Find out the significant the regulons (TFs) and the target genes of each regulon across cell types for different disease states |
| TF | Cell Type | Tissue | Disease Stage | Target Gene | RSS | Regulon Activity |
| ∗The dot plots of a searched regulon are shown for all cell subpopulations in each disease state of each tissue based on the regulon specific score inferred using pySCENIC and by calculating the average expression. |
| Page: 1 |
Top |
Somatic mutation of malignant transformation related genes |
| Annotation of somatic variants for genes involved in malignant transformation |
| Hugo Symbol | Variant Class | Variant Classification | dbSNP RS | HGVSc | HGVSp | HGVSp Short | SWISSPROT | BIOTYPE | SIFT | PolyPhen | Tumor Sample Barcode | Tissue | Histology | Sex | Age | Stage | Therapy Types | Drugs | Outcome |
| KMT2E | SNV | Missense_Mutation | novel | c.3046G>C | p.Glu1016Gln | p.E1016Q | Q8IZD2 | protein_coding | tolerated_low_confidence(0.09) | benign(0.398) | TCGA-3C-AALI-01 | Breast | breast invasive carcinoma | Female | <65 | I/II | Unspecific | Poly E | Complete Response |
| KMT2E | SNV | Missense_Mutation | novel | c.1966N>T | p.Arg656Trp | p.R656W | Q8IZD2 | protein_coding | deleterious(0) | probably_damaging(0.998) | TCGA-5L-AAT1-01 | Breast | breast invasive carcinoma | Female | <65 | III/IV | Hormone Therapy | letrozol | SD |
| KMT2E | SNV | Missense_Mutation | c.5527N>A | p.Gln1843Lys | p.Q1843K | Q8IZD2 | protein_coding | deleterious_low_confidence(0) | possibly_damaging(0.857) | TCGA-AO-A0J4-01 | Breast | breast invasive carcinoma | Female | <65 | I/II | Chemotherapy | doxorubicin | SD | |
| KMT2E | SNV | Missense_Mutation | c.4478N>A | p.Arg1493Gln | p.R1493Q | Q8IZD2 | protein_coding | deleterious_low_confidence(0) | probably_damaging(0.968) | TCGA-B6-A0IK-01 | Breast | breast invasive carcinoma | Female | <65 | III/IV | Unknown | Unknown | PD | |
| KMT2E | SNV | Missense_Mutation | c.1609N>A | p.Val537Ile | p.V537I | Q8IZD2 | protein_coding | tolerated(1) | benign(0.001) | TCGA-BH-A18G-01 | Breast | breast invasive carcinoma | Female | >=65 | I/II | Unknown | Unknown | SD | |
| KMT2E | SNV | Missense_Mutation | c.4214N>T | p.Ser1405Leu | p.S1405L | Q8IZD2 | protein_coding | tolerated_low_confidence(0.24) | benign(0) | TCGA-BH-A1EN-01 | Breast | breast invasive carcinoma | Female | >=65 | I/II | Unknown | Unknown | SD | |
| KMT2E | SNV | Missense_Mutation | c.1183N>T | p.Val395Phe | p.V395F | Q8IZD2 | protein_coding | deleterious(0) | probably_damaging(0.999) | TCGA-D8-A1XO-01 | Breast | breast invasive carcinoma | Female | <65 | I/II | Hormone Therapy | tamoxiphen | SD | |
| KMT2E | SNV | Missense_Mutation | c.4592A>G | p.Tyr1531Cys | p.Y1531C | Q8IZD2 | protein_coding | deleterious_low_confidence(0) | possibly_damaging(0.65) | TCGA-E2-A1LH-01 | Breast | breast invasive carcinoma | Female | <65 | I/II | Chemotherapy | adriamycin | SD | |
| KMT2E | SNV | Missense_Mutation | c.763N>C | p.Val255Leu | p.V255L | Q8IZD2 | protein_coding | tolerated(0.05) | probably_damaging(0.978) | TCGA-E9-A1ND-01 | Breast | breast invasive carcinoma | Female | >=65 | I/II | Hormone Therapy | aromasin | SD | |
| KMT2E | SNV | Missense_Mutation | novel | c.260N>G | p.Asn87Ser | p.N87S | Q8IZD2 | protein_coding | tolerated(0.15) | possibly_damaging(0.743) | TCGA-E9-A5UO-01 | Breast | breast invasive carcinoma | Female | <65 | I/II | Unknown | Unknown | SD |
| Page: 1 2 3 4 5 6 7 8 9 10 11 12 13 14 15 16 17 18 19 20 21 22 |
Top |
Related drugs of malignant transformation related genes |
| Identification of chemicals and drugs interact with genes involved in malignant transfromation |
| (DGIdb 4.0) |
| Entrez ID | Symbol | Category | Interaction Types | Drug Claim Name | Drug Name | PMIDs |
| 55904 | KMT2E | ENZYME, METHYL TRANSFERASE | duloxetine | DULOXETINE | 28696415 |
| Page: 1 |

Copyright 2023-Present -The University of Texas Health Science Center at Houston |