
|
|||||
|
 | |
| |
| |
| |
| |
| |
|
Gene: HRAS |
Gene summary for HRAS |
| Gene information | Species | Human | Gene symbol | HRAS | Gene ID | 3265 |
| Gene name | HRas proto-oncogene, GTPase | |
| Gene Alias | C-BAS/HAS | |
| Cytomap | 11p15.5 | |
| Gene Type | protein-coding | GO ID | GO:0000165 | UniProtAcc | P01112 |
Top |
Malignant transformation analysis |
| Identification of the aberrant gene expression in precancerous and cancerous lesions by comparing the gene expression of stem-like cells in diseased tissues with normal stem cells |
| Entrez ID | Symbol | Replicates | Species | Organ | Tissue | Adj P-value | Log2FC | Malignancy |
| 3265 | HRAS | GSM4909298 | Human | Breast | IDC | 4.62e-07 | 3.06e-01 | 0.1551 |
| 3265 | HRAS | GSM4909311 | Human | Breast | IDC | 2.54e-05 | -1.07e-01 | 0.1534 |
| 3265 | HRAS | GSM4909312 | Human | Breast | IDC | 3.50e-04 | -1.42e-01 | 0.1552 |
| 3265 | HRAS | GSM4909317 | Human | Breast | IDC | 3.51e-16 | 4.63e-01 | 0.1355 |
| 3265 | HRAS | GSM4909318 | Human | Breast | IDC | 3.47e-09 | 7.39e-01 | 0.2031 |
| 3265 | HRAS | GSM4909319 | Human | Breast | IDC | 1.74e-05 | -1.37e-02 | 0.1563 |
| 3265 | HRAS | GSM4909321 | Human | Breast | IDC | 4.73e-03 | 1.28e-01 | 0.1559 |
| 3265 | HRAS | brca1 | Human | Breast | Precancer | 2.78e-11 | 3.86e-01 | -0.0338 |
| 3265 | HRAS | brca2 | Human | Breast | Precancer | 2.43e-02 | 1.74e-01 | -0.024 |
| 3265 | HRAS | DCIS2 | Human | Breast | DCIS | 5.63e-42 | 1.71e-01 | 0.0085 |
| 3265 | HRAS | LZE2T | Human | Esophagus | ESCC | 4.37e-02 | 2.43e-01 | 0.082 |
| 3265 | HRAS | LZE4T | Human | Esophagus | ESCC | 1.47e-03 | 7.33e-02 | 0.0811 |
| 3265 | HRAS | LZE7T | Human | Esophagus | ESCC | 1.14e-06 | 2.48e-01 | 0.0667 |
| 3265 | HRAS | LZE20T | Human | Esophagus | ESCC | 9.21e-07 | 2.90e-01 | 0.0662 |
| 3265 | HRAS | LZE24T | Human | Esophagus | ESCC | 1.37e-06 | 1.13e-01 | 0.0596 |
| 3265 | HRAS | LZE21T | Human | Esophagus | ESCC | 6.03e-07 | 3.30e-01 | 0.0655 |
| 3265 | HRAS | P1T-E | Human | Esophagus | ESCC | 4.21e-10 | 5.91e-01 | 0.0875 |
| 3265 | HRAS | P2T-E | Human | Esophagus | ESCC | 1.22e-36 | 7.43e-01 | 0.1177 |
| 3265 | HRAS | P4T-E | Human | Esophagus | ESCC | 4.87e-45 | 1.03e+00 | 0.1323 |
| 3265 | HRAS | P5T-E | Human | Esophagus | ESCC | 3.56e-37 | 7.55e-01 | 0.1327 |
| Page: 1 2 3 4 5 6 7 |
| Tissue | Expression Dynamics | Abbreviation |
| Breast |  | IDC: Invasive ductal carcinoma |
| DCIS: Ductal carcinoma in situ | ||
| Precancer(BRCA1-mut): Precancerous lesion from BRCA1 mutation carriers | ||
| Esophagus |  | ESCC: Esophageal squamous cell carcinoma |
| HGIN: High-grade intraepithelial neoplasias | ||
| LGIN: Low-grade intraepithelial neoplasias | ||
| Liver |  | HCC: Hepatocellular carcinoma |
| NAFLD: Non-alcoholic fatty liver disease | ||
| Oral Cavity |  | EOLP: Erosive Oral lichen planus |
| LP: leukoplakia | ||
| NEOLP: Non-erosive oral lichen planus | ||
| OSCC: Oral squamous cell carcinoma | ||
| Skin | 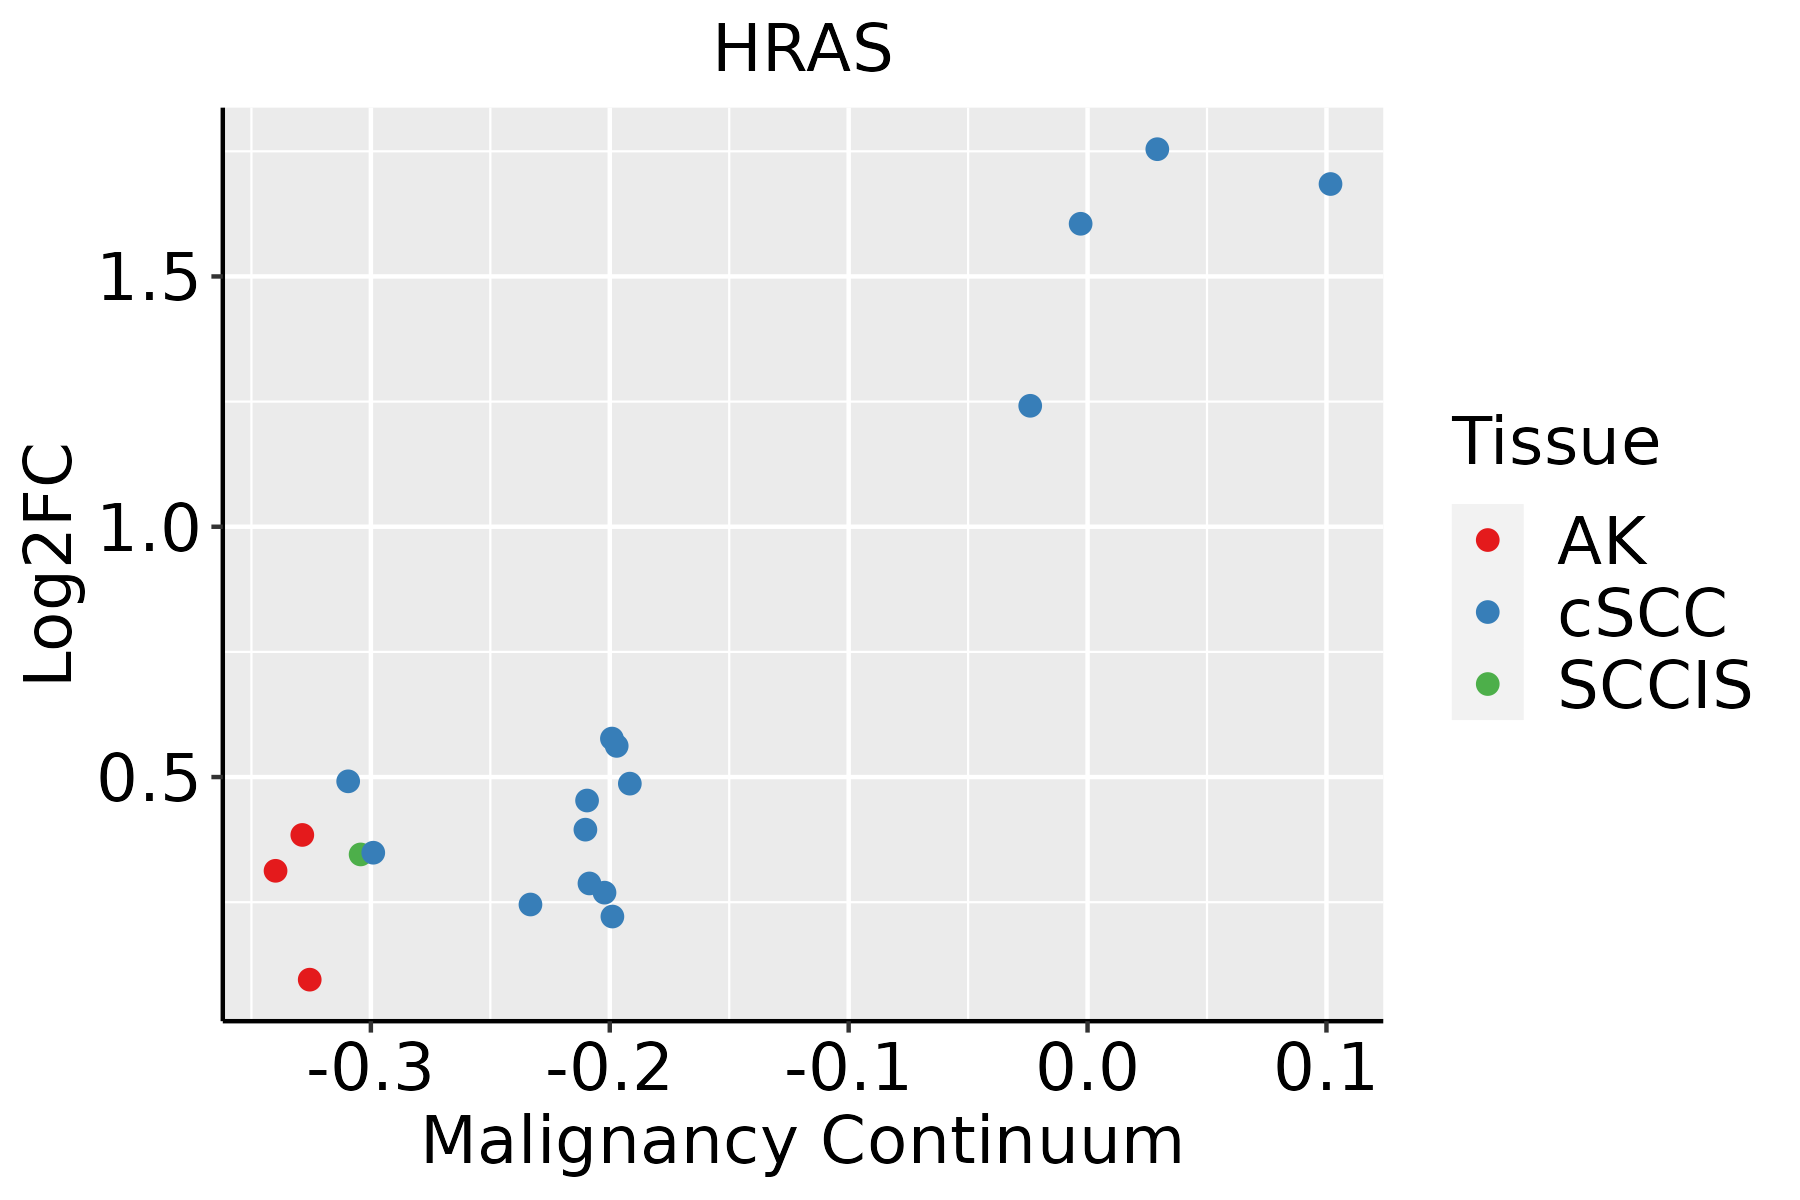 | AK: Actinic keratosis |
| cSCC: Cutaneous squamous cell carcinoma | ||
| SCCIS:squamous cell carcinoma in situ | ||
| Thyroid | 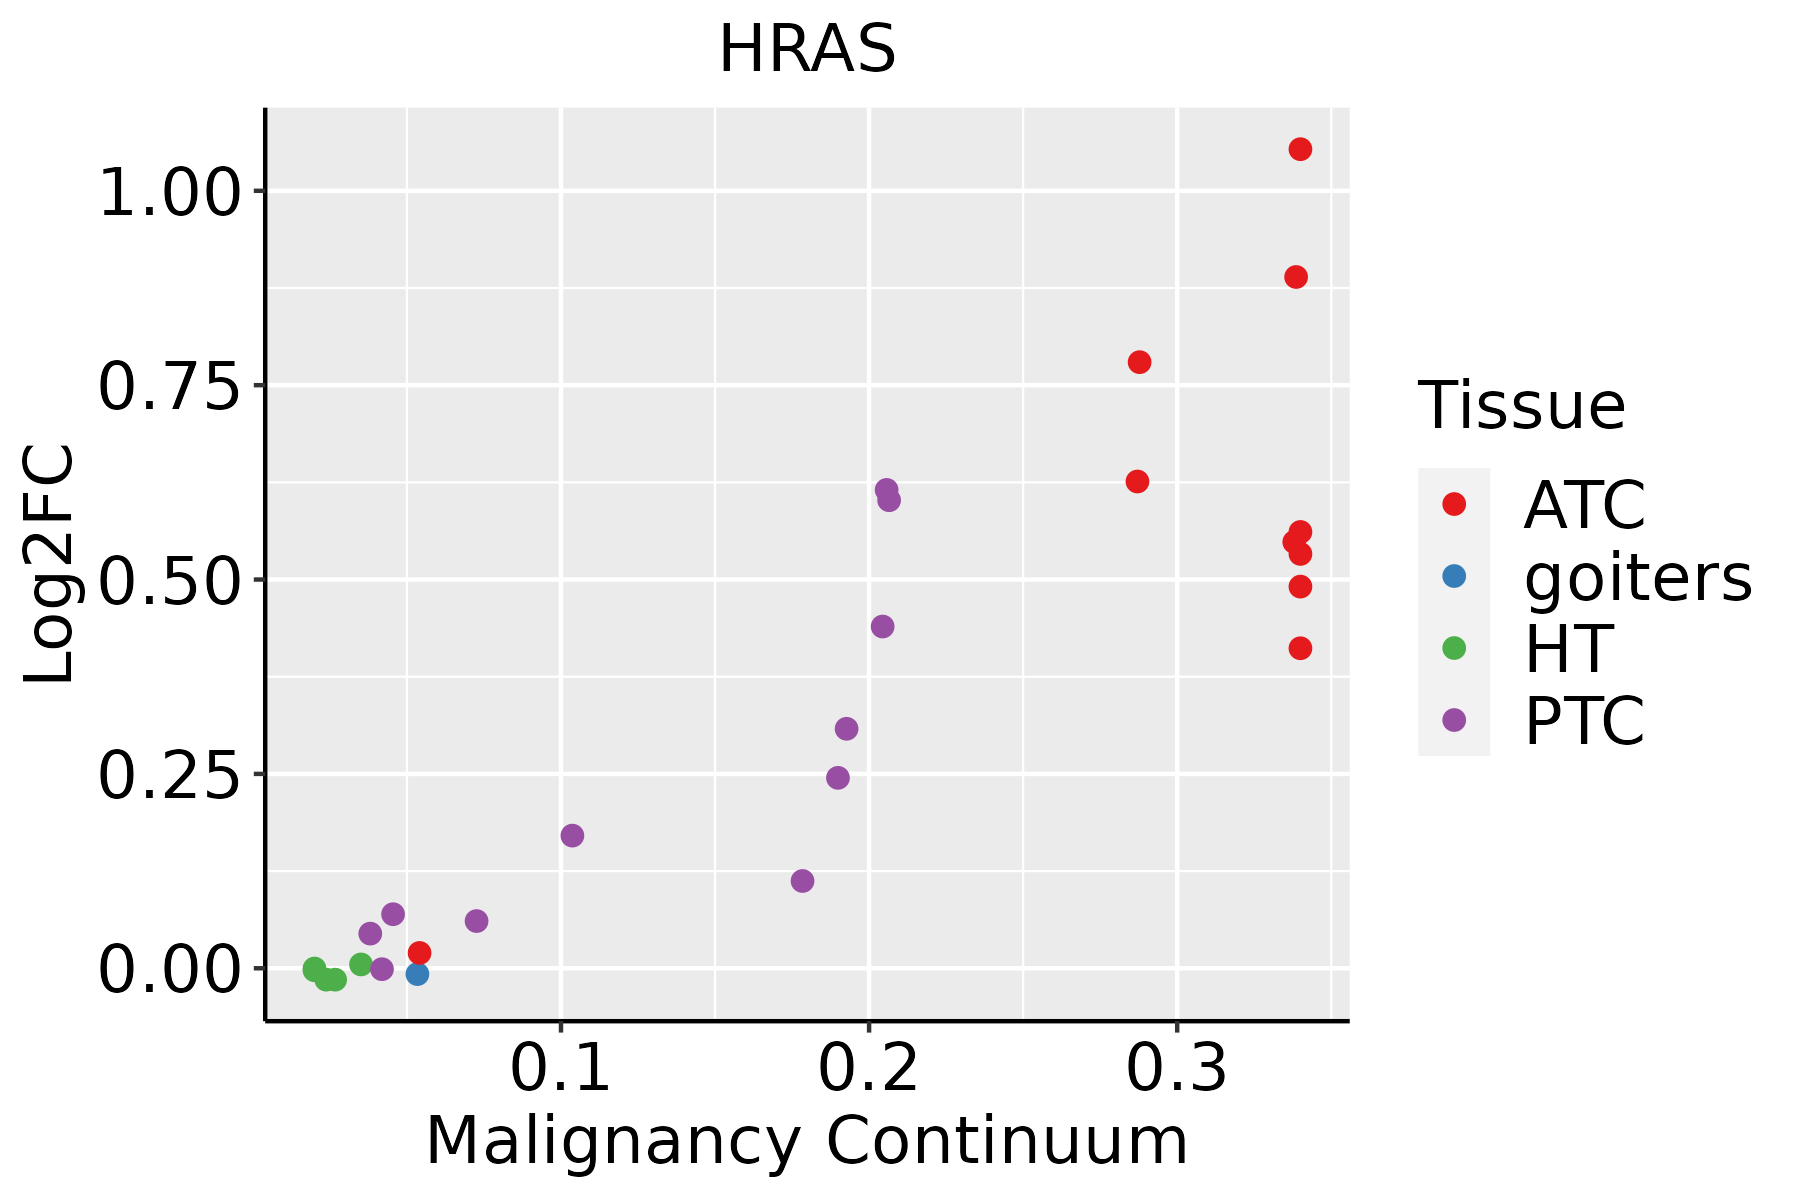 | ATC: Anaplastic thyroid cancer |
| HT: Hashimoto's thyroiditis | ||
| PTC: Papillary thyroid cancer |
| ∗log2FC in expression of this searched gene in stem-like cells from each diseased tissue sample relative to stem-like cells in normal samples in each tissue plotted against the malignancy continuum. Samples are colored based on if they are from different disease stage. |
Top |
Malignant transformation related pathway analysis |
| Find out the enriched GO biological processes and KEGG pathways involved in transition from healthy to precancer to cancer |
| Tissue | Disease Stage | Enriched GO biological Processes |
| Colorectum | AD |  |
| Colorectum | SER |  |
| Colorectum | MSS |  |
| Colorectum | MSI-H |  |
| Colorectum | FAP |  |
| ∗Top 15 enriched GO BP terms are showed in the bar plot of each disease state in each tissue. Each row represents a significant GO biological process which is colored according to the -log10(p.adjust). |
| Page: 1 2 3 4 5 6 7 8 9 |
| GO ID | Tissue | Disease Stage | Description | Gene Ratio | Bg Ratio | pvalue | p.adjust | Count |
| GO:00714802 | Liver | HCC | cellular response to gamma radiation | 23/7958 | 31/18723 | 3.47e-04 | 2.42e-03 | 23 |
| GO:190121512 | Liver | HCC | negative regulation of neuron death | 113/7958 | 208/18723 | 3.68e-04 | 2.54e-03 | 113 |
| GO:00066121 | Liver | HCC | protein targeting to membrane | 75/7958 | 131/18723 | 4.58e-04 | 3.04e-03 | 75 |
| GO:009030321 | Liver | HCC | positive regulation of wound healing | 38/7958 | 59/18723 | 5.61e-04 | 3.61e-03 | 38 |
| GO:007030222 | Liver | HCC | regulation of stress-activated protein kinase signaling cascade | 105/7958 | 195/18723 | 8.79e-04 | 5.20e-03 | 105 |
| GO:190303621 | Liver | HCC | positive regulation of response to wounding | 44/7958 | 72/18723 | 1.10e-03 | 6.32e-03 | 44 |
| GO:004586021 | Liver | HCC | positive regulation of protein kinase activity | 194/7958 | 386/18723 | 1.16e-03 | 6.54e-03 | 194 |
| GO:006049112 | Liver | HCC | regulation of cell projection assembly | 101/7958 | 188/18723 | 1.20e-03 | 6.69e-03 | 101 |
| GO:012003212 | Liver | HCC | regulation of plasma membrane bounded cell projection assembly | 100/7958 | 186/18723 | 1.23e-03 | 6.81e-03 | 100 |
| GO:003367411 | Liver | HCC | positive regulation of kinase activity | 230/7958 | 467/18723 | 1.72e-03 | 8.95e-03 | 230 |
| GO:003287222 | Liver | HCC | regulation of stress-activated MAPK cascade | 102/7958 | 192/18723 | 1.86e-03 | 9.49e-03 | 102 |
| GO:00075691 | Liver | HCC | cell aging | 73/7958 | 132/18723 | 2.00e-03 | 1.01e-02 | 73 |
| GO:004657811 | Liver | HCC | regulation of Ras protein signal transduction | 100/7958 | 189/18723 | 2.42e-03 | 1.18e-02 | 100 |
| GO:00093146 | Liver | HCC | response to radiation | 223/7958 | 456/18723 | 3.08e-03 | 1.43e-02 | 223 |
| GO:000725412 | Liver | HCC | JNK cascade | 89/7958 | 167/18723 | 3.09e-03 | 1.44e-02 | 89 |
| GO:00062751 | Liver | HCC | regulation of DNA replication | 60/7958 | 107/18723 | 3.15e-03 | 1.46e-02 | 60 |
| GO:003152911 | Liver | HCC | ruffle organization | 34/7958 | 56/18723 | 4.54e-03 | 1.96e-02 | 34 |
| GO:2000628 | Liver | HCC | regulation of miRNA metabolic process | 10/7958 | 12/18723 | 4.79e-03 | 2.02e-02 | 10 |
| GO:003153212 | Liver | HCC | actin cytoskeleton reorganization | 59/7958 | 107/18723 | 5.57e-03 | 2.32e-02 | 59 |
| GO:01200344 | Liver | HCC | positive regulation of plasma membrane bounded cell projection assembly | 58/7958 | 105/18723 | 5.66e-03 | 2.36e-02 | 58 |
| Page: 1 2 3 4 5 6 7 8 9 10 11 12 13 14 15 16 17 18 19 20 21 22 23 24 25 26 27 28 29 30 31 32 33 34 35 36 37 38 39 40 41 42 |
| Pathway ID | Tissue | Disease Stage | Description | Gene Ratio | Bg Ratio | pvalue | p.adjust | qvalue | Count |
| hsa0501016 | Breast | Precancer | Alzheimer disease | 103/684 | 384/8465 | 1.03e-29 | 4.66e-28 | 3.57e-28 | 103 |
| hsa0502216 | Breast | Precancer | Pathways of neurodegeneration - multiple diseases | 112/684 | 476/8465 | 6.96e-27 | 2.44e-25 | 1.87e-25 | 112 |
| hsa0520818 | Breast | Precancer | Chemical carcinogenesis - reactive oxygen species | 68/684 | 223/8465 | 3.61e-23 | 1.14e-21 | 8.73e-22 | 68 |
| hsa0471418 | Breast | Precancer | Thermogenesis | 68/684 | 232/8465 | 4.40e-22 | 1.26e-20 | 9.69e-21 | 68 |
| hsa0513218 | Breast | Precancer | Salmonella infection | 49/684 | 249/8465 | 2.92e-09 | 6.15e-08 | 4.71e-08 | 49 |
| hsa0516718 | Breast | Precancer | Kaposi sarcoma-associated herpesvirus infection | 36/684 | 194/8465 | 1.68e-06 | 2.53e-05 | 1.94e-05 | 36 |
| hsa0491518 | Breast | Precancer | Estrogen signaling pathway | 28/684 | 138/8465 | 4.10e-06 | 5.39e-05 | 4.13e-05 | 28 |
| hsa0541718 | Breast | Precancer | Lipid and atherosclerosis | 37/684 | 215/8465 | 7.64e-06 | 9.29e-05 | 7.12e-05 | 37 |
| hsa042189 | Breast | Precancer | Cellular senescence | 29/684 | 156/8465 | 1.66e-05 | 1.69e-04 | 1.30e-04 | 29 |
| hsa042108 | Breast | Precancer | Apoptosis | 25/684 | 136/8465 | 7.61e-05 | 6.87e-04 | 5.26e-04 | 25 |
| hsa0516618 | Breast | Precancer | Human T-cell leukemia virus 1 infection | 33/684 | 222/8465 | 4.29e-04 | 3.31e-03 | 2.53e-03 | 33 |
| hsa0413716 | Breast | Precancer | Mitophagy - animal | 15/684 | 72/8465 | 5.22e-04 | 3.93e-03 | 3.01e-03 | 15 |
| hsa0520514 | Breast | Precancer | Proteoglycans in cancer | 30/684 | 205/8465 | 1.00e-03 | 7.18e-03 | 5.50e-03 | 30 |
| hsa0516316 | Breast | Precancer | Human cytomegalovirus infection | 32/684 | 225/8465 | 1.13e-03 | 7.57e-03 | 5.80e-03 | 32 |
| hsa052309 | Breast | Precancer | Central carbon metabolism in cancer | 13/684 | 70/8465 | 3.57e-03 | 2.17e-02 | 1.66e-02 | 13 |
| hsa052196 | Breast | Precancer | Bladder cancer | 9/684 | 41/8465 | 4.65e-03 | 2.72e-02 | 2.08e-02 | 9 |
| hsa052036 | Breast | Precancer | Viral carcinogenesis | 27/684 | 204/8465 | 7.19e-03 | 4.06e-02 | 3.11e-02 | 27 |
| hsa0501017 | Breast | Precancer | Alzheimer disease | 103/684 | 384/8465 | 1.03e-29 | 4.66e-28 | 3.57e-28 | 103 |
| hsa0502217 | Breast | Precancer | Pathways of neurodegeneration - multiple diseases | 112/684 | 476/8465 | 6.96e-27 | 2.44e-25 | 1.87e-25 | 112 |
| hsa0520819 | Breast | Precancer | Chemical carcinogenesis - reactive oxygen species | 68/684 | 223/8465 | 3.61e-23 | 1.14e-21 | 8.73e-22 | 68 |
| Page: 1 2 3 4 5 6 7 8 9 10 11 12 13 14 15 16 17 18 19 20 21 22 23 24 25 26 27 |
Top |
Cell-cell communication analysis |
| Identification of potential cell-cell interactions between two cell types and their ligand-receptor pairs for different disease states |
| Ligand | Receptor | LRpair | Pathway | Tissue | Disease Stage |
| Page: 1 |
Top |
Single-cell gene regulatory network inference analysis |
| Find out the significant the regulons (TFs) and the target genes of each regulon across cell types for different disease states |
| TF | Cell Type | Tissue | Disease Stage | Target Gene | RSS | Regulon Activity |
| ∗The dot plots of a searched regulon are shown for all cell subpopulations in each disease state of each tissue based on the regulon specific score inferred using pySCENIC and by calculating the average expression. |
| Page: 1 |
Top |
Somatic mutation of malignant transformation related genes |
| Annotation of somatic variants for genes involved in malignant transformation |
| Hugo Symbol | Variant Class | Variant Classification | dbSNP RS | HGVSc | HGVSp | HGVSp Short | SWISSPROT | BIOTYPE | SIFT | PolyPhen | Tumor Sample Barcode | Tissue | Histology | Sex | Age | Stage | Therapy Types | Drugs | Outcome |
| HRAS | SNV | Missense_Mutation | rs104894228 | c.37N>C | p.Gly13Arg | p.G13R | P01112 | protein_coding | deleterious(0) | probably_damaging(0.975) | TCGA-AR-A5QQ-01 | Breast | breast invasive carcinoma | Female | >=65 | III/IV | Chemotherapy | carboplatin | PD |
| HRAS | SNV | Missense_Mutation | rs121913233 | c.182A>T | p.Gln61Leu | p.Q61L | P01112 | protein_coding | deleterious(0) | possibly_damaging(0.577) | TCGA-B6-A400-01 | Breast | breast invasive carcinoma | Female | <65 | III/IV | Unknown | Unknown | SD |
| HRAS | SNV | Missense_Mutation | rs121913233 | c.182A>T | p.Gln61Leu | p.Q61L | P01112 | protein_coding | deleterious(0) | possibly_damaging(0.577) | TCGA-BH-A0HL-01 | Breast | breast invasive carcinoma | Female | <65 | I/II | Chemotherapy | cyclophosphamide | SD |
| HRAS | SNV | Missense_Mutation | rs104894230 | c.35G>A | p.Gly12Asp | p.G12D | P01112 | protein_coding | deleterious(0) | benign(0.339) | TCGA-LL-A740-01 | Breast | breast invasive carcinoma | Female | <65 | I/II | Chemotherapy | adriamycin | CR |
| HRAS | SNV | Missense_Mutation | rs104894229 | c.34G>T | p.Gly12Cys | p.G12C | P01112 | protein_coding | deleterious(0.04) | benign(0.385) | TCGA-S3-AA10-01 | Breast | breast invasive carcinoma | Female | >=65 | I/II | Chemotherapy | cytoxan | CR |
| HRAS | SNV | Missense_Mutation | novel | c.269T>G | p.Phe90Cys | p.F90C | P01112 | protein_coding | deleterious(0) | probably_damaging(1) | TCGA-XX-A89A-01 | Breast | breast invasive carcinoma | Female | >=65 | I/II | Unknown | Unknown | SD |
| HRAS | SNV | Missense_Mutation | c.388N>A | p.Ala130Thr | p.A130T | P01112 | protein_coding | deleterious(0) | possibly_damaging(0.752) | TCGA-LP-A4AV-01 | Cervix | cervical & endocervical cancer | Female | <65 | I/II | Unknown | Unknown | SD | |
| HRAS | SNV | Missense_Mutation | rs104894229 | c.34N>A | p.Gly12Ser | p.G12S | P01112 | protein_coding | deleterious(0.02) | benign(0.383) | TCGA-ZJ-AAXF-01 | Cervix | cervical & endocervical cancer | Female | <65 | I/II | Unknown | Unknown | SD |
| HRAS | SNV | Missense_Mutation | c.404G>A | p.Arg135Gln | p.R135Q | P01112 | protein_coding | tolerated(0.17) | benign(0.082) | TCGA-A6-6781-01 | Colorectum | colon adenocarcinoma | Male | <65 | III/IV | Chemotherapy | oxaliplatin | SD | |
| HRAS | SNV | Missense_Mutation | rs142218590 | c.506G>A | p.Arg169Gln | p.R169Q | P01112 | protein_coding | tolerated(0.28) | benign(0) | TCGA-AA-3947-01 | Colorectum | colon adenocarcinoma | Female | <65 | I/II | Unknown | Unknown | SD |
| Page: 1 2 3 4 5 6 7 8 9 |
Top |
Related drugs of malignant transformation related genes |
| Identification of chemicals and drugs interact with genes involved in malignant transfromation |
| (DGIdb 4.0) |
| Entrez ID | Symbol | Category | Interaction Types | Drug Claim Name | Drug Name | PMIDs |
| 3265 | HRAS | CLINICALLY ACTIONABLE, DRUG RESISTANCE, TUMOR SUPPRESSOR, DRUGGABLE GENOME, ENZYME | Pz-1 | 26126987 | ||
| 3265 | HRAS | CLINICALLY ACTIONABLE, DRUG RESISTANCE, TUMOR SUPPRESSOR, DRUGGABLE GENOME, ENZYME | MEK INHIBITOR PD0325901 | 26544513 | ||
| 3265 | HRAS | CLINICALLY ACTIONABLE, DRUG RESISTANCE, TUMOR SUPPRESSOR, DRUGGABLE GENOME, ENZYME | Sirolimus | SIROLIMUS | 26882569 | |
| 3265 | HRAS | CLINICALLY ACTIONABLE, DRUG RESISTANCE, TUMOR SUPPRESSOR, DRUGGABLE GENOME, ENZYME | Selumetinib | SELUMETINIB | 26544513,27222538 | |
| 3265 | HRAS | CLINICALLY ACTIONABLE, DRUG RESISTANCE, TUMOR SUPPRESSOR, DRUGGABLE GENOME, ENZYME | BRYOSTATIN-1 | 16483930 | ||
| 3265 | HRAS | CLINICALLY ACTIONABLE, DRUG RESISTANCE, TUMOR SUPPRESSOR, DRUGGABLE GENOME, ENZYME | rigosertib | RIGOSERTIB | 27104980 | |
| 3265 | HRAS | CLINICALLY ACTIONABLE, DRUG RESISTANCE, TUMOR SUPPRESSOR, DRUGGABLE GENOME, ENZYME | VIRAL VECTOR | 10911621 | ||
| 3265 | HRAS | CLINICALLY ACTIONABLE, DRUG RESISTANCE, TUMOR SUPPRESSOR, DRUGGABLE GENOME, ENZYME | REOLYSIN | PELAREOREP | ||
| 3265 | HRAS | CLINICALLY ACTIONABLE, DRUG RESISTANCE, TUMOR SUPPRESSOR, DRUGGABLE GENOME, ENZYME | Everolimus | EVEROLIMUS | 26544513 | |
| 3265 | HRAS | CLINICALLY ACTIONABLE, DRUG RESISTANCE, TUMOR SUPPRESSOR, DRUGGABLE GENOME, ENZYME | LAK | 3489774 |
| Page: 1 2 3 4 5 6 7 |

Copyright 2023-Present -The University of Texas Health Science Center at Houston |