
|
|||||
|
 | |
| |
| |
| |
| |
| |
|
Gene: FNIP1 |
Gene summary for FNIP1 |
| Gene information | Species | Human | Gene symbol | FNIP1 | Gene ID | 96459 |
| Gene name | folliculin interacting protein 1 | |
| Gene Alias | FNIP1 | |
| Cytomap | 5q31.1 | |
| Gene Type | protein-coding | GO ID | GO:0000122 | UniProtAcc | Q8TF40 |
Top |
Malignant transformation analysis |
| Identification of the aberrant gene expression in precancerous and cancerous lesions by comparing the gene expression of stem-like cells in diseased tissues with normal stem cells |
| Entrez ID | Symbol | Replicates | Species | Organ | Tissue | Adj P-value | Log2FC | Malignancy |
| 96459 | FNIP1 | LZE4T | Human | Esophagus | ESCC | 2.64e-10 | 3.61e-01 | 0.0811 |
| 96459 | FNIP1 | LZE5T | Human | Esophagus | ESCC | 9.34e-04 | 2.66e-01 | 0.0514 |
| 96459 | FNIP1 | LZE7T | Human | Esophagus | ESCC | 4.98e-06 | 2.87e-01 | 0.0667 |
| 96459 | FNIP1 | LZE8T | Human | Esophagus | ESCC | 2.67e-13 | 2.61e-01 | 0.067 |
| 96459 | FNIP1 | LZE20T | Human | Esophagus | ESCC | 1.11e-05 | 1.54e-01 | 0.0662 |
| 96459 | FNIP1 | LZE21D1 | Human | Esophagus | HGIN | 4.99e-03 | 1.67e-01 | 0.0632 |
| 96459 | FNIP1 | LZE22D1 | Human | Esophagus | HGIN | 3.99e-02 | 1.04e-01 | 0.0595 |
| 96459 | FNIP1 | LZE22T | Human | Esophagus | ESCC | 4.69e-09 | 6.20e-01 | 0.068 |
| 96459 | FNIP1 | LZE24T | Human | Esophagus | ESCC | 1.66e-19 | 3.36e-01 | 0.0596 |
| 96459 | FNIP1 | LZE21T | Human | Esophagus | ESCC | 3.85e-06 | 3.32e-01 | 0.0655 |
| 96459 | FNIP1 | LZE6T | Human | Esophagus | ESCC | 1.29e-04 | 1.54e-01 | 0.0845 |
| 96459 | FNIP1 | P1T-E | Human | Esophagus | ESCC | 7.84e-12 | 3.35e-01 | 0.0875 |
| 96459 | FNIP1 | P2T-E | Human | Esophagus | ESCC | 3.93e-35 | 4.72e-01 | 0.1177 |
| 96459 | FNIP1 | P4T-E | Human | Esophagus | ESCC | 8.64e-19 | 4.01e-01 | 0.1323 |
| 96459 | FNIP1 | P5T-E | Human | Esophagus | ESCC | 6.64e-18 | 2.29e-01 | 0.1327 |
| 96459 | FNIP1 | P8T-E | Human | Esophagus | ESCC | 9.24e-23 | 3.05e-01 | 0.0889 |
| 96459 | FNIP1 | P9T-E | Human | Esophagus | ESCC | 2.13e-18 | 3.39e-01 | 0.1131 |
| 96459 | FNIP1 | P10T-E | Human | Esophagus | ESCC | 1.67e-28 | 3.93e-01 | 0.116 |
| 96459 | FNIP1 | P11T-E | Human | Esophagus | ESCC | 3.92e-16 | 4.77e-01 | 0.1426 |
| 96459 | FNIP1 | P12T-E | Human | Esophagus | ESCC | 2.35e-28 | 4.58e-01 | 0.1122 |
| Page: 1 2 3 4 5 6 7 8 |
| Tissue | Expression Dynamics | Abbreviation |
| Esophagus | 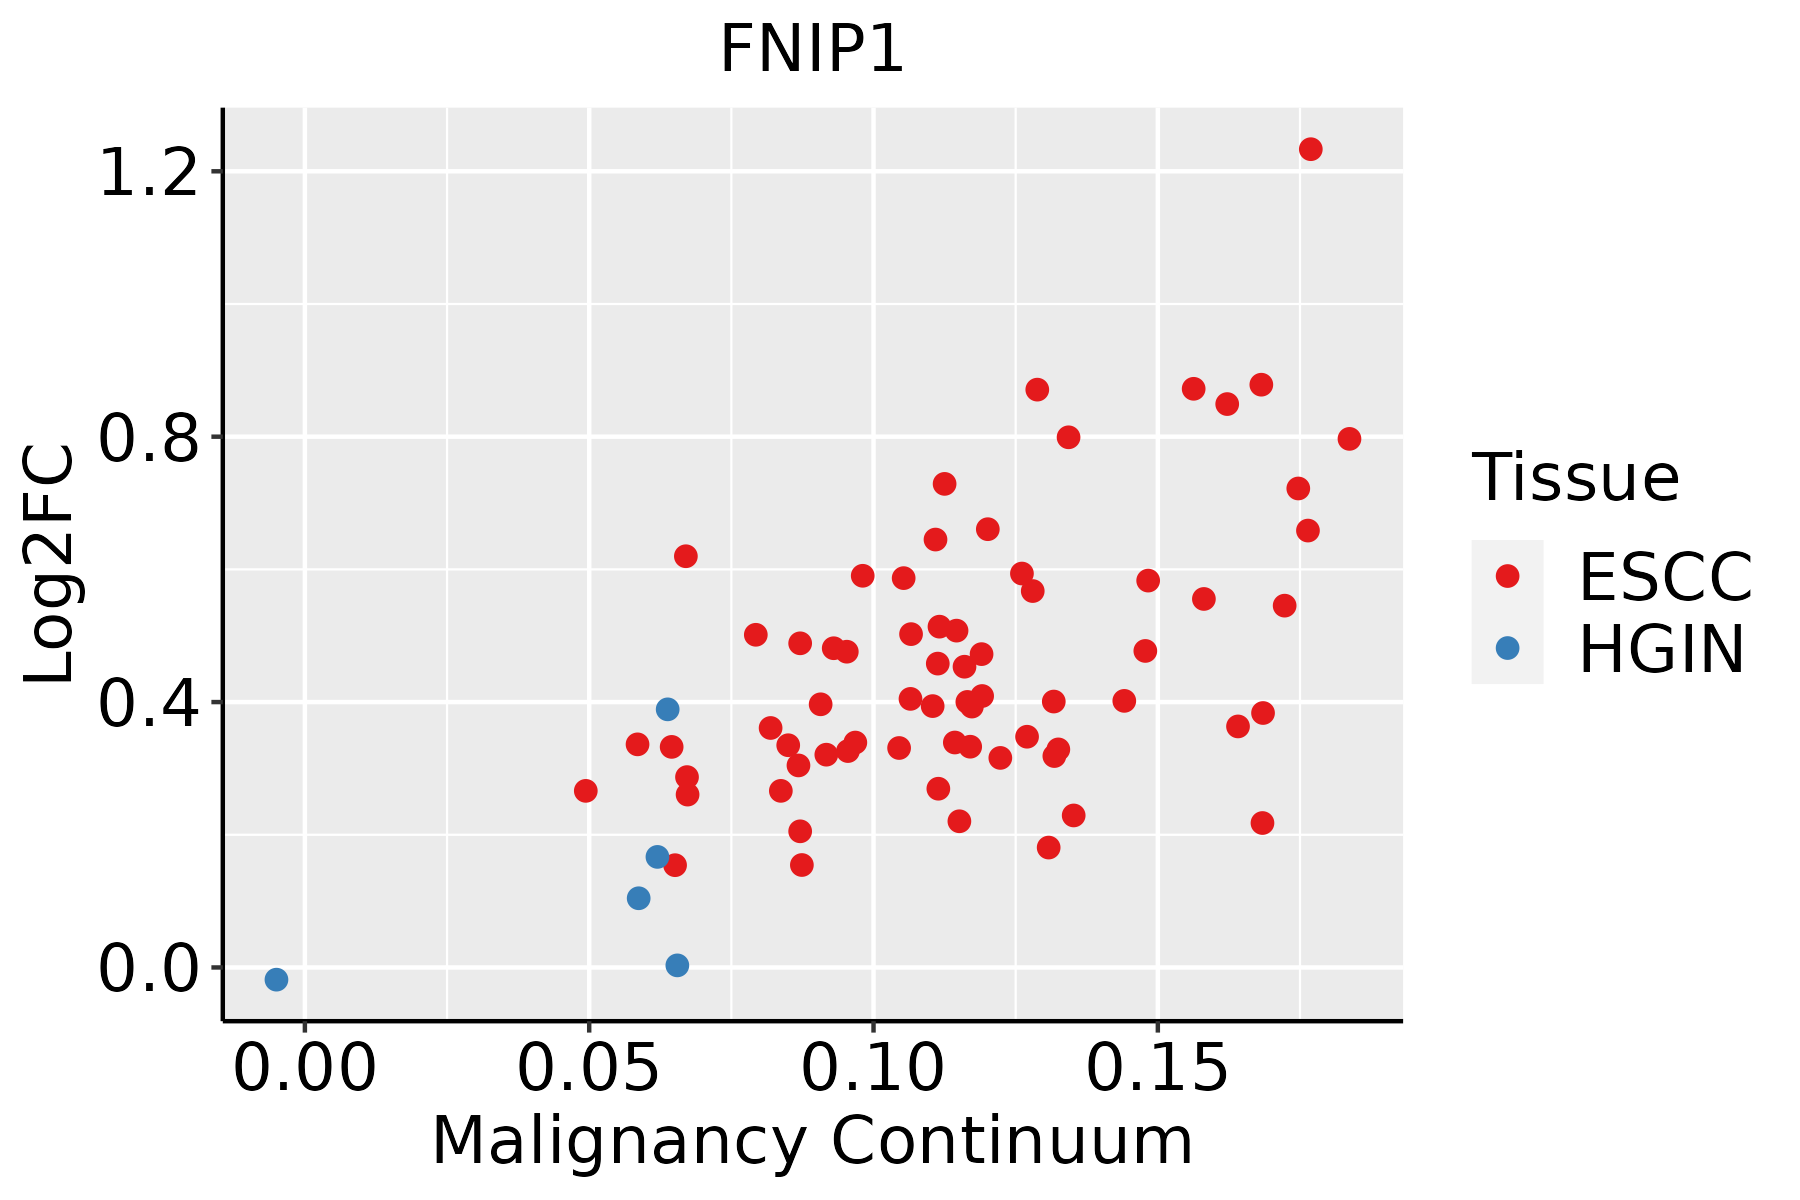 | ESCC: Esophageal squamous cell carcinoma |
| HGIN: High-grade intraepithelial neoplasias | ||
| LGIN: Low-grade intraepithelial neoplasias | ||
| Liver |  | HCC: Hepatocellular carcinoma |
| NAFLD: Non-alcoholic fatty liver disease | ||
| Lung |  | AAH: Atypical adenomatous hyperplasia |
| AIS: Adenocarcinoma in situ | ||
| IAC: Invasive lung adenocarcinoma | ||
| MIA: Minimally invasive adenocarcinoma | ||
| Oral Cavity | 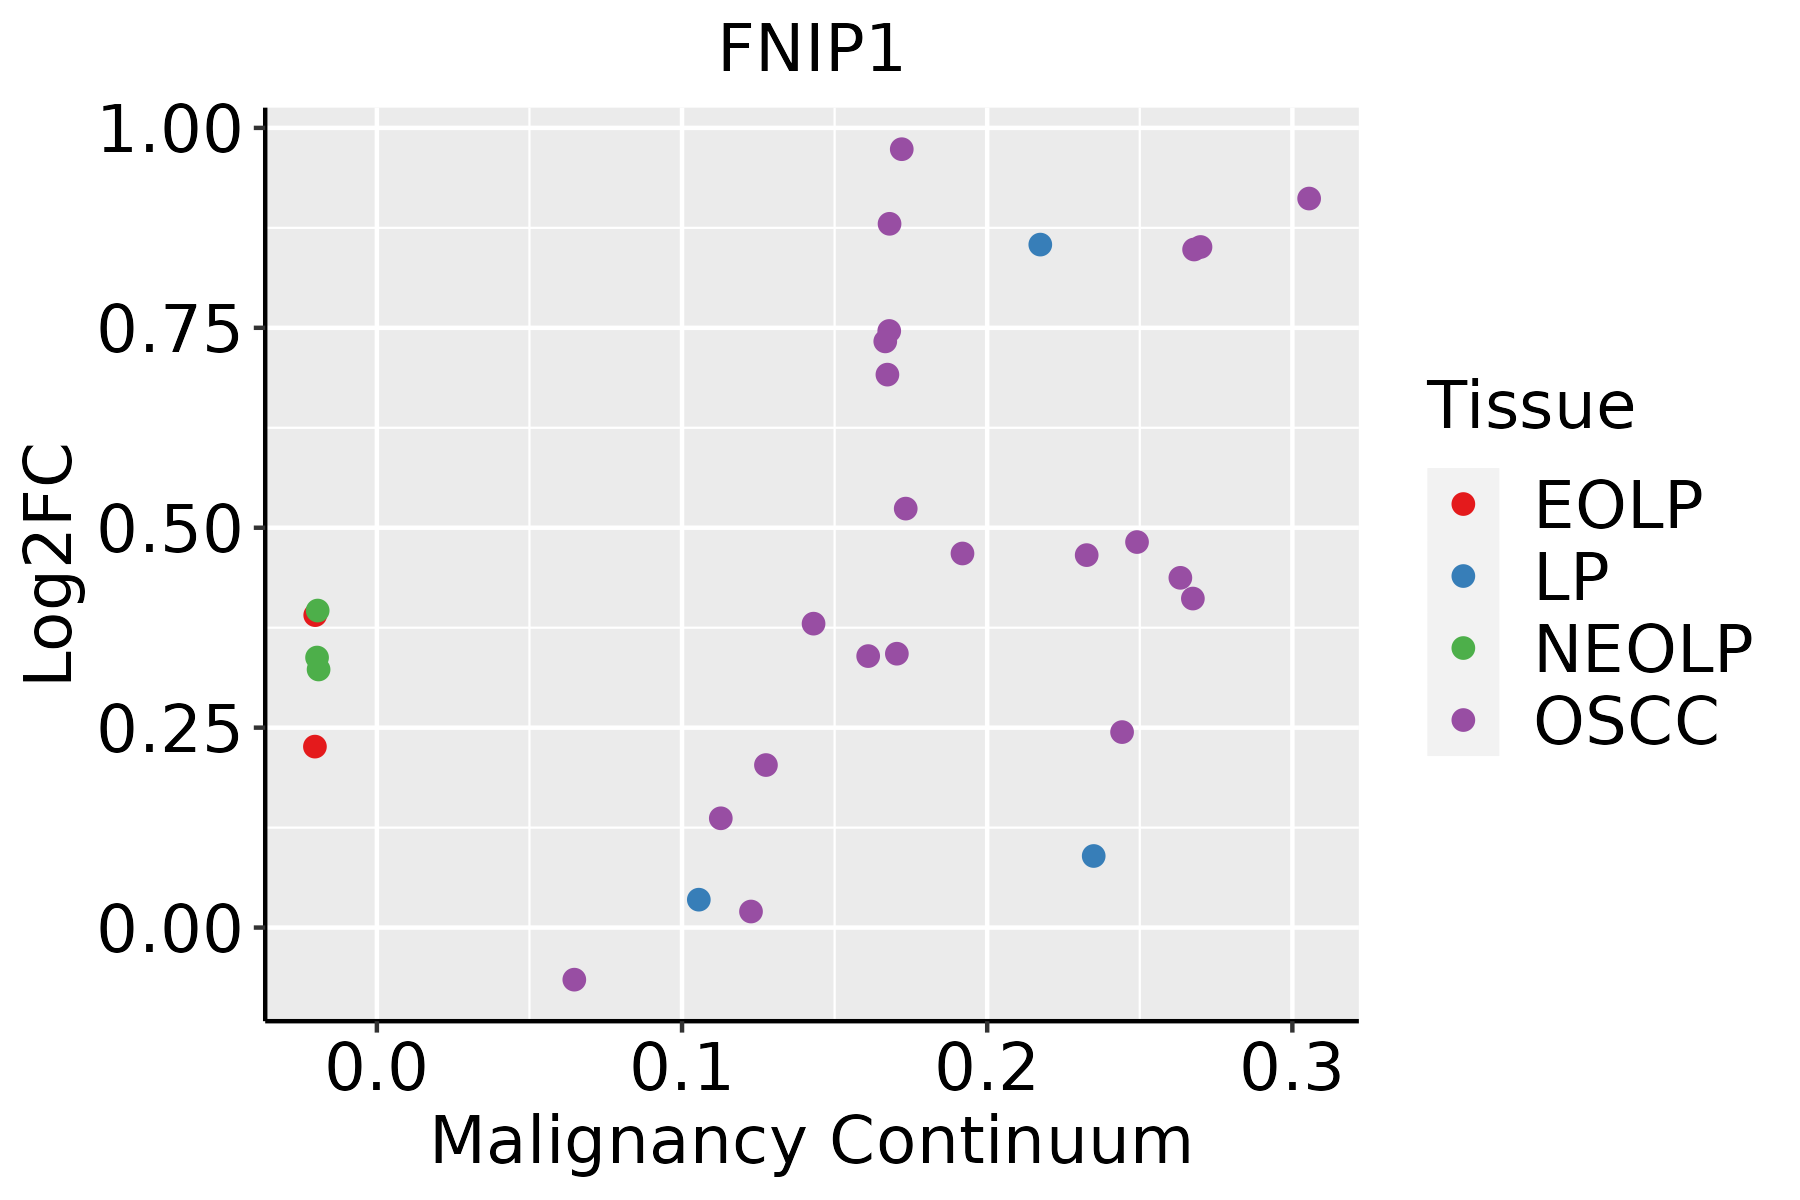 | EOLP: Erosive Oral lichen planus |
| LP: leukoplakia | ||
| NEOLP: Non-erosive oral lichen planus | ||
| OSCC: Oral squamous cell carcinoma | ||
| Prostate |  | BPH: Benign Prostatic Hyperplasia |
| Thyroid | 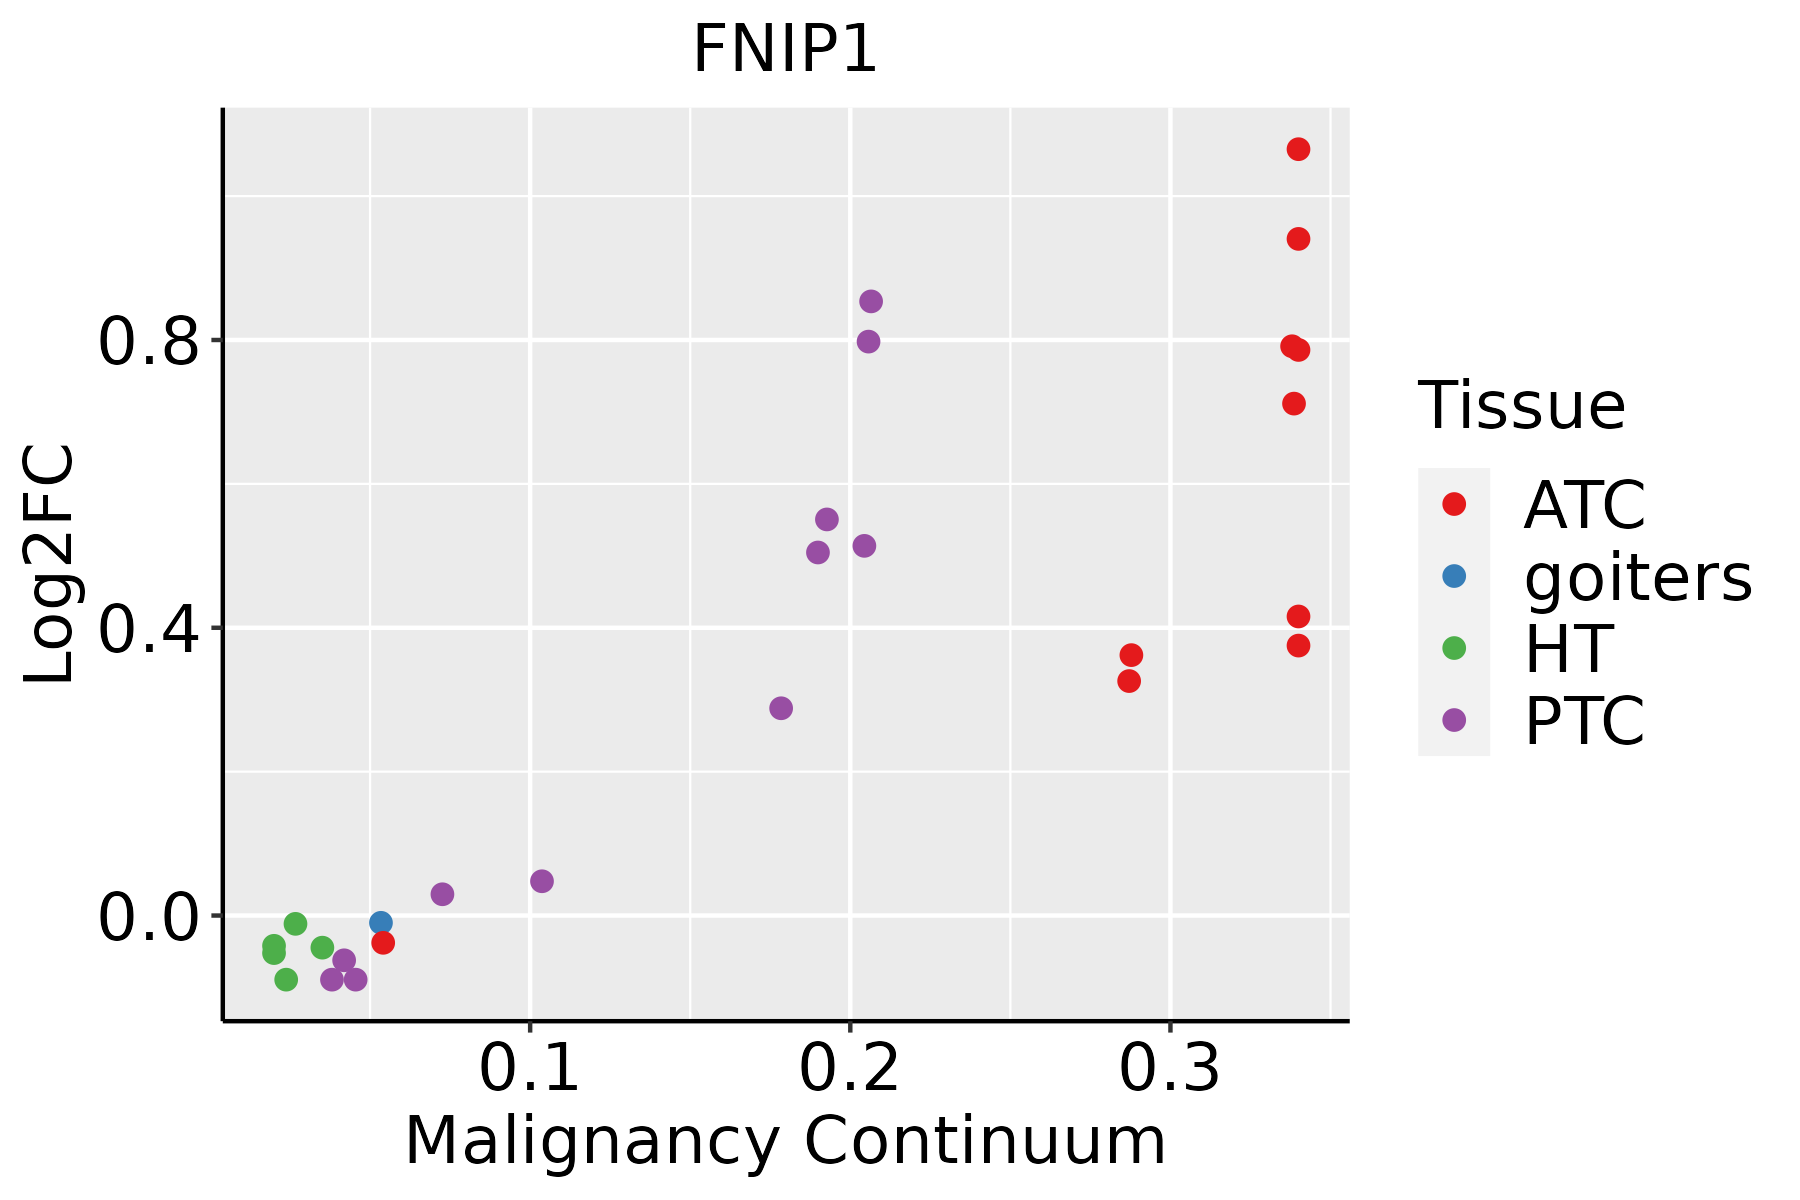 | ATC: Anaplastic thyroid cancer |
| HT: Hashimoto's thyroiditis | ||
| PTC: Papillary thyroid cancer |
| ∗log2FC in expression of this searched gene in stem-like cells from each diseased tissue sample relative to stem-like cells in normal samples in each tissue plotted against the malignancy continuum. Samples are colored based on if they are from different disease stage. |
Top |
Malignant transformation related pathway analysis |
| Find out the enriched GO biological processes and KEGG pathways involved in transition from healthy to precancer to cancer |
| Tissue | Disease Stage | Enriched GO biological Processes |
| Colorectum | AD |  |
| Colorectum | SER |  |
| Colorectum | MSS |  |
| Colorectum | MSI-H |  |
| Colorectum | FAP |  |
| ∗Top 15 enriched GO BP terms are showed in the bar plot of each disease state in each tissue. Each row represents a significant GO biological process which is colored according to the -log10(p.adjust). |
| Page: 1 2 3 4 5 6 7 8 9 |
| GO ID | Tissue | Disease Stage | Description | Gene Ratio | Bg Ratio | pvalue | p.adjust | Count |
| GO:000926724 | Thyroid | ATC | cellular response to starvation | 85/6293 | 156/18723 | 6.14e-08 | 1.09e-06 | 85 |
| GO:0031667210 | Thyroid | ATC | response to nutrient levels | 212/6293 | 474/18723 | 2.37e-07 | 3.70e-06 | 212 |
| GO:004328133 | Thyroid | ATC | regulation of cysteine-type endopeptidase activity involved in apoptotic process | 102/6293 | 209/18723 | 3.61e-06 | 4.03e-05 | 102 |
| GO:005254734 | Thyroid | ATC | regulation of peptidase activity | 200/6293 | 461/18723 | 6.25e-06 | 6.52e-05 | 200 |
| GO:200011633 | Thyroid | ATC | regulation of cysteine-type endopeptidase activity | 111/6293 | 235/18723 | 9.41e-06 | 9.41e-05 | 111 |
| GO:004315433 | Thyroid | ATC | negative regulation of cysteine-type endopeptidase activity involved in apoptotic process | 43/6293 | 78/18723 | 7.43e-05 | 5.63e-04 | 43 |
| GO:200011733 | Thyroid | ATC | negative regulation of cysteine-type endopeptidase activity | 46/6293 | 86/18723 | 1.13e-04 | 8.08e-04 | 46 |
| GO:005254834 | Thyroid | ATC | regulation of endopeptidase activity | 181/6293 | 432/18723 | 1.70e-04 | 1.16e-03 | 181 |
| GO:007188711 | Thyroid | ATC | leukocyte apoptotic process | 53/6293 | 106/18723 | 3.48e-04 | 2.16e-03 | 53 |
| GO:004586134 | Thyroid | ATC | negative regulation of proteolysis | 146/6293 | 351/18723 | 9.84e-04 | 5.22e-03 | 146 |
| GO:003192911 | Thyroid | ATC | TOR signaling | 59/6293 | 126/18723 | 1.39e-03 | 7.19e-03 | 59 |
| GO:005134629 | Thyroid | ATC | negative regulation of hydrolase activity | 155/6293 | 379/18723 | 1.64e-03 | 8.23e-03 | 155 |
| GO:190153212 | Thyroid | ATC | regulation of hematopoietic progenitor cell differentiation | 19/6293 | 32/18723 | 2.46e-03 | 1.14e-02 | 19 |
| GO:003313512 | Thyroid | ATC | regulation of peptidyl-serine phosphorylation | 65/6293 | 144/18723 | 2.57e-03 | 1.18e-02 | 65 |
| GO:20001062 | Thyroid | ATC | regulation of leukocyte apoptotic process | 39/6293 | 81/18723 | 4.65e-03 | 1.92e-02 | 39 |
| GO:00702272 | Thyroid | ATC | lymphocyte apoptotic process | 35/6293 | 72/18723 | 5.89e-03 | 2.37e-02 | 35 |
| GO:00022448 | Thyroid | ATC | hematopoietic progenitor cell differentiation | 51/6293 | 114/18723 | 8.62e-03 | 3.28e-02 | 51 |
| Page: 1 2 3 4 5 6 7 8 9 10 11 12 13 14 15 16 17 |
| Pathway ID | Tissue | Disease Stage | Description | Gene Ratio | Bg Ratio | pvalue | p.adjust | qvalue | Count |
| hsa041505 | Esophagus | ESCC | mTOR signaling pathway | 98/4205 | 156/8465 | 5.81e-04 | 1.95e-03 | 9.97e-04 | 98 |
| hsa0415013 | Esophagus | ESCC | mTOR signaling pathway | 98/4205 | 156/8465 | 5.81e-04 | 1.95e-03 | 9.97e-04 | 98 |
| hsa041502 | Liver | HCC | mTOR signaling pathway | 95/4020 | 156/8465 | 4.70e-04 | 1.99e-03 | 1.11e-03 | 95 |
| hsa0415011 | Liver | HCC | mTOR signaling pathway | 95/4020 | 156/8465 | 4.70e-04 | 1.99e-03 | 1.11e-03 | 95 |
| hsa041504 | Oral cavity | OSCC | mTOR signaling pathway | 90/3704 | 156/8465 | 2.87e-04 | 9.15e-04 | 4.66e-04 | 90 |
| hsa0415012 | Oral cavity | OSCC | mTOR signaling pathway | 90/3704 | 156/8465 | 2.87e-04 | 9.15e-04 | 4.66e-04 | 90 |
| hsa0415021 | Oral cavity | EOLP | mTOR signaling pathway | 34/1218 | 156/8465 | 7.59e-03 | 2.17e-02 | 1.28e-02 | 34 |
| hsa041503 | Oral cavity | EOLP | mTOR signaling pathway | 34/1218 | 156/8465 | 7.59e-03 | 2.17e-02 | 1.28e-02 | 34 |
| Page: 1 |
Top |
Cell-cell communication analysis |
| Identification of potential cell-cell interactions between two cell types and their ligand-receptor pairs for different disease states |
| Ligand | Receptor | LRpair | Pathway | Tissue | Disease Stage |
| Page: 1 |
Top |
Single-cell gene regulatory network inference analysis |
| Find out the significant the regulons (TFs) and the target genes of each regulon across cell types for different disease states |
| TF | Cell Type | Tissue | Disease Stage | Target Gene | RSS | Regulon Activity |
| ∗The dot plots of a searched regulon are shown for all cell subpopulations in each disease state of each tissue based on the regulon specific score inferred using pySCENIC and by calculating the average expression. |
| Page: 1 |
Top |
Somatic mutation of malignant transformation related genes |
| Annotation of somatic variants for genes involved in malignant transformation |
| Hugo Symbol | Variant Class | Variant Classification | dbSNP RS | HGVSc | HGVSp | HGVSp Short | SWISSPROT | BIOTYPE | SIFT | PolyPhen | Tumor Sample Barcode | Tissue | Histology | Sex | Age | Stage | Therapy Types | Drugs | Outcome |
| FNIP1 | SNV | Missense_Mutation | c.3239C>G | p.Ser1080Cys | p.S1080C | Q8TF40 | protein_coding | deleterious(0) | probably_damaging(0.999) | TCGA-A8-A06Q-01 | Breast | breast invasive carcinoma | Female | <65 | III/IV | Unknown | Unknown | SD | |
| FNIP1 | SNV | Missense_Mutation | rs148075882 | c.3071N>A | p.Arg1024His | p.R1024H | Q8TF40 | protein_coding | deleterious(0) | possibly_damaging(0.891) | TCGA-AN-A046-01 | Breast | breast invasive carcinoma | Female | >=65 | I/II | Unknown | Unknown | SD |
| FNIP1 | SNV | Missense_Mutation | novel | c.1175N>A | p.Arg392Gln | p.R392Q | Q8TF40 | protein_coding | deleterious(0) | possibly_damaging(0.767) | TCGA-AN-A046-01 | Breast | breast invasive carcinoma | Female | >=65 | I/II | Unknown | Unknown | SD |
| FNIP1 | SNV | Missense_Mutation | c.1334N>G | p.Asn445Ser | p.N445S | Q8TF40 | protein_coding | deleterious(0.01) | benign(0.037) | TCGA-AR-A0U0-01 | Breast | breast invasive carcinoma | Female | >=65 | I/II | Unknown | Unknown | SD | |
| FNIP1 | SNV | Missense_Mutation | c.668N>T | p.Gly223Val | p.G223V | Q8TF40 | protein_coding | deleterious(0.03) | probably_damaging(0.982) | TCGA-AR-A1AQ-01 | Breast | breast invasive carcinoma | Female | <65 | I/II | Chemotherapy | doxorubicin | SD | |
| FNIP1 | insertion | Frame_Shift_Ins | novel | c.3310_3311insGCACAAGGGA | p.Val1104GlyfsTer8 | p.V1104Gfs*8 | Q8TF40 | protein_coding | TCGA-AR-A0U0-01 | Breast | breast invasive carcinoma | Female | >=65 | I/II | Unknown | Unknown | SD | ||
| FNIP1 | SNV | Missense_Mutation | novel | c.1598N>G | p.Gln533Arg | p.Q533R | Q8TF40 | protein_coding | tolerated(0.08) | benign(0.039) | TCGA-A6-2672-01 | Colorectum | colon adenocarcinoma | Female | >=65 | III/IV | Unknown | Unknown | SD |
| FNIP1 | SNV | Missense_Mutation | c.1300N>T | p.Arg434Cys | p.R434C | Q8TF40 | protein_coding | deleterious(0.04) | benign(0.222) | TCGA-AA-3984-01 | Colorectum | colon adenocarcinoma | Female | <65 | I/II | Unknown | Unknown | SD | |
| FNIP1 | SNV | Missense_Mutation | novel | c.1759N>G | p.Thr587Ala | p.T587A | Q8TF40 | protein_coding | deleterious(0.05) | possibly_damaging(0.79) | TCGA-AA-A01D-01 | Colorectum | colon adenocarcinoma | Female | <65 | III/IV | Chemotherapy | capecitabine | PD |
| FNIP1 | SNV | Missense_Mutation | c.872G>A | p.Arg291His | p.R291H | Q8TF40 | protein_coding | deleterious(0.01) | probably_damaging(0.999) | TCGA-AD-5900-01 | Colorectum | colon adenocarcinoma | Male | >=65 | I/II | Unknown | Unknown | SD |
| Page: 1 2 3 4 5 6 7 8 9 10 11 12 13 14 |
Top |
Related drugs of malignant transformation related genes |
| Identification of chemicals and drugs interact with genes involved in malignant transfromation |
| (DGIdb 4.0) |
| Entrez ID | Symbol | Category | Interaction Types | Drug Claim Name | Drug Name | PMIDs |
| Page: 1 |

Copyright 2023-Present -The University of Texas Health Science Center at Houston |