Schematic overview of the cellular and molecular mechanisms involved in the cancer progression, including the proposed cellular and molecular mechanisms in cancer cells trajectory. AT1: alveolar type 1 cells; AT2: alveolar type 2 cells; AAH: atypical adenomatous hyperplasia; AIS: adenocarcinoma in situ; MIA: minimally invasive adenocarcinoma; IA: invasive adenocarcinoma; EMT: epithelial-mesenchymal transition

Home

Download

Statistics

Help

Contact

Center for Computational Systems Medicine
leaf

Gene summary

leaf

Malignant transformation analysis

leaf

Malignant transformation related pathway analysis

leaf

Cell-cell communication analysis

leaf

Single-cell gene regulatory network inference analysis

leaf

Somatic mutation of malignant transformation related genes

leaf

Related drugs of malignant transformation related genes

Gene: FBL

Gene summary for FBL

check button Gene summary.

Gene informationSpeciesHuman
Gene symbol

FBL

Gene ID

2091

Gene namefibrillarin
Gene AliasFIB
Cytomap19q13.2
Gene Typeprotein-coding
GO ID

GO:0000154

UniProtAcc

P22087


Top

Malignant transformation analysis

check button Identification of the aberrant gene expression in precancerous and cancerous lesions by comparing the gene expression of stem-like cells in diseased tissues with normal stem cells
check button Malignant transformation involving gene list.
Entrez IDSymbolReplicatesSpeciesOrganTissueAdj P-valueLog2FCMalignancy
2091FBLGSM4909285HumanBreastIDC1.42e-286.19e-010.21
2091FBLGSM4909286HumanBreastIDC3.90e-295.57e-010.1081
2091FBLGSM4909294HumanBreastIDC5.93e-04-2.37e-010.2022
2091FBLGSM4909296HumanBreastIDC5.16e-08-1.82e-020.1524
2091FBLGSM4909297HumanBreastIDC1.90e-13-3.35e-010.1517
2091FBLGSM4909311HumanBreastIDC2.45e-34-2.29e-010.1534
2091FBLGSM4909312HumanBreastIDC4.97e-10-1.24e-020.1552
2091FBLGSM4909319HumanBreastIDC5.59e-33-3.80e-010.1563
2091FBLGSM4909320HumanBreastIDC2.12e-04-2.10e-010.1575
2091FBLGSM4909321HumanBreastIDC5.24e-12-1.69e-010.1559
2091FBLbrca3HumanBreastPrecancer2.80e-025.33e-02-0.0263
2091FBLNCCBC14HumanBreastDCIS3.24e-11-3.32e-010.2021
2091FBLNCCBC3HumanBreastDCIS2.67e-02-9.59e-020.1198
2091FBLNCCBC5HumanBreastDCIS4.86e-10-2.11e-010.2046
2091FBLP1HumanBreastIDC9.52e-20-4.29e-010.1527
2091FBLDCIS2HumanBreastDCIS5.31e-509.70e-050.0085
2091FBLHTA11_3410_2000001011HumanColorectumAD1.57e-569.71e-010.0155
2091FBLHTA11_2487_2000001011HumanColorectumSER1.73e-217.91e-01-0.1808
2091FBLHTA11_2951_2000001011HumanColorectumAD6.92e-171.15e+000.0216
2091FBLHTA11_1938_2000001011HumanColorectumAD7.77e-308.98e-01-0.0811
Page: 1 2 3 4 5 6 7 8 9 10 11 12 

check button Transcriptomic changes along malignancy continuum.
TissueExpression DynamicsAbbreviation
BreastThe image shows the transcriptomic changes along malignancy continuum.log2FC in expression of this searched gene in stem-like cells from each diseased tissue sample relative to stem-like cells in normal samples in each tissue plotted against the malignancy continuum. Samples are colored based on if they are from different disease stage.IDC: Invasive ductal carcinoma
DCIS: Ductal carcinoma in situ
Precancer(BRCA1-mut): Precancerous lesion from BRCA1 mutation carriers
Colorectum (GSE201348)The image shows the transcriptomic changes along malignancy continuum.log2FC in expression of this searched gene in stem-like cells from each diseased tissue sample relative to stem-like cells in normal samples in each tissue plotted against the malignancy continuum. Samples are colored based on if they are from different disease stage.
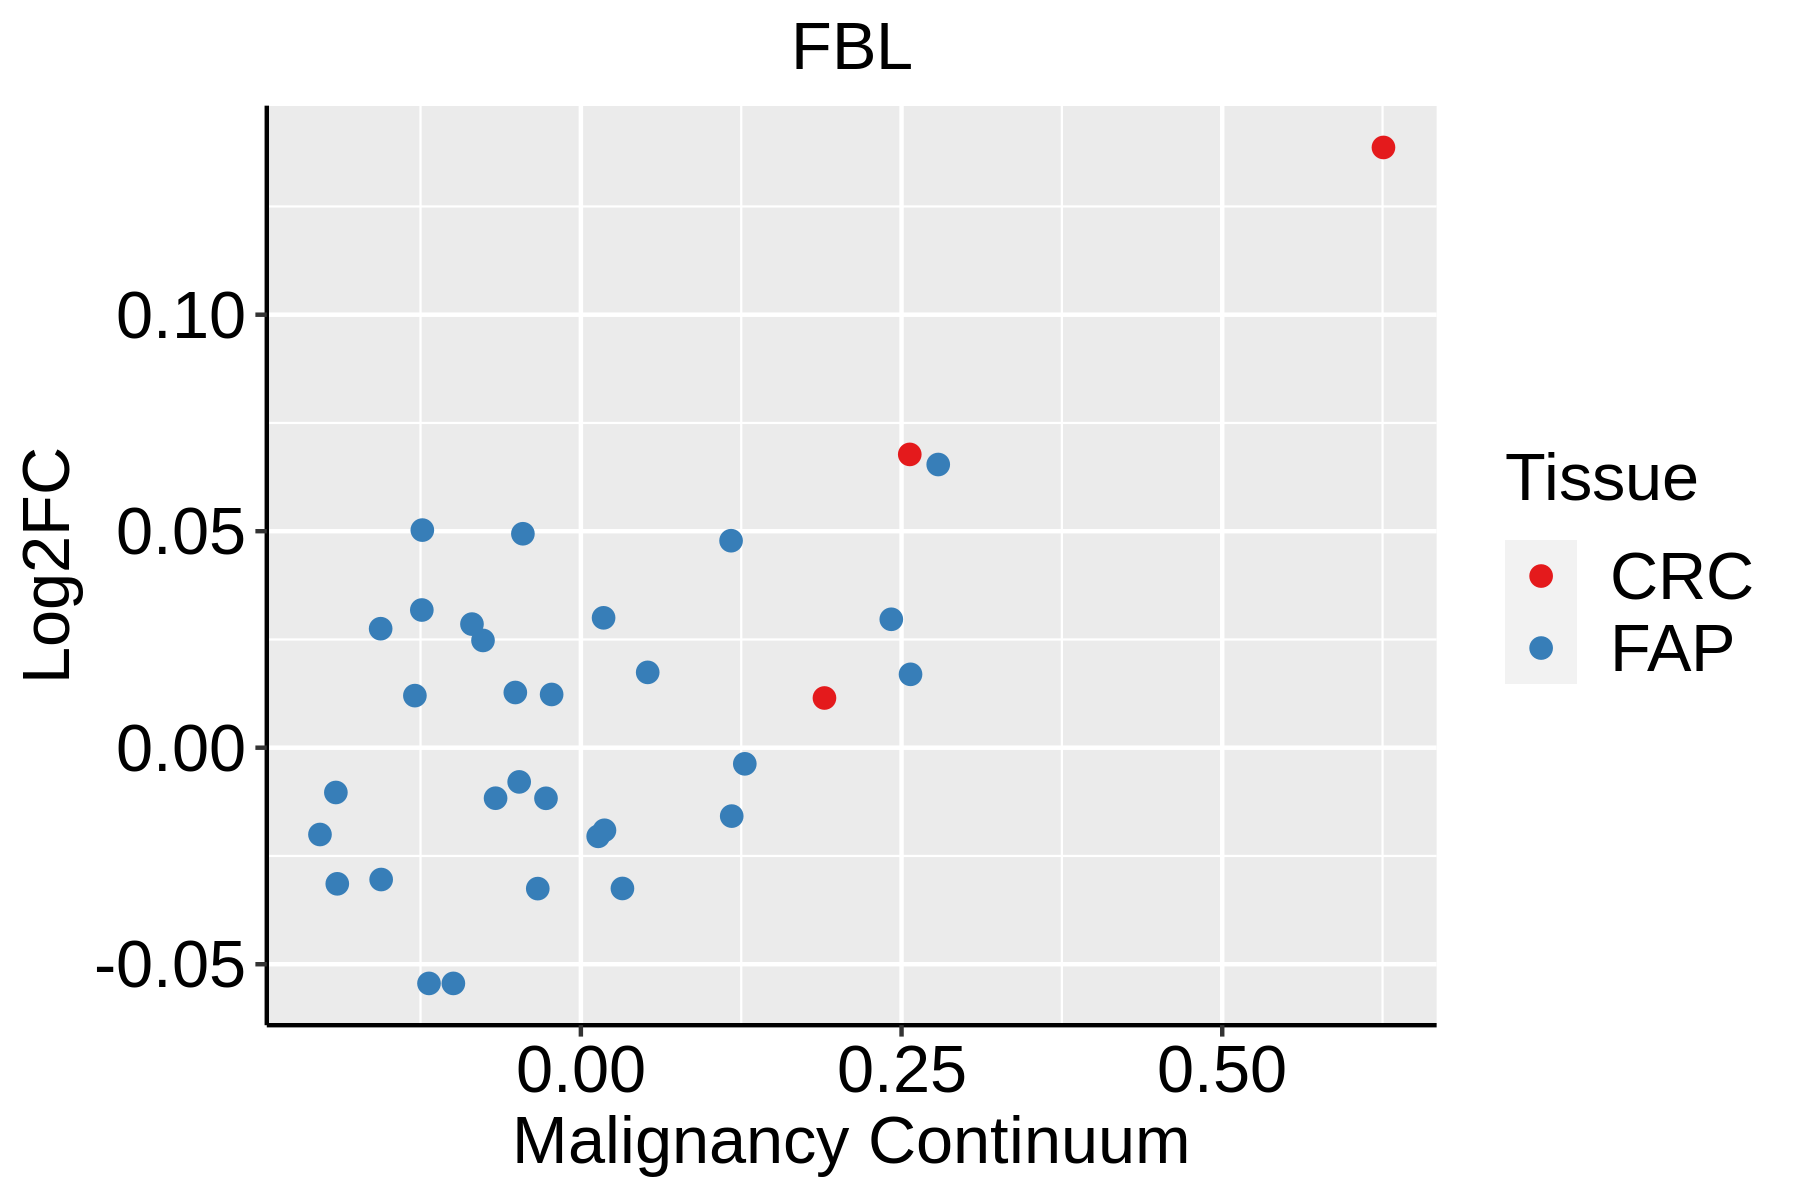
FAP: Familial adenomatous polyposis
CRC: Colorectal cancer
Colorectum (HTA11)The image shows the transcriptomic changes along malignancy continuum.log2FC in expression of this searched gene in stem-like cells from each diseased tissue sample relative to stem-like cells in normal samples in each tissue plotted against the malignancy continuum. Samples are colored based on if they are from different disease stage.AD: Adenomas
SER: Sessile serrated lesions
MSI-H: Microsatellite-high colorectal cancer
MSS: Microsatellite stable colorectal cancer
EndometriumThe image shows the transcriptomic changes along malignancy continuum.log2FC in expression of this searched gene in stem-like cells from each diseased tissue sample relative to stem-like cells in normal samples in each tissue plotted against the malignancy continuum. Samples are colored based on if they are from different disease stage.
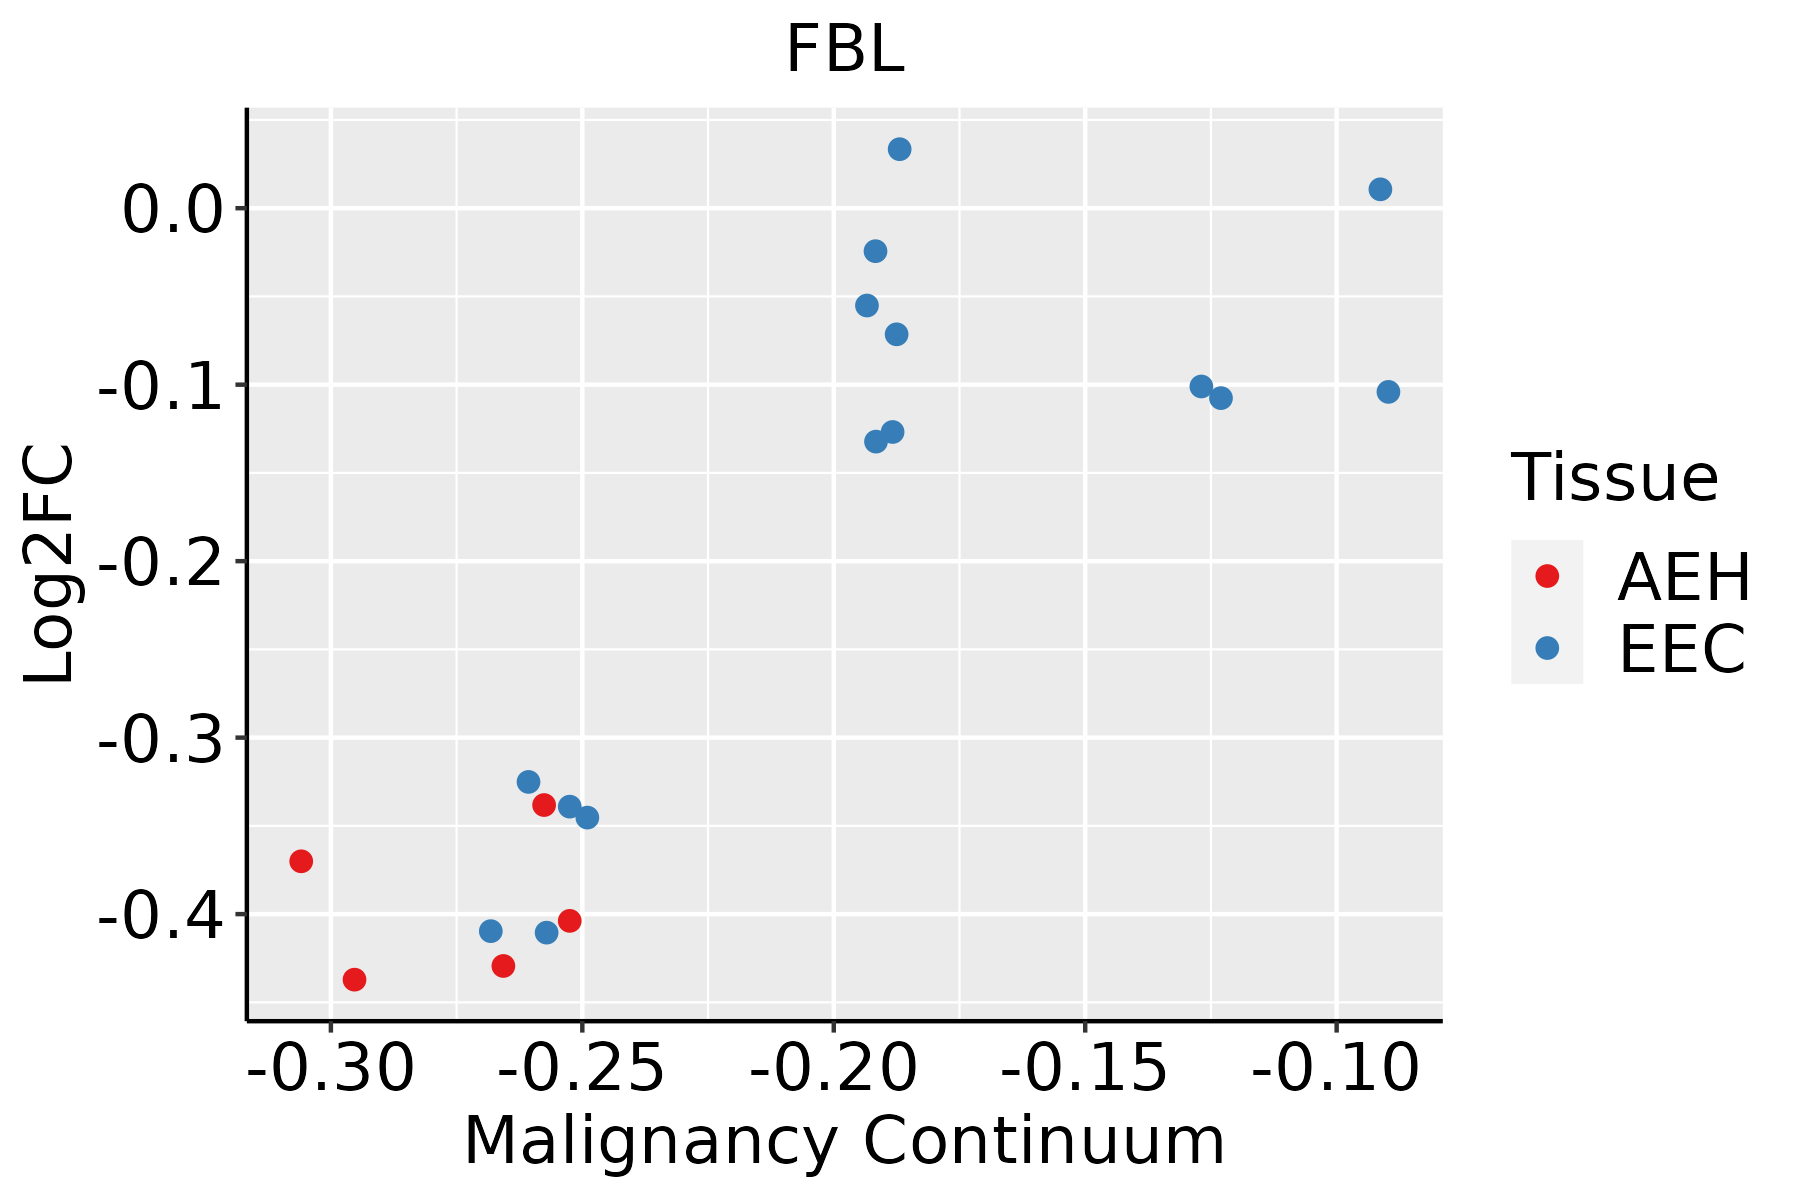
AEH: Atypical endometrial hyperplasia
EEC: Endometrioid Cancer
EsophagusThe image shows the transcriptomic changes along malignancy continuum.log2FC in expression of this searched gene in stem-like cells from each diseased tissue sample relative to stem-like cells in normal samples in each tissue plotted against the malignancy continuum. Samples are colored based on if they are from different disease stage.
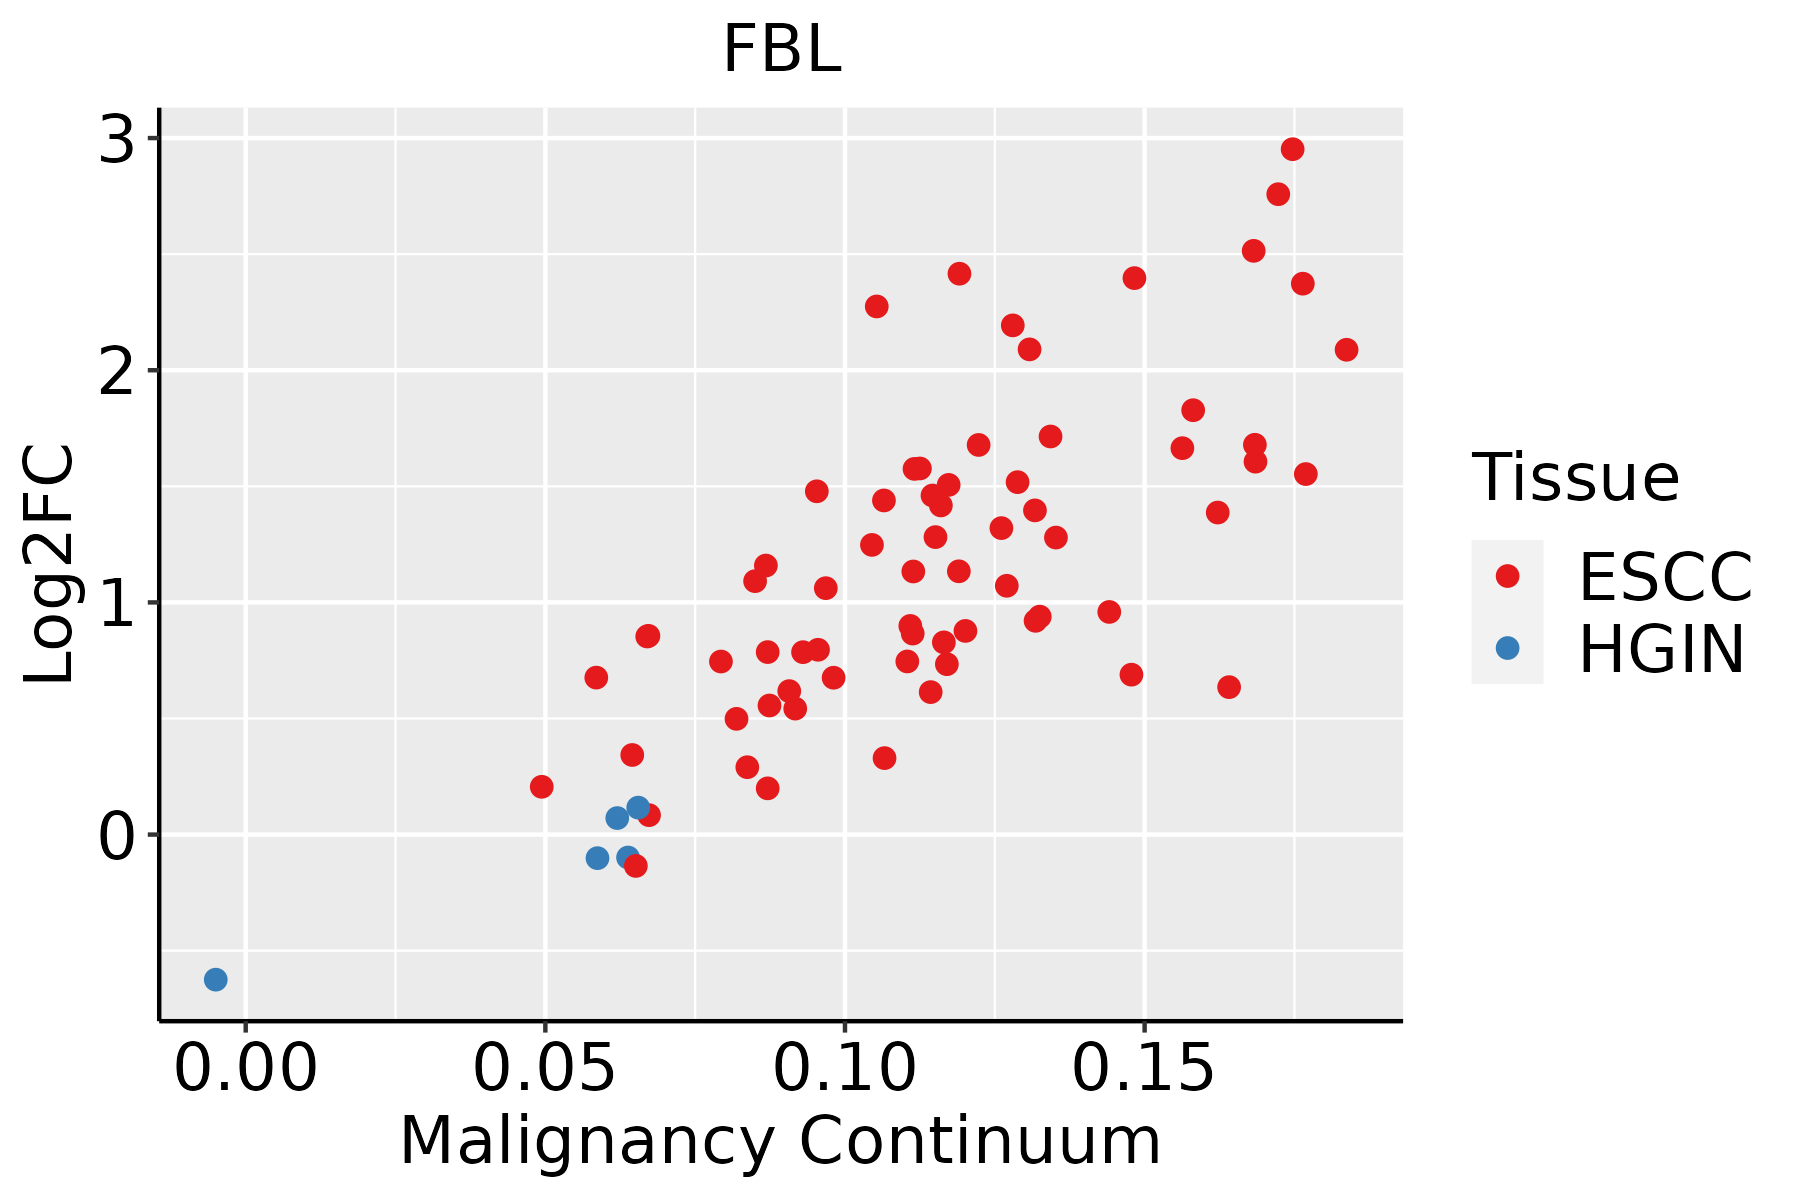
ESCC: Esophageal squamous cell carcinoma
HGIN: High-grade intraepithelial neoplasias
LGIN: Low-grade intraepithelial neoplasias
LiverThe image shows the transcriptomic changes along malignancy continuum.log2FC in expression of this searched gene in stem-like cells from each diseased tissue sample relative to stem-like cells in normal samples in each tissue plotted against the malignancy continuum. Samples are colored based on if they are from different disease stage.
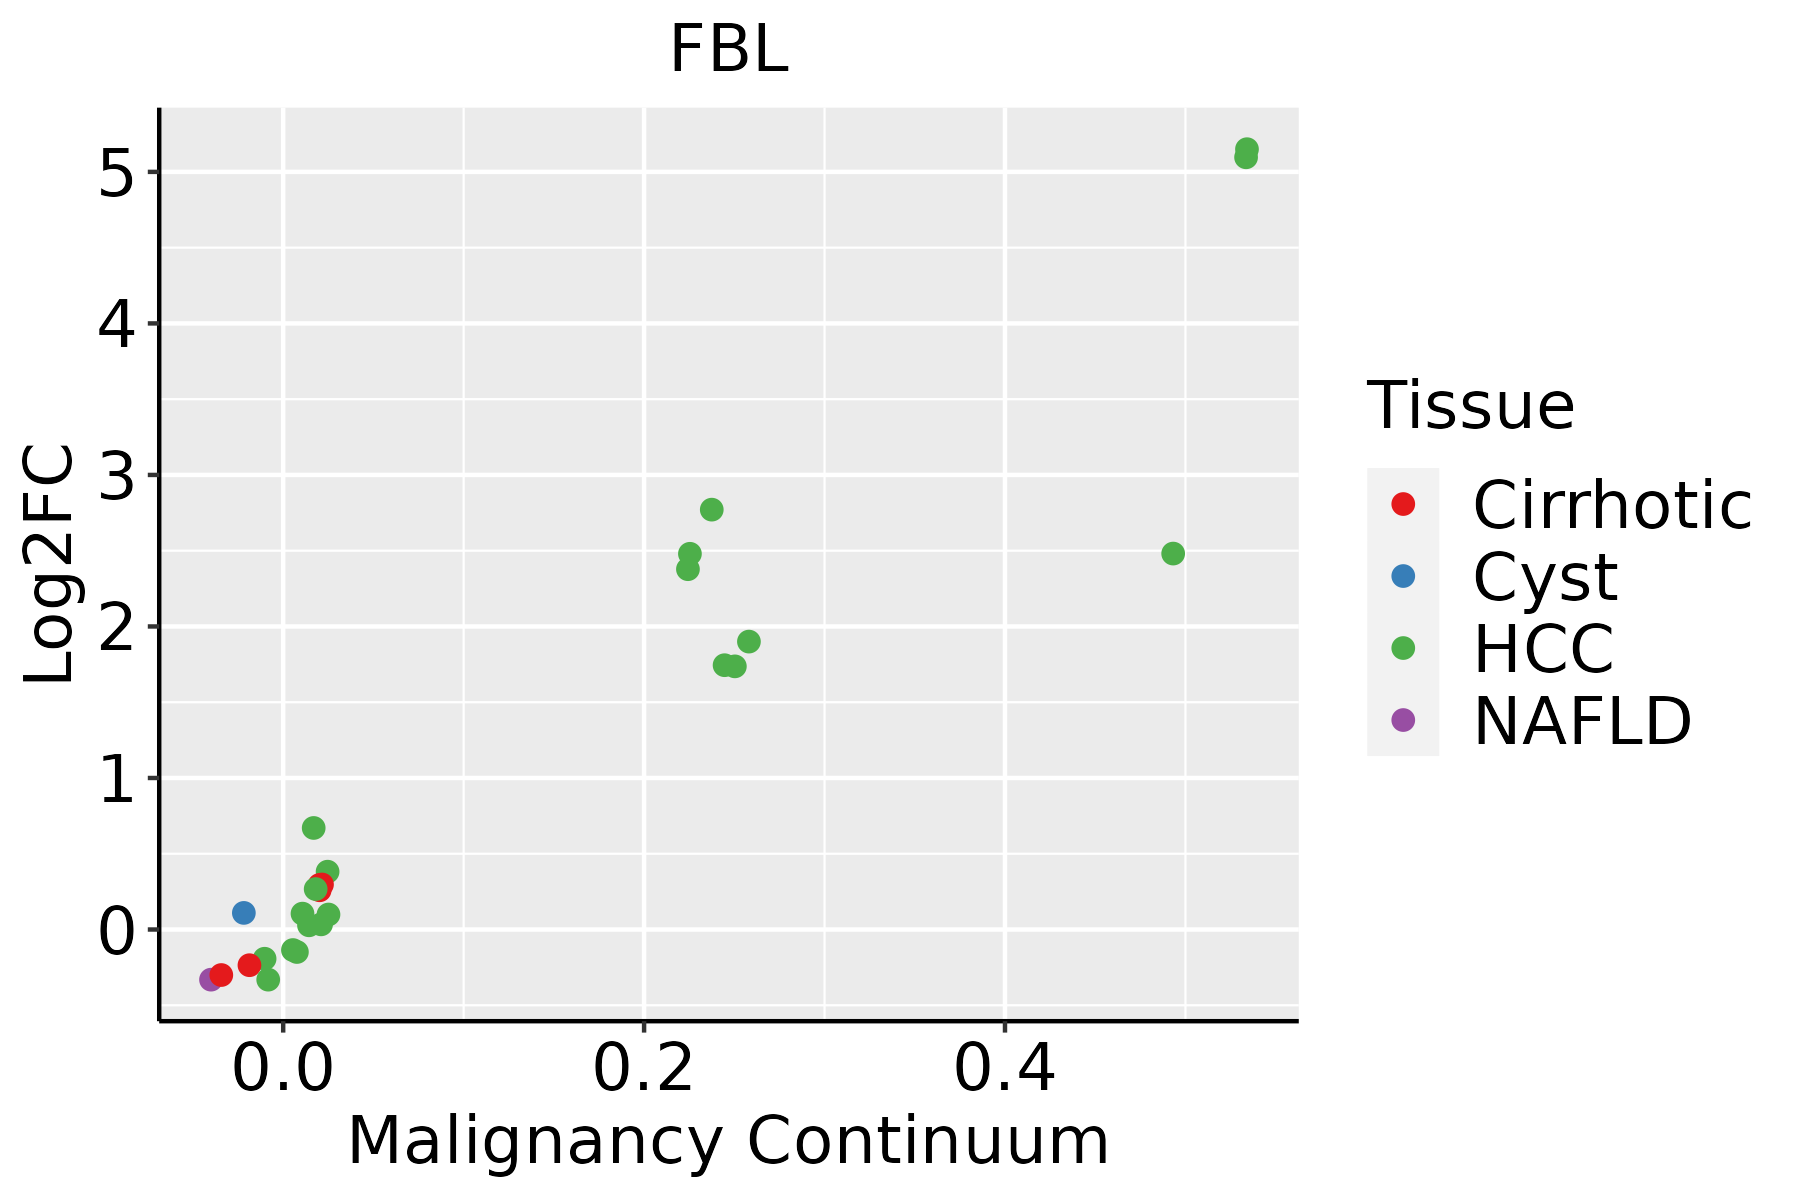
HCC: Hepatocellular carcinoma
NAFLD: Non-alcoholic fatty liver disease
Oral CavityThe image shows the transcriptomic changes along malignancy continuum.log2FC in expression of this searched gene in stem-like cells from each diseased tissue sample relative to stem-like cells in normal samples in each tissue plotted against the malignancy continuum. Samples are colored based on if they are from different disease stage.
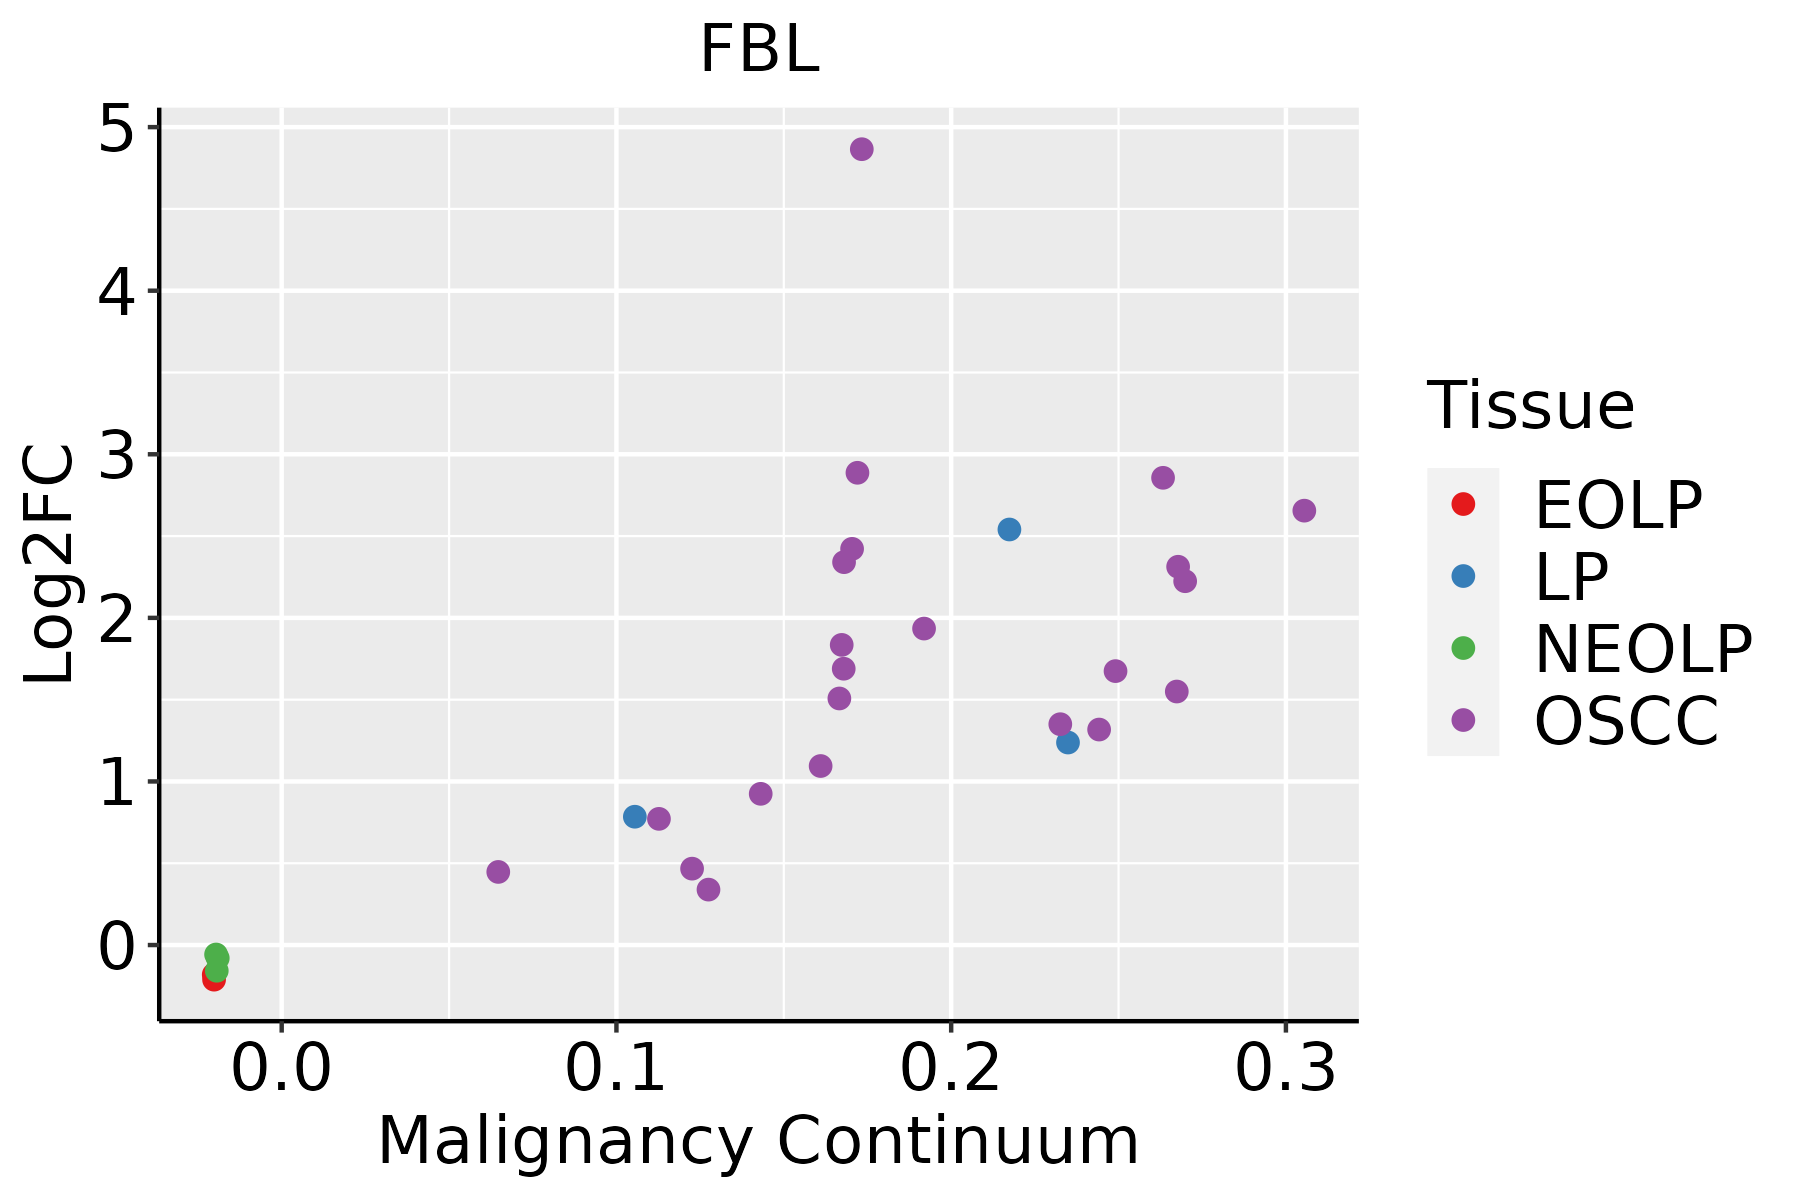
EOLP: Erosive Oral lichen planus
LP: leukoplakia
NEOLP: Non-erosive oral lichen planus
OSCC: Oral squamous cell carcinoma
ProstateThe image shows the transcriptomic changes along malignancy continuum.log2FC in expression of this searched gene in stem-like cells from each diseased tissue sample relative to stem-like cells in normal samples in each tissue plotted against the malignancy continuum. Samples are colored based on if they are from different disease stage.
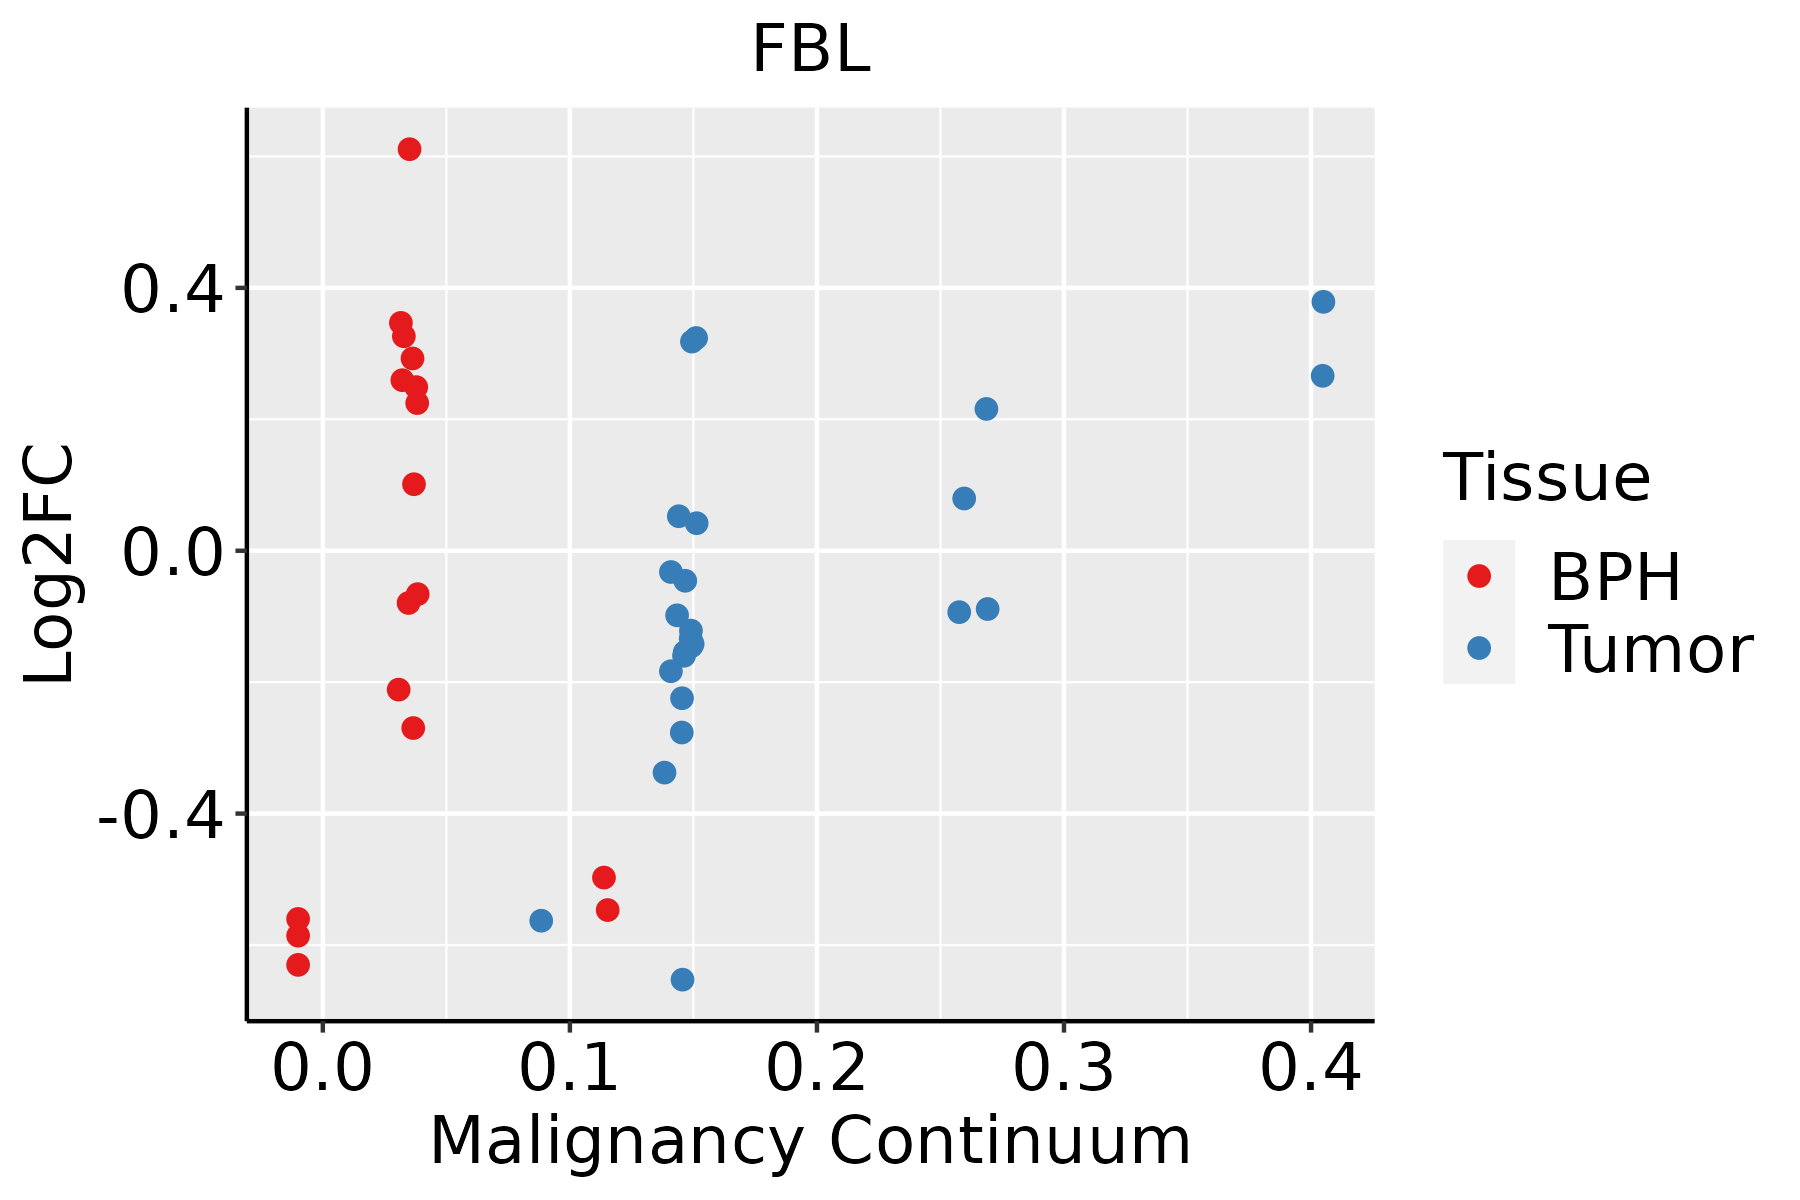
BPH: Benign Prostatic Hyperplasia
SkinThe image shows the transcriptomic changes along malignancy continuum.log2FC in expression of this searched gene in stem-like cells from each diseased tissue sample relative to stem-like cells in normal samples in each tissue plotted against the malignancy continuum. Samples are colored based on if they are from different disease stage.
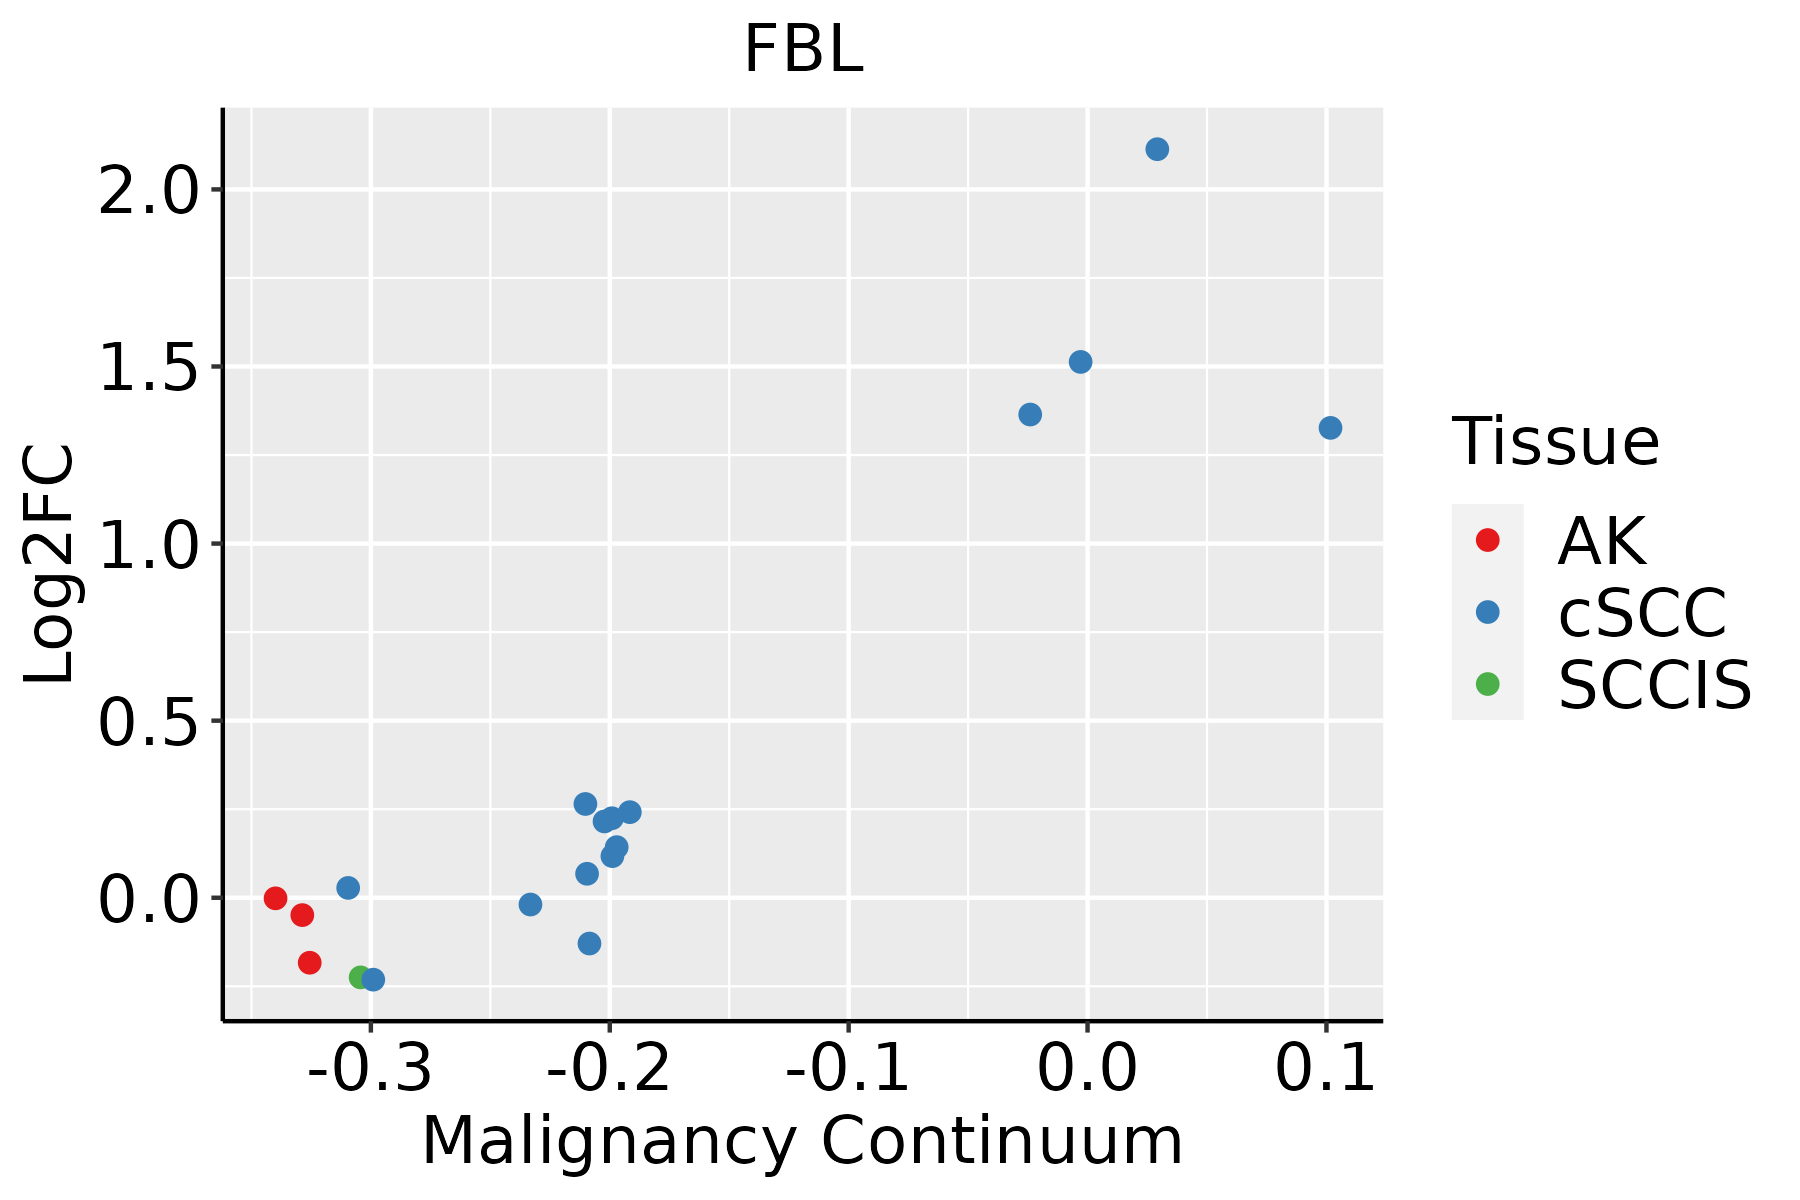
AK: Actinic keratosis
cSCC: Cutaneous squamous cell carcinoma
SCCIS:squamous cell carcinoma in situ
ThyroidThe image shows the transcriptomic changes along malignancy continuum.log2FC in expression of this searched gene in stem-like cells from each diseased tissue sample relative to stem-like cells in normal samples in each tissue plotted against the malignancy continuum. Samples are colored based on if they are from different disease stage.ATC: Anaplastic thyroid cancer
HT: Hashimoto's thyroiditis
PTC: Papillary thyroid cancer
∗log2FC in expression of this searched gene in stem-like cells from each diseased tissue sample relative to stem-like cells in normal samples in each tissue plotted against the malignancy continuum. Samples are colored based on if they are from different disease stage.

Top

Malignant transformation related pathway analysis

check buttonFind out the enriched GO biological processes and KEGG pathways involved in transition from healthy to precancer to cancer
check button Figure of enriched GO biological processes.
TissueDisease StageEnriched GO biological Processes
ColorectumADGO analysis - Figure of enriched GO biological processes: Top 15 enriched GO BP terms are showed in the bar plot of each disease state in each tissue. Each row represents a significant GO biological process which is colored according to the -log10(p.adjust).
ColorectumSERGO analysis - Figure of enriched GO biological processes: Top 15 enriched GO BP terms are showed in the bar plot of each disease state in each tissue. Each row represents a significant GO biological process which is colored according to the -log10(p.adjust).
ColorectumMSSGO analysis - Figure of enriched GO biological processes: Top 15 enriched GO BP terms are showed in the bar plot of each disease state in each tissue. Each row represents a significant GO biological process which is colored according to the -log10(p.adjust).
ColorectumMSI-HGO analysis - Figure of enriched GO biological processes: Top 15 enriched GO BP terms are showed in the bar plot of each disease state in each tissue. Each row represents a significant GO biological process which is colored according to the -log10(p.adjust).
ColorectumFAPGO analysis - Figure of enriched GO biological processes: Top 15 enriched GO BP terms are showed in the bar plot of each disease state in each tissue. Each row represents a significant GO biological process which is colored according to the -log10(p.adjust).
∗Top 15 enriched GO BP terms are showed in the bar plot of each disease state in each tissue. Each row represents a significant GO biological process which is colored according to the -log10(p.adjust).
Page: 1 2 3 4 5 6 7 8 9 

check button Enriched GO biological processes.
GO IDTissueDisease StageDescriptionGene RatioBg Ratiopvaluep.adjustCount
GO:003158922LiverHCCcell-substrate adhesion188/7958363/187232.00e-041.55e-03188
GO:00075962LiverHCCblood coagulation118/7958217/187232.63e-041.94e-03118
GO:00075992LiverHCChemostasis119/7958222/187235.25e-043.41e-03119
GO:00434097LiverHCCnegative regulation of MAPK cascade98/7958180/187237.88e-044.74e-0398
GO:00508172LiverHCCcoagulation118/7958222/187238.41e-045.03e-03118
GO:005087822LiverHCCregulation of body fluid levels191/7958379/187231.06e-036.11e-03191
GO:00723762LiverHCCprotein activation cascade10/795812/187234.79e-032.02e-0210
GO:00107711LiverHCCnegative regulation of cell morphogenesis involved in differentiation11/795814/187236.81e-032.73e-0211
GO:19000251LiverHCCnegative regulation of substrate adhesion-dependent cell spreading11/795814/187236.81e-032.73e-0211
GO:00075651LiverHCCfemale pregnancy99/7958193/187238.24e-033.23e-0299
GO:000164911LiverHCCosteoblast differentiation115/7958229/187231.08e-023.99e-02115
GO:002261320Oral cavityOSCCribonucleoprotein complex biogenesis333/7305463/187238.28e-485.24e-44333
GO:004225420Oral cavityOSCCribosome biogenesis230/7305299/187233.22e-416.80e-38230
GO:000636410Oral cavityOSCCrRNA processing172/7305225/187231.57e-301.24e-27172
GO:00344709Oral cavityOSCCncRNA processing263/7305395/187234.38e-292.78e-26263
GO:001607210Oral cavityOSCCrRNA metabolic process176/7305236/187236.51e-293.24e-26176
GO:000640318Oral cavityOSCCRNA localization150/7305201/187236.90e-251.98e-22150
GO:00346605Oral cavityOSCCncRNA metabolic process296/7305485/187232.94e-236.65e-21296
GO:004586220Oral cavityOSCCpositive regulation of proteolysis236/7305372/187236.53e-221.38e-19236
GO:000697920Oral cavityOSCCresponse to oxidative stress273/7305446/187238.35e-221.65e-19273
Page: 1 2 3 4 5 6 7 8 9 10 11 12 13 14 15 16 17 18 19 20 21 22 23 24 25 26 27 28 29 30 31 32 33 34 35 36 37 38 39 40 

check button Enriched KEGG pathways.
Pathway IDTissueDisease StageDescriptionGene RatioBg Ratiopvaluep.adjustqvalueCount
Page: 1 

Top

Cell-cell communication analysis

check buttonIdentification of potential cell-cell interactions between two cell types and their ligand-receptor pairs for different disease states
LigandReceptorLRpairPathwayTissueDisease Stage
Page: 1 

Top

Single-cell gene regulatory network inference analysis

check buttonFind out the significant the regulons (TFs) and the target genes of each regulon across cell types for different disease states
TFCell TypeTissueDisease StageTarget GeneRSSRegulon Activity
∗The dot plots of a searched regulon are shown for all cell subpopulations in each disease state of each tissue based on the regulon specific score inferred using pySCENIC and by calculating the average expression.
Page: 1 

Top

Somatic mutation of malignant transformation related genes

check buttonAnnotation of somatic variants for genes involved in malignant transformation
Hugo SymbolVariant ClassVariant ClassificationdbSNP RSHGVScHGVSpHGVSp ShortSWISSPROTBIOTYPESIFTPolyPhenTumor Sample BarcodeTissueHistologySexAgeStageTherapy TypesDrugsOutcome
FBLSNVMissense_Mutationc.823N>Ap.Ala275Thrp.A275TP22087protein_codingtolerated(0.08)benign(0.375)TCGA-A8-A09Z-01Breastbreast invasive carcinomaFemale>=65I/IIUnknownUnknownSD
FBLSNVMissense_Mutationnovelc.214N>Gp.Arg72Glyp.R72GP22087protein_codingtolerated(0.88)benign(0)TCGA-BH-A0BL-01Breastbreast invasive carcinomaFemale<65I/IIChemotherapyadriamycinCR
FBLSNVMissense_Mutationc.637N>Tp.Val213Leup.V213LP22087protein_codingdeleterious(0)benign(0.015)TCGA-D8-A13Z-01Breastbreast invasive carcinomaFemale<65I/IIChemotherapydoxorubicineSD
FBLSNVMissense_Mutationrs754522515c.653N>Ap.Arg218Glnp.R218QP22087protein_codingdeleterious(0.02)possibly_damaging(0.872)TCGA-E2-A152-01Breastbreast invasive carcinomaFemale<65I/IITargeted Molecular therapytrastuzumabPD
FBLinsertionIn_Frame_Insnovelc.400_401insTCCAACACATGAACTTTGGGGGACACACTAGAACCGTAGp.Tyr134delinsPheGlnHisMetAsnPheGlyGlyHisThrArgThrValAspp.Y134delinsFQHMNFGGHTRTVDP22087protein_codingTCGA-A8-A0A6-01Breastbreast invasive carcinomaFemale<65III/IVChemotherapyepirubicinCR
FBLSNVMissense_Mutationc.206A>Tp.Asn69Ilep.N69IP22087protein_codingtolerated(0.12)benign(0.001)TCGA-AA-3672-01Colorectumcolon adenocarcinomaFemale>=65III/IVUnknownUnknownSD
FBLSNVMissense_Mutationrs762429726c.61C>Tp.Arg21Cysp.R21CP22087protein_codingtolerated_low_confidence(0.06)possibly_damaging(0.876)TCGA-AA-3864-01Colorectumcolon adenocarcinomaMale>=65I/IIUnknownUnknownSD
FBLSNVMissense_Mutationnovelc.960G>Tp.Lys320Asnp.K320NP22087protein_codingdeleterious_low_confidence(0)possibly_damaging(0.855)TCGA-CA-6717-01Colorectumcolon adenocarcinomaMale<65I/IIChemotherapyoxaliplatinCR
FBLSNVMissense_Mutationc.476N>Gp.Pro159Argp.P159RP22087protein_codingdeleterious(0.02)possibly_damaging(0.841)TCGA-CK-4951-01Colorectumcolon adenocarcinomaFemale>=65I/IIUnknownUnknownPD
FBLSNVMissense_Mutationnovelc.445C>Ap.Leu149Metp.L149MP22087protein_codingtolerated(0.11)possibly_damaging(0.535)TCGA-CM-6171-01Colorectumcolon adenocarcinomaFemale>=65I/IIUnknownUnknownSD
Page: 1 2 3 4 

Top

Related drugs of malignant transformation related genes

check buttonIdentification of chemicals and drugs interact with genes involved in malignant transfromation
(DGIdb 4.0)
Entrez IDSymbolCategoryInteraction TypesDrug Claim NameDrug NamePMIDs
Page: 1