Schematic overview of the cellular and molecular mechanisms involved in the cancer progression, including the proposed cellular and molecular mechanisms in cancer cells trajectory. AT1: alveolar type 1 cells; AT2: alveolar type 2 cells; AAH: atypical adenomatous hyperplasia; AIS: adenocarcinoma in situ; MIA: minimally invasive adenocarcinoma; IA: invasive adenocarcinoma; EMT: epithelial-mesenchymal transition

Home

Download

Statistics

Help

Contact

Center for Computational Systems Medicine
leaf

Gene summary

leaf

Malignant transformation analysis

leaf

Malignant transformation related pathway analysis

leaf

Cell-cell communication analysis

leaf

Single-cell gene regulatory network inference analysis

leaf

Somatic mutation of malignant transformation related genes

leaf

Related drugs of malignant transformation related genes

Gene: DBN1

Gene summary for DBN1

check button Gene summary.

Gene informationSpeciesHuman
Gene symbol

DBN1

Gene ID

1627

Gene namedrebrin 1
Gene AliasD0S117E
Cytomap5q35.3
Gene Typeprotein-coding
GO ID

GO:0000902

UniProtAcc

Q16643


Top

Malignant transformation analysis

check button Identification of the aberrant gene expression in precancerous and cancerous lesions by comparing the gene expression of stem-like cells in diseased tissues with normal stem cells
check button Malignant transformation involving gene list.
Entrez IDSymbolReplicatesSpeciesOrganTissueAdj P-valueLog2FCMalignancy
1627DBN1LZE4THumanEsophagusESCC1.89e-143.86e-010.0811
1627DBN1LZE7THumanEsophagusESCC3.76e-046.40e-010.0667
1627DBN1LZE8THumanEsophagusESCC1.52e-093.50e-010.067
1627DBN1LZE20THumanEsophagusESCC1.68e-031.40e-010.0662
1627DBN1LZE22THumanEsophagusESCC2.97e-043.16e-010.068
1627DBN1LZE24THumanEsophagusESCC1.95e-165.57e-010.0596
1627DBN1LZE21THumanEsophagusESCC4.59e-022.53e-010.0655
1627DBN1LZE6THumanEsophagusESCC9.90e-043.64e-010.0845
1627DBN1P1T-EHumanEsophagusESCC4.33e-043.36e-010.0875
1627DBN1P2T-EHumanEsophagusESCC5.03e-519.52e-010.1177
1627DBN1P4T-EHumanEsophagusESCC1.31e-327.53e-010.1323
1627DBN1P5T-EHumanEsophagusESCC3.03e-274.87e-010.1327
1627DBN1P8T-EHumanEsophagusESCC9.57e-081.73e-010.0889
1627DBN1P9T-EHumanEsophagusESCC1.31e-143.95e-010.1131
1627DBN1P10T-EHumanEsophagusESCC4.09e-325.94e-010.116
1627DBN1P11T-EHumanEsophagusESCC4.66e-221.15e+000.1426
1627DBN1P12T-EHumanEsophagusESCC3.61e-429.61e-010.1122
1627DBN1P15T-EHumanEsophagusESCC2.08e-419.34e-010.1149
1627DBN1P16T-EHumanEsophagusESCC8.07e-357.55e-010.1153
1627DBN1P17T-EHumanEsophagusESCC3.68e-084.76e-010.1278
Page: 1 2 3 4 5 

check button Transcriptomic changes along malignancy continuum.
TissueExpression DynamicsAbbreviation
EsophagusThe image shows the transcriptomic changes along malignancy continuum.log2FC in expression of this searched gene in stem-like cells from each diseased tissue sample relative to stem-like cells in normal samples in each tissue plotted against the malignancy continuum. Samples are colored based on if they are from different disease stage.ESCC: Esophageal squamous cell carcinoma
HGIN: High-grade intraepithelial neoplasias
LGIN: Low-grade intraepithelial neoplasias
LiverThe image shows the transcriptomic changes along malignancy continuum.log2FC in expression of this searched gene in stem-like cells from each diseased tissue sample relative to stem-like cells in normal samples in each tissue plotted against the malignancy continuum. Samples are colored based on if they are from different disease stage.HCC: Hepatocellular carcinoma
NAFLD: Non-alcoholic fatty liver disease
Oral CavityThe image shows the transcriptomic changes along malignancy continuum.log2FC in expression of this searched gene in stem-like cells from each diseased tissue sample relative to stem-like cells in normal samples in each tissue plotted against the malignancy continuum. Samples are colored based on if they are from different disease stage.
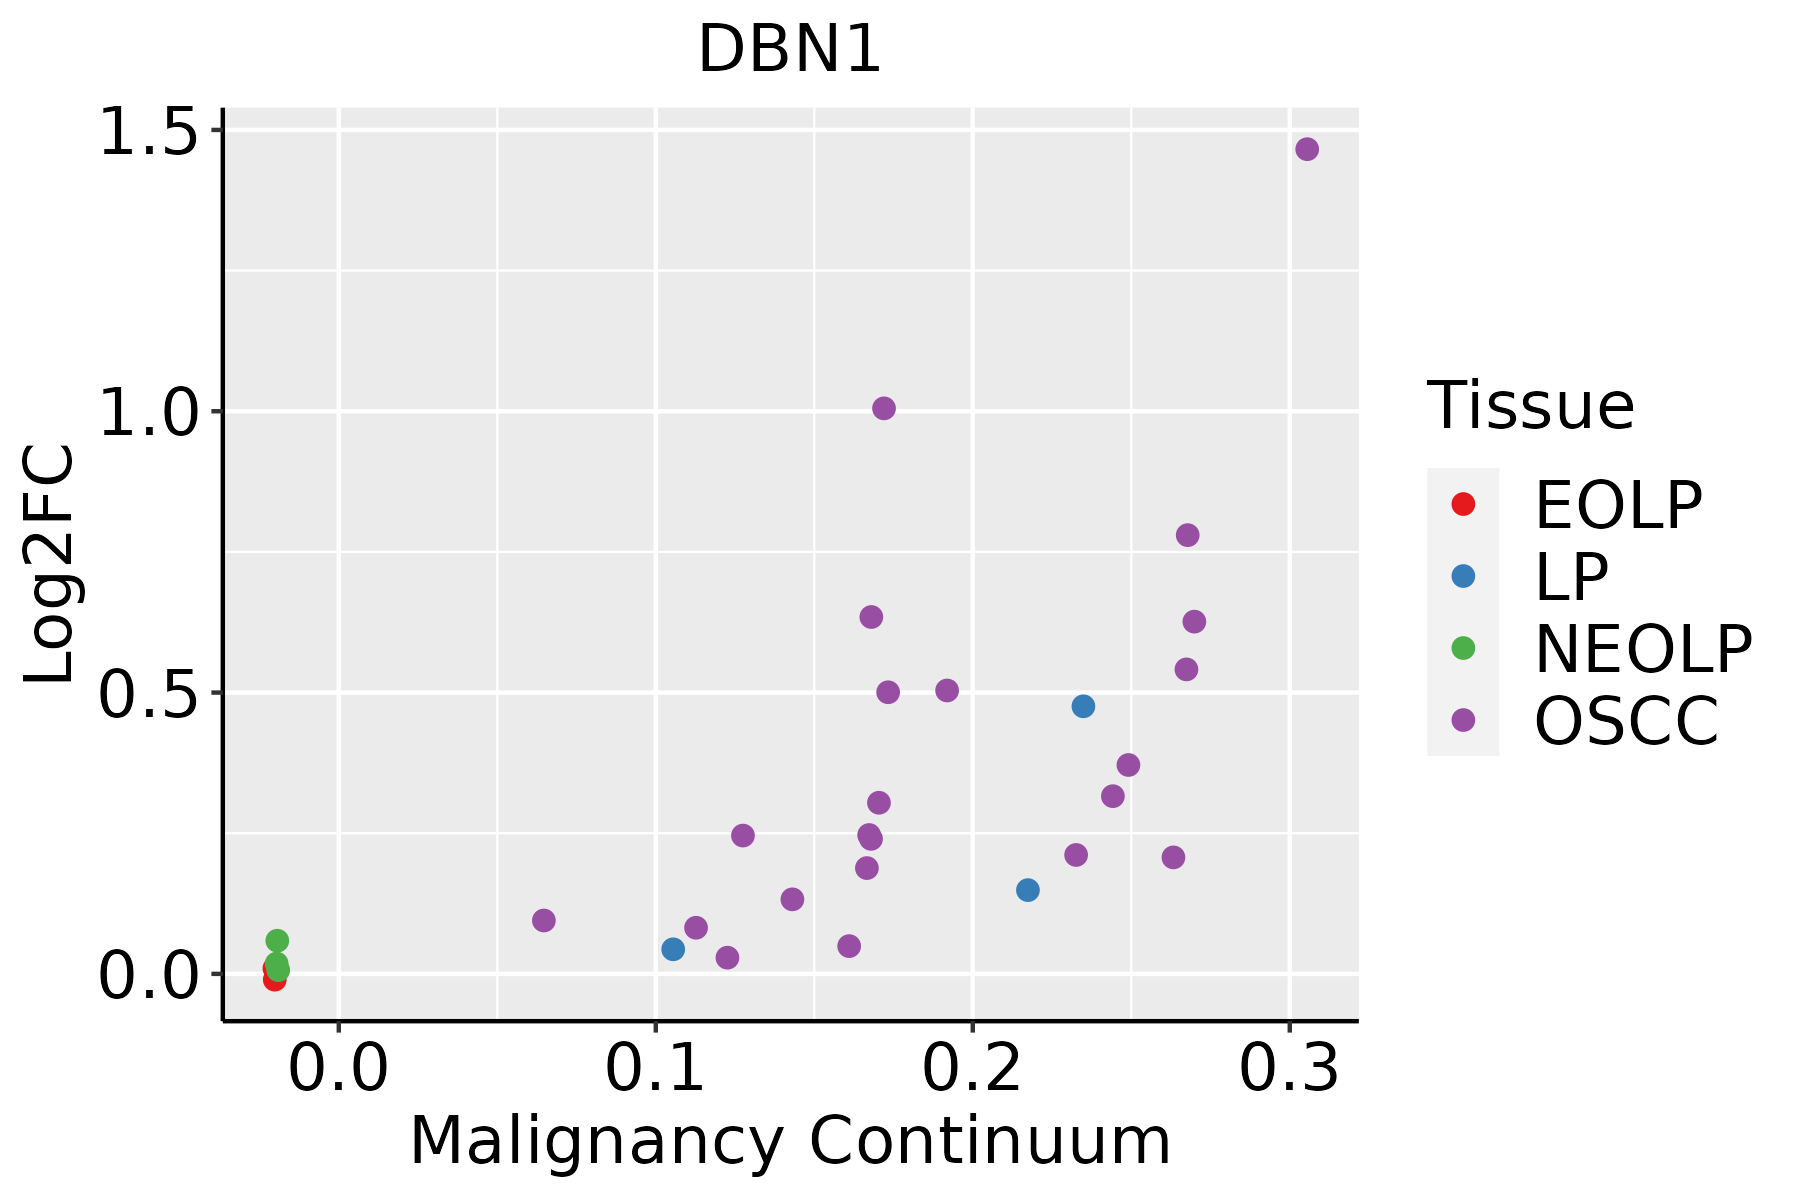
EOLP: Erosive Oral lichen planus
LP: leukoplakia
NEOLP: Non-erosive oral lichen planus
OSCC: Oral squamous cell carcinoma
SkinThe image shows the transcriptomic changes along malignancy continuum.log2FC in expression of this searched gene in stem-like cells from each diseased tissue sample relative to stem-like cells in normal samples in each tissue plotted against the malignancy continuum. Samples are colored based on if they are from different disease stage.
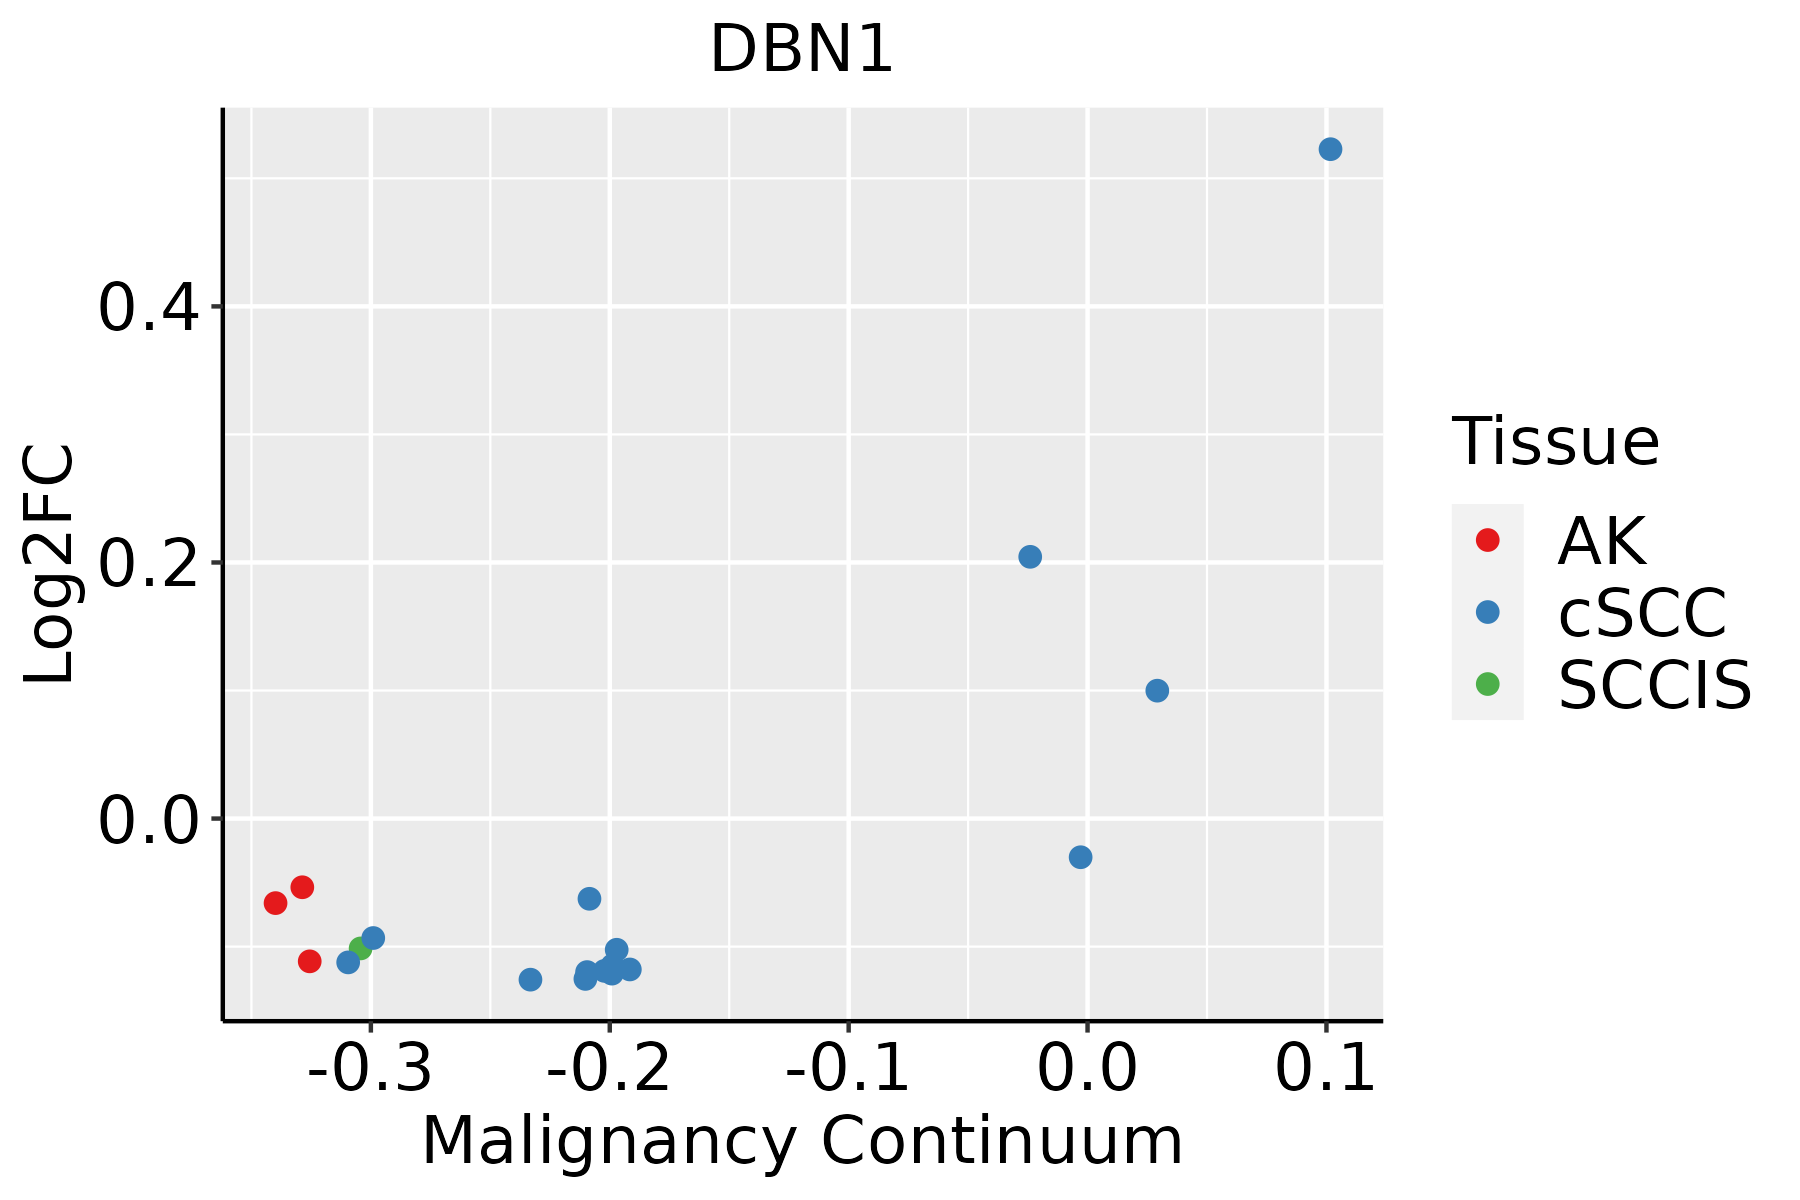
AK: Actinic keratosis
cSCC: Cutaneous squamous cell carcinoma
SCCIS:squamous cell carcinoma in situ
ThyroidThe image shows the transcriptomic changes along malignancy continuum.log2FC in expression of this searched gene in stem-like cells from each diseased tissue sample relative to stem-like cells in normal samples in each tissue plotted against the malignancy continuum. Samples are colored based on if they are from different disease stage.
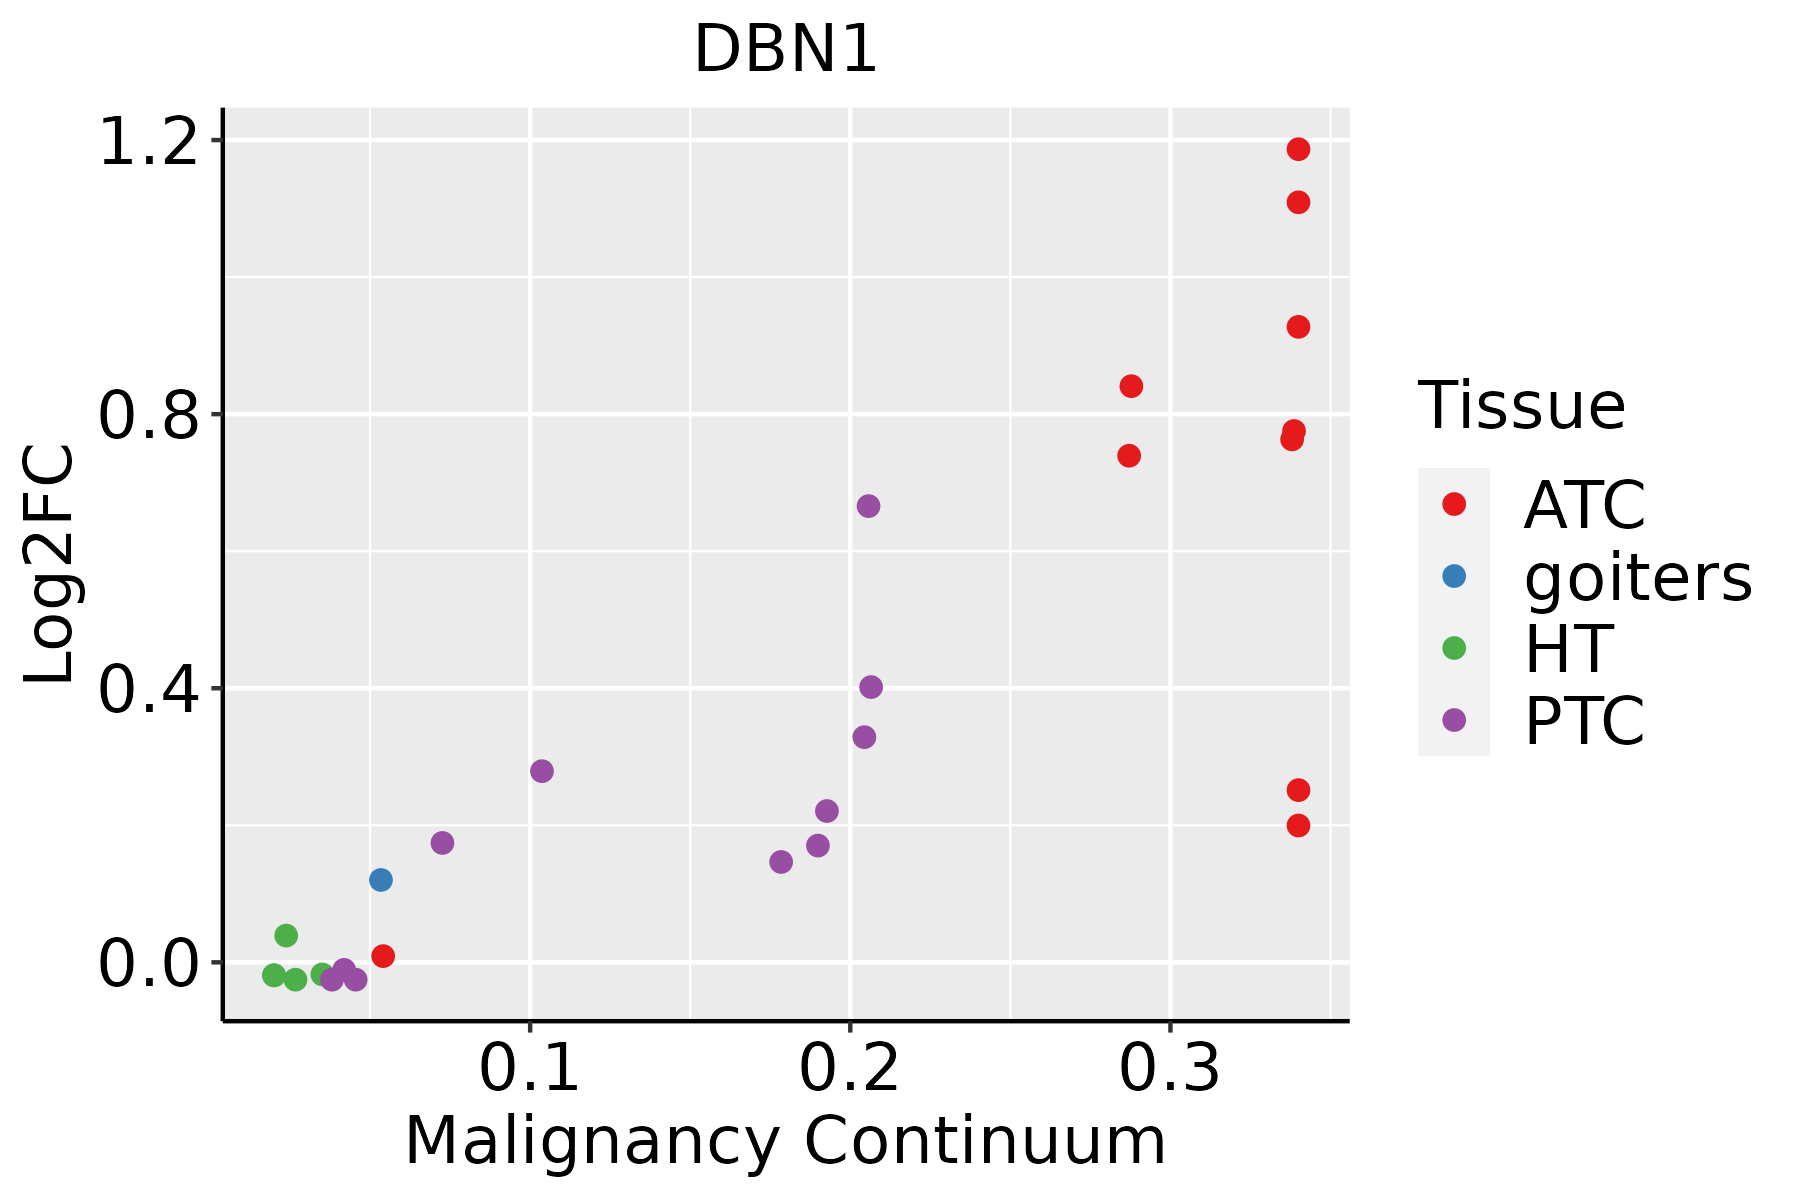
ATC: Anaplastic thyroid cancer
HT: Hashimoto's thyroiditis
PTC: Papillary thyroid cancer
∗log2FC in expression of this searched gene in stem-like cells from each diseased tissue sample relative to stem-like cells in normal samples in each tissue plotted against the malignancy continuum. Samples are colored based on if they are from different disease stage.

Top

Malignant transformation related pathway analysis

check buttonFind out the enriched GO biological processes and KEGG pathways involved in transition from healthy to precancer to cancer
check button Figure of enriched GO biological processes.
TissueDisease StageEnriched GO biological Processes
ColorectumADGO analysis - Figure of enriched GO biological processes: Top 15 enriched GO BP terms are showed in the bar plot of each disease state in each tissue. Each row represents a significant GO biological process which is colored according to the -log10(p.adjust).
ColorectumSERGO analysis - Figure of enriched GO biological processes: Top 15 enriched GO BP terms are showed in the bar plot of each disease state in each tissue. Each row represents a significant GO biological process which is colored according to the -log10(p.adjust).
ColorectumMSSGO analysis - Figure of enriched GO biological processes: Top 15 enriched GO BP terms are showed in the bar plot of each disease state in each tissue. Each row represents a significant GO biological process which is colored according to the -log10(p.adjust).
ColorectumMSI-HGO analysis - Figure of enriched GO biological processes: Top 15 enriched GO BP terms are showed in the bar plot of each disease state in each tissue. Each row represents a significant GO biological process which is colored according to the -log10(p.adjust).
ColorectumFAPGO analysis - Figure of enriched GO biological processes: Top 15 enriched GO BP terms are showed in the bar plot of each disease state in each tissue. Each row represents a significant GO biological process which is colored according to the -log10(p.adjust).
∗Top 15 enriched GO BP terms are showed in the bar plot of each disease state in each tissue. Each row represents a significant GO biological process which is colored according to the -log10(p.adjust).
Page: 1 2 3 4 5 6 7 8 9 

check button Enriched GO biological processes.
GO IDTissueDisease StageDescriptionGene RatioBg Ratiopvaluep.adjustCount
GO:001097614ThyroidATCpositive regulation of neuron projection development82/6293163/187237.43e-067.61e-0582
GO:005196221ThyroidATCpositive regulation of nervous system development126/6293272/187238.17e-068.27e-05126
GO:000836122ThyroidATCregulation of cell size89/6293181/187231.01e-051.00e-0489
GO:006099815ThyroidATCregulation of dendritic spine development36/629361/187234.10e-053.32e-0436
GO:003051613ThyroidATCregulation of axon extension51/629395/187234.33e-053.50e-0451
GO:010602716ThyroidATCneuron projection organization50/629393/187234.87e-053.88e-0450
GO:004881315ThyroidATCdendrite morphogenesis71/6293146/187231.18e-048.38e-0471
GO:009706115ThyroidATCdendritic spine organization45/629384/187231.27e-049.03e-0445
GO:006138712ThyroidATCregulation of extent of cell growth56/6293110/187231.30e-049.17e-0456
GO:006099911ThyroidATCpositive regulation of dendritic spine development26/629342/187231.60e-041.10e-0326
GO:009917314ThyroidATCpostsynapse organization78/6293168/187233.66e-042.26e-0378
GO:006100114ThyroidATCregulation of dendritic spine morphogenesis27/629347/187236.69e-043.77e-0327
GO:006099712ThyroidATCdendritic spine morphogenesis33/629361/187237.76e-044.28e-0333
GO:006100311ThyroidATCpositive regulation of dendritic spine morphogenesis14/629320/187239.60e-045.13e-0314
GO:005122014ThyroidATCcytoplasmic sequestering of protein15/629322/187239.63e-045.13e-0315
GO:009917512ThyroidATCregulation of postsynapse organization44/629390/187231.89e-039.27e-0344
GO:003030719ThyroidATCpositive regulation of cell growth74/6293166/187232.06e-039.73e-0374
GO:004863815ThyroidATCregulation of developmental growth136/6293330/187232.17e-031.02e-02136
GO:19026831ThyroidATCregulation of receptor localization to synapse12/629318/187234.22e-031.79e-0212
GO:004592720ThyroidATCpositive regulation of growth106/6293259/187237.90e-033.06e-02106
Page: 1 2 3 4 5 6 7 8 9 10 11 12 13 14 15 16 17 18 

check button Enriched KEGG pathways.
Pathway IDTissueDisease StageDescriptionGene RatioBg Ratiopvaluep.adjustqvalueCount
Page: 1 

Top

Cell-cell communication analysis

check buttonIdentification of potential cell-cell interactions between two cell types and their ligand-receptor pairs for different disease states
LigandReceptorLRpairPathwayTissueDisease Stage
Page: 1 

Top

Single-cell gene regulatory network inference analysis

check buttonFind out the significant the regulons (TFs) and the target genes of each regulon across cell types for different disease states
TFCell TypeTissueDisease StageTarget GeneRSSRegulon Activity
∗The dot plots of a searched regulon are shown for all cell subpopulations in each disease state of each tissue based on the regulon specific score inferred using pySCENIC and by calculating the average expression.
Page: 1 

Top

Somatic mutation of malignant transformation related genes

check buttonAnnotation of somatic variants for genes involved in malignant transformation
Hugo SymbolVariant ClassVariant ClassificationdbSNP RSHGVScHGVSpHGVSp ShortSWISSPROTBIOTYPESIFTPolyPhenTumor Sample BarcodeTissueHistologySexAgeStageTherapy TypesDrugsOutcome
DBN1SNVMissense_Mutationc.1756N>Ap.Glu586Lysp.E586KQ16643protein_codingdeleterious(0)probably_damaging(0.986)TCGA-A8-A09Z-01Breastbreast invasive carcinomaFemale>=65I/IIUnknownUnknownSD
DBN1SNVMissense_Mutationnovelc.661N>Cp.Glu221Glnp.E221QQ16643protein_codingdeleterious(0.02)probably_damaging(0.997)TCGA-AC-A23H-01Breastbreast invasive carcinomaFemale>=65I/IIUnknownUnknownPD
DBN1SNVMissense_Mutationrs558662294c.170N>Tp.Ser57Leup.S57LQ16643protein_codingtolerated(0.05)possibly_damaging(0.865)TCGA-AN-A046-01Breastbreast invasive carcinomaFemale>=65I/IIUnknownUnknownSD
DBN1SNVMissense_Mutationnovelc.72N>Cp.Arg24Serp.R24SQ16643protein_codingtolerated_low_confidence(0.11)benign(0.271)TCGA-C8-A12U-01Breastbreast invasive carcinomaFemale<65I/IIUnknownUnknownSD
DBN1SNVMissense_Mutationc.1231N>Ap.Ala411Thrp.A411TQ16643protein_codingtolerated(0.16)benign(0.015)TCGA-D8-A1XQ-01Breastbreast invasive carcinomaFemale>=65I/IIUnknownUnknownSD
DBN1insertionIn_Frame_Insnovelc.678_679insAAATTCTGCCCTTCCCCACTCGCCAGCTCCTGGCAACGACCAp.Arg226_Tyr227insLysPheCysProSerProLeuAlaSerSerTrpGlnArgProp.R226_Y227insKFCPSPLASSWQRPQ16643protein_codingTCGA-BH-A0HK-01Breastbreast invasive carcinomaFemale>=65I/IIHormone TherapyarimidexSD
DBN1insertionFrame_Shift_Insnovelc.72_73insTTp.Gln25PhefsTer42p.Q25Ffs*42Q16643protein_codingTCGA-C8-A12U-01Breastbreast invasive carcinomaFemale<65I/IIUnknownUnknownSD
DBN1SNVMissense_Mutationc.505G>Cp.Asp169Hisp.D169HQ16643protein_codingdeleterious(0)probably_damaging(0.991)TCGA-EK-A2RJ-01Cervixcervical & endocervical cancerFemale<65I/IIUnknownUnknownSD
DBN1SNVMissense_Mutationc.1028N>Tp.Ser343Phep.S343FQ16643protein_codingdeleterious(0)probably_damaging(0.961)TCGA-FU-A40J-01Cervixcervical & endocervical cancerFemale<65III/IVChemotherapycarboplatinCR
DBN1SNVMissense_Mutationnovelc.1879N>Tp.Pro627Serp.P627SQ16643protein_codingdeleterious(0)probably_damaging(0.999)TCGA-LP-A4AU-01Cervixcervical & endocervical cancerFemale<65III/IVChemotherapycisplatinCR
Page: 1 2 3 4 5 6 7 8 

Top

Related drugs of malignant transformation related genes

check buttonIdentification of chemicals and drugs interact with genes involved in malignant transfromation
(DGIdb 4.0)
Entrez IDSymbolCategoryInteraction TypesDrug Claim NameDrug NamePMIDs
Page: 1